Characterizing Håkon Mosby Mud Volcano (Barents Sea) cold seep systems by combining ROV-based acoustic data and underwater photogrammetry
 Luca Fallati1,2*
  Giuliana Panieri3*
  Claudio Argentino3
  Andrea Giulia Varzi1
  Stefan Bünz3
  Alessandra Savini1,2
- 1Department of Earth and Environmental Sciences, University of Milano-Bicocca, Milano, Italy
- 2MaRHE Center (Marine Research and High Education Centre), Magoodhoo Island, Faafu Atoll, Republic of Maldives
- 3Department of Geosciences, UiT - The Arctic University of Norway, Tromsø, Norway
Cold-seeps have a unique geo-ecological significance in the deep-sea environment. They impact the variability of present-day submarine sedimentary environments, affecting the evolution of the landscape over time and creating a variety of submarine landforms, one of which is Mud Volcanoes (MVs). MVs form due to the extrusion of mud, fluids, and gas, mainly methane, from deeper sedimentary layers. These natural gas seepage systems could significantly affect climate change and the global carbon cycle. We present a comprehensive method that combines ROV-based multibeam mapping and underwater photogrammetry to enhance the understanding of the physical relationships between geomorphic units characterizing the Håkon Mosby Mud Volcano (HMMV) and the distribution of associated habitats. HMMV is indeed characterized by high thermal and geochemical gradients from its center to the margins resulting in a clear zonation of chemosynthetic communities. Our approach integrates multi-resolutions and multi-sources data acquired using a work-class ROV. The ROV-based microbathymetry data helped to identify the different types of fine-scale submarine landforms in the central part of HMMV. This revealed three distinct geomorphic units, with the central hummocky region being the most complex. To further study this area, ROV images were analyzed using a defined Structure from Motion workflow producing millimetric resolution 2D and 3D models. Object-Based Image Analysis (OBIA), applied on orthomosaics, allowed us to obtain a fine classification of main benthic communities covering a total area of 940m2, including the active seepage area of the hummocky rim. Four major substrate types were identified in these regions: uncovered mud, bacterial mats high-density, bacterial mats low-density, sediments and tubeworms. Their relationship with terrain morphology and seepage activity were investigated at different spatial scales, contributing to a deeper understanding the ecological functioning of cold seep ecosystems in MVs. The applied workflow is proposed as an innovative processing technique for future studies on cold-seep systems. Geomorphic and ecological processes in extreme environments are inherently linked and marked by spatial patterns typifying associated habitats and sedimentary environments. This is poorly investigated in previous studies, leaving a substantial gap in the geomorphological drivers responsible for habitat distribution and extent in cold seep systems.
Introduction
The diversity and ecological significance of the deep ocean are a growing areas of interest in scientific research, not only for improving the understanding on the planet’s biodiversity and functioning but also for sustainable resource management, conservation efforts, and for addressing global challenges like climate change and ocean health (Mengerink et al., 2014; Thurber et al., 2014; Ramirez-Llodra, 2020). However, the extent and variability of ecologically significant deep-sea benthic habitats are still poorly known (Mayer et al., 2018; Wölfl et al., 2019). The great depths make it challenging for researchers and equipment to access and explore deep-sea benthic habitats at fine-scale, and only the use of large infrastructures (i.e. Research Vessel) and advanced ocean technology (i.e.: remotely operated vehicles - ROVs and autonomous underwater vehicles - AUVs, Huvenne et al., 2018; Whitt et al., 2020) can support the challenging aspect of collecting reliable datasets, especially where the deep landscape shows extreme conditions and a topographic complexity often associated with high lateral variability (Bell et al., 2022), as in the case of cold-seep systems. Cold-seep systems have an important ecological significance (Kallmejer, 2017), affecting the evolution of the submarine landscape in space and time (Etiope, 2015), and creating a variety of submarine landforms, among which Mud Volcanoes (MVs).
Submarine MVs are positive, dome-shaped landforms, formed by the extrusion of mud, fluids and gas (primarily methane) from deeper sedimentary layers (Kopf, 2002; Mazzini and Etiope, 2017). They represent natural gas seepage systems, and since methane is a relevant greenhouse gas, MVs have important implications for climate change and the global carbon cycle (Sauter et al., 2006; Perez-Garcia et al., 2009; Etiope, 2015; Andreassen et al., 2017). As other seepage systems, MVs can also support important ecosystems at the seafloor (MacDonald et al., 2000; Levin et al., 2015; Niemann et al., 2006; Joye, 2020). The sulfate-driven anaerobic oxidation of methane (AOM) occurring in the sediments close to the seafloor releases reduced chemical compounds, i.e. hydrogen sulfides, into the pore waters. These sulfides diffuse toward the seafloor and sustain chemosynthetic communities and complex food webs (Aloisi et al., 2002; Dubilier et al., 2008; Foucher et al., 2009; Joye, 2020). Since chemosynthetic biological communities thrive under uncommon environmental conditions, especially considering the steep chemical (and often thermal) gradient, cold seep systems such as MVs are usually indicated as submarine extreme environments (Kallmejer, 2017).
Submarine MVs have thus attracted considerable scientific interest due to the complex geological and biological interactions that create distinct deep-sea environments (Gebruk et al., 2003; Jerosch et al., 2007). The MVs dome-shaped landforms can largely vary in diameter (up to a few kilometers) and heights (up to a few tens of meters above adjacent seafloor) (Mazzini and Etiope, 2017). Their discovery at the seafloor generally involves ship-based research surveys carried out using a combination of acoustic remote sensing techniques to collect high-resolution bathymetric measurements and seafloor backscattering data (Judd and Hovland 2007; Savini et al., 2018) using multibeam echosounders (MBES). However, as the water depth increases, the resolution of ship-based MBES surveys decreases (Mayer et al., 2018; Savini et al., 2021). In deeper waters, the “beam footprint” (i.e.: the size of each individual data point or sound pulse transmitted by the MBES system - Clarke, 2018) may range from a few meters to a few tens of meters, and the detection of complex surface topography might be more challenging or even not possible because of the resulting low resolution. In such cases, the use of complementary methods, such as ROVs and/or AUVs, may be necessary for detailed mapping and direct exploration (Huvenne et al., 2018). Several deep-water MVs have been explored and mapped through ROV-based multibeam surveys (Dupré et al., 2008; Foucher et al., 2009; Foucher et al., 2010; Paull et al., 2015; Loher et al., 2018; Blouin et al., 2019; Lee et al., 2021), to investigate the extent to which the unique habitats of these dome-shaped features could be linked to the observed fine-scale variability in their geomorphic, biogeochemical, and ecological processes. (Lee et al., 2021).
In the last decades, high-resolution seafloor habitat mapping achieved using ROVs equipped with MBES has greatly revolutionized the field of marine exploration and data acquisition (Opderbecke et al., 2004; Singh et al., 2004; Dupré et al., 2008; Foubert et al., 2011; Lim et al., 2018). In addition, the improved quality, accuracy, and resolution of ROVs underwater cameras and positioning systems allow nowadays to generate scaled and georeferenced two and three-dimensional (2D, 3D) models of deep-sea underwater features (Marcon et al., 2013; Marcon 2014) by employing advanced image processing techniques such as Structure from Motion (SfM) (Conti et al., 2019; Price et al., 2019; Lim et al., 2020). SfM is a computer vision technique that reconstructs 3D structures and camera motion from a sequence of overlapping 2D images or video frames (Westoby et al., 2012). This technique has gained popularity in marine imaging research, both in shallow and deep-sea environments (Leon et al., 2015; Robert et al., 2017; Price et al., 2019; Montalbetti et al., 2022).
In this work, using a novel dataset, we combine data from ROV microbathymetry and ultra-high resolution SfM to enhance our understanding of the geomorphological and ecological characteristics of the Håkon Mosby Mud Volcano (HMMV). Located in the southwestern Barents Sea, HMMV has captured the interest of researchers since its discovery, and it has served as a natural study laboratory for various disciplines over the years (Gebruk et al., 2003; De Beer et al., 2006; Niemann et al., 2006; Jerosch et al., 2007; Perez-Garcia et al., 2009; Rybakova Goroslavskaya et al., 2013; Åström et al., 2020). Terrain variables with a resolution never achieved before, have been derived to correlate the variability of the fine-scale submarine landforms that shape a large sector of the HMMV and the spatial pattern that clearly distinguishes the associated benthic communities. The proposed workflow, along with innovative processing techniques, can serve as a benchmark for future studies on cold-seep systems.
Materials and methods
Study area
The Håkon Mosby Mud Volcano (HMMV) is situated at about 100 km from the southern west Norwegian coast, in the Barents Sea., at 1250 m below the sea surface (Figure 1). The HMMV was discovered in 1987 during an oceanographic expedition dedicated to the regional SeaMARC II side-scan sonar survey (Vogt et al., 1997; Vogt et al., 1999). Since then, extensive ship-based research expeditions and investigations documented the key geological (Perez-Garcia et al., 2009), geochemical (De Beer et al., 2006), geomorphological (Jerosch et al., 2007), bio-ecological and microbiological (Gebruk et al., 2003; Niemann et al., 2006; Rybakova Goroslavskaya et al., 2013; Åström et al., 2020) aspects that have called for its formation processes and ecological patterns.
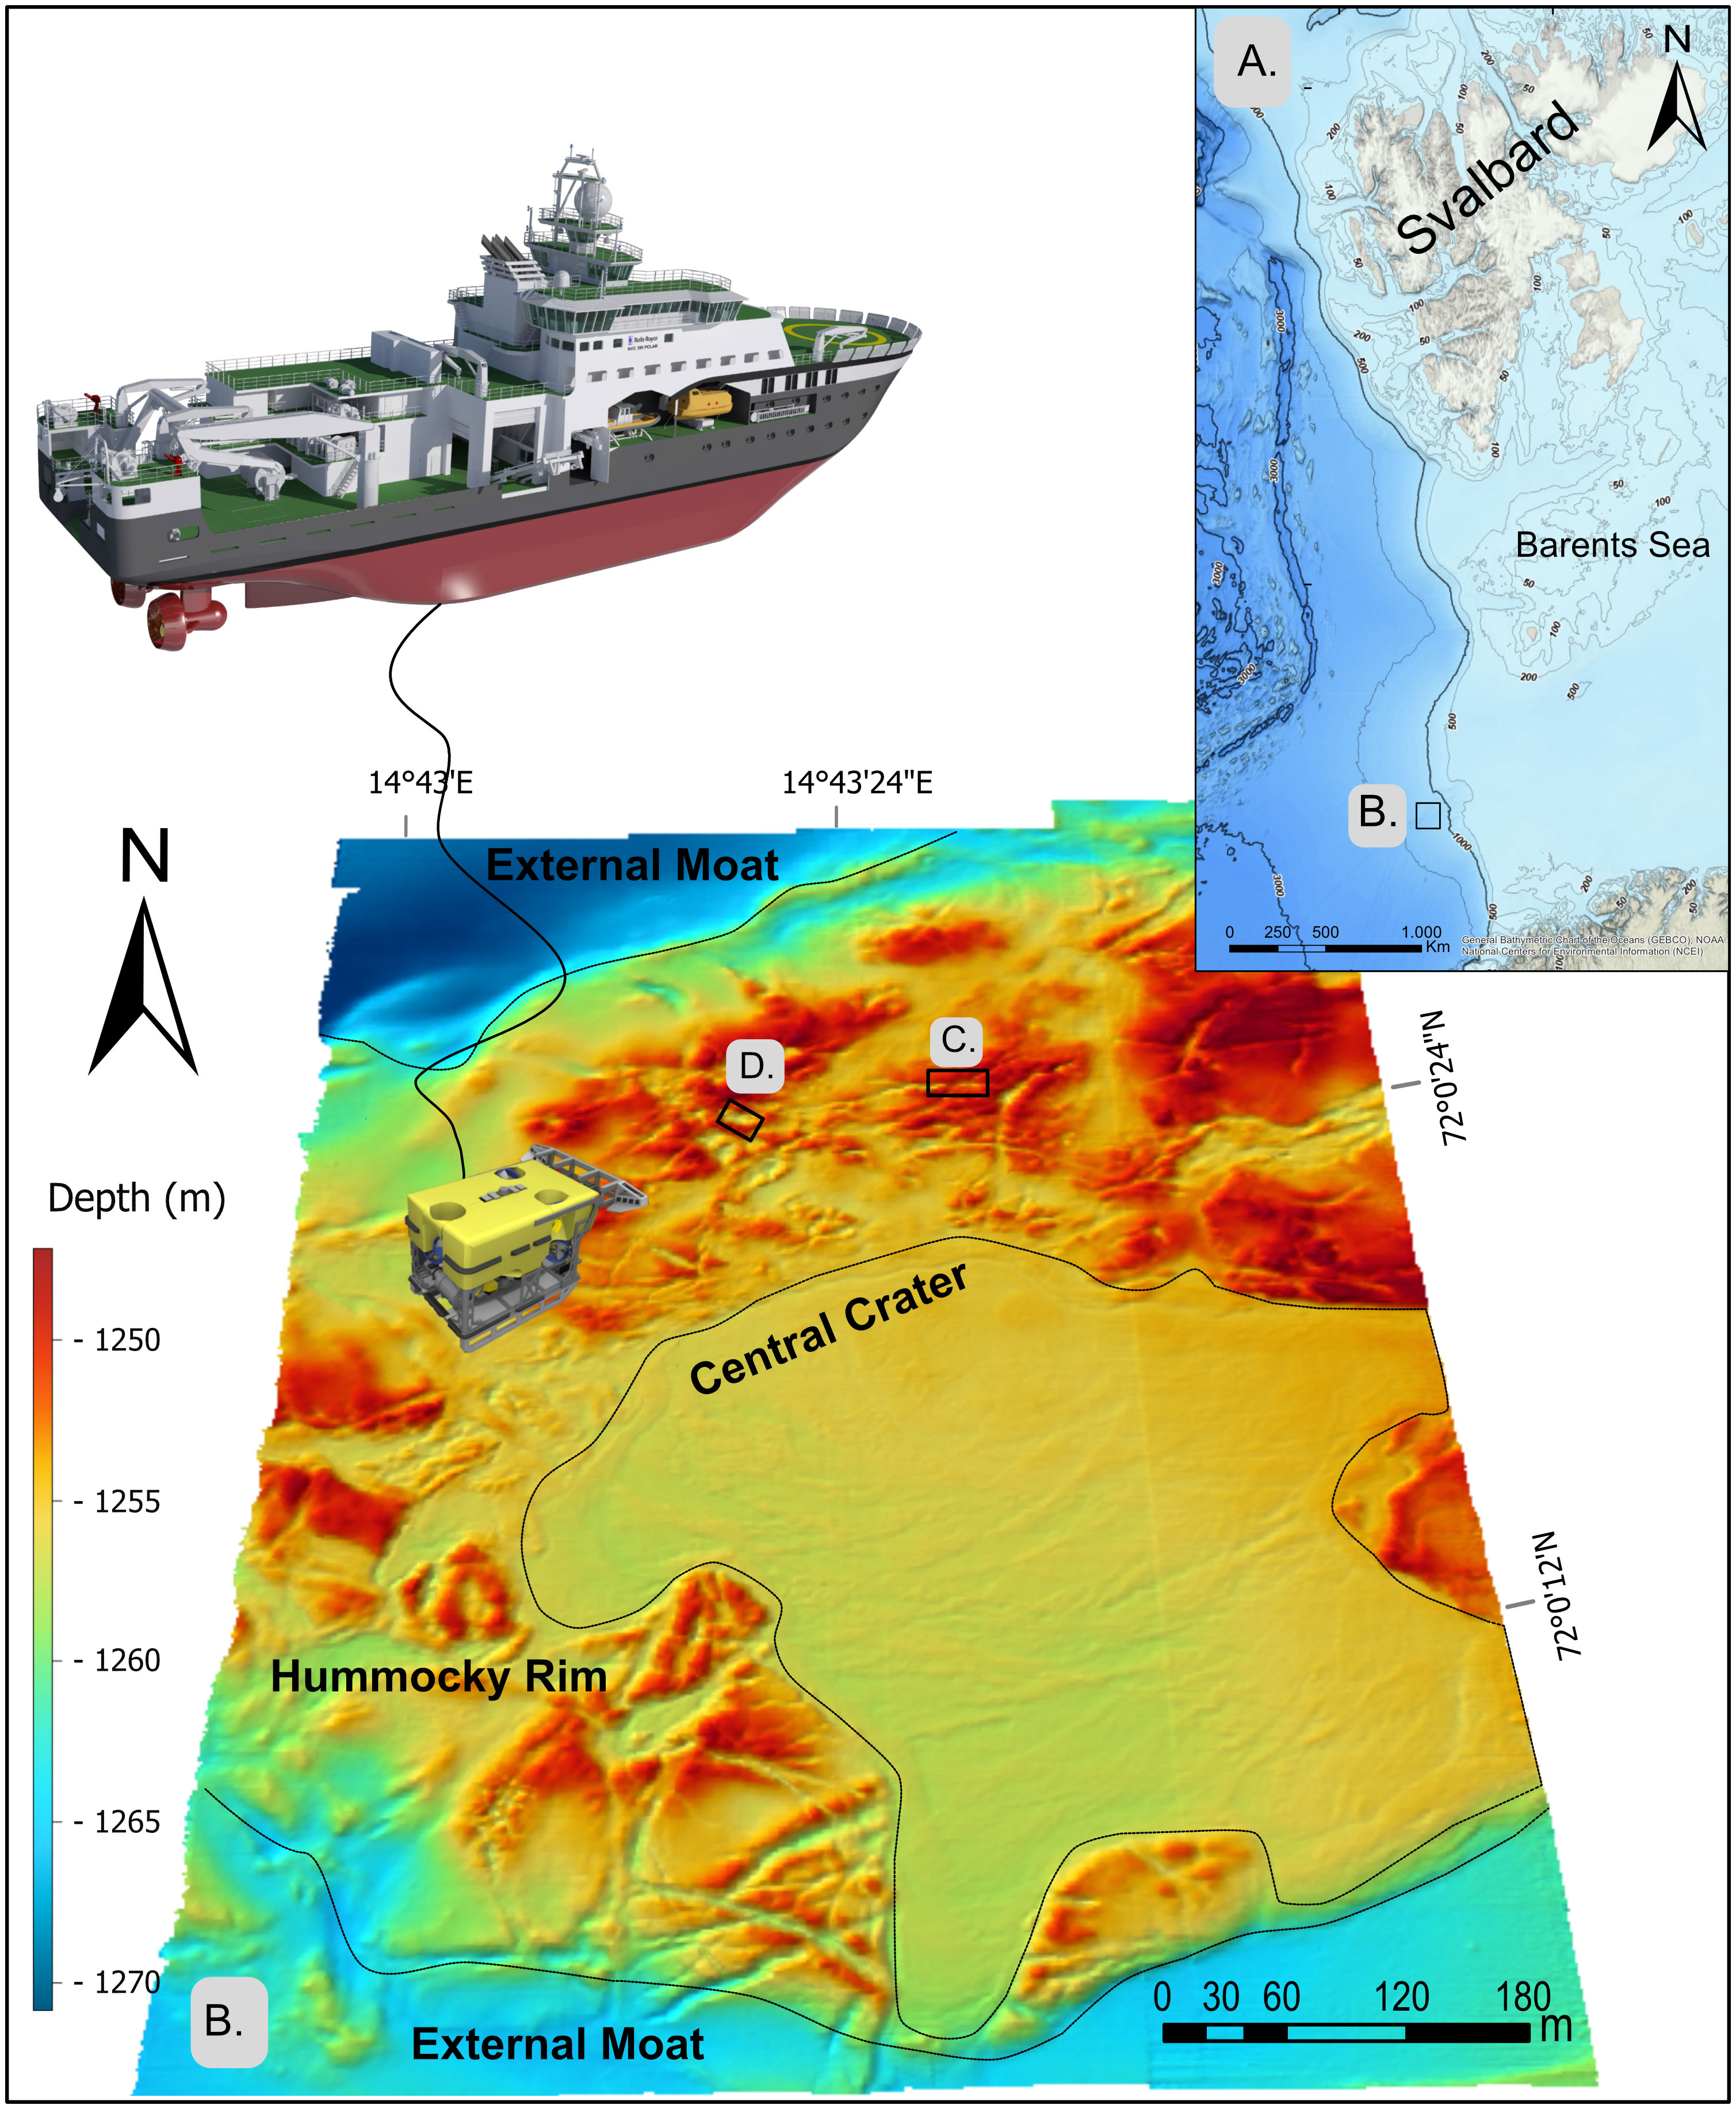
Figure 1 Study site area. (A) indicates the Barents Sea, and (B) indicates the position of HMMV. (B) represents the ROV microbathymetry of the central part of HMMV acquired with Ægir 6000 ROV and R/V Kronprins Håkon (not in scale). (C, D) indicate the two areas mapped with ROV photogrammetry during DIVE 26a and DIVE 26b.
The southwestern Barents Sea margin separates the oceanic Eocene-Early Oligocene oceanic crust in the Lofoten Basin from the continental crust in Barents Sea (Faleide et al., 1996; Milkov et al., 2004). Marine geophysical surveys have revealed through time that HMMV lies within a slide scar (Laberg and Vorren, 1993; Laberg and Vorren, 1996) near the depocenter of the Bear Island sedimentary fan. It is underlain by a sequence of Cenozoic sediments more than 6 km thick (Fiedler and Faleide, 1996; Hjelstuen et al., 1999). The boundary between the preglacial bio-siliceous ooze and the glacial mud, lies approximately 3 km below the seafloor and dates to 2.3 Ma, indicating a high sedimentation rate of 1.3 m per 1000 years (Fiedler and Faleide, 1996; Hjelstuen et al., 1999; Perez-Garcia et al., 2009). The deformation below HMMV, as observed in seismic profiles, extends at least to the base of the glacial unit (Hjelstuen et al., 1999).
HMMV forms a typical cone-shaped landform that rises about 100 m above the seafloor, and has a base diameter of approximately 1.5 km (Hjelstuen et al., 1999; Vogt et al., 1999). The central area covers 1.2 km2 and has a relief of 7 to 15 m (Foucher et al., 2010).
The structure of HMMV can be divided into three well-defined morphological units, as described by Jerosch et al. (2007) and Milkov et al. (2004). The volcano’s central crater (1) corresponds to a flat area formed by recent mudflow, and around it, a hummocky rim (2) with varying width and height defines its perimeter (Figure 1B). The width ranges from 440 m in the North to 10 m in the South-West, and the maximum height is 10 m towards the central area. The third unit is a 2 m deep circular moat (3) that surrounds the other two units, with a 100 to 270 m width.
Studies have shown that areas with high methane sediment concentration and CH4 seepage are mostly found in the central and hummocky rims (Jerosch et al., 2007; Feseker et al., 2008). These areas are dominated by chemoautotrophic organisms, such as Beggiatoa mats and pogonophora tubeworms, as well as associated macrofauna (Gebruk et al., 2003; Niemann et al., 2006; Jerosch et al., 2007). However, the abundance of these communities is minor in the moat area due to to lower CH4 fluxes (Jerosch et al., 2007).
ROV data collection
The present study is based on a novel set of data collected during the CAGE 21-1 cruise of R/V Kronprins Håkon from May 22nd to June 9th, 2021 (Bünz and Panieri, 2022). The primary objective of the cruise was to utilize the Ægir 6000 ROV (Kystdesign AS, Haugesund, Norway) to capture guided video imagery and study methane seepage systems. Throughout the cruise, a total of 26 dives were conducted, with four (DIVE 23 to DIVE 26) committed to the exploration of the HMMV.
DIVE 23 and DIVE 24 were dedicated to an initial MBES data acquisition. The ROV was equipped with the high-frequency EM 2040 (Simrad Kongsberg) MBES. Data were acquired along four 1 km long transects flying 60 meters above the seafloor, obtaining a microbathymetric map of the central part of HMMV, with a resolution of 0.6 meters/pixel (Figure 1B). Data acquisition was planned and managed with EIVA NaviSuite® software, and raw MBES data were then processed and cleaned using EIVA NaviModel Producer®.
DIVE 25 was dedicated to visually exploring the entire area. Instead, DIVE 26 focused on video surveys for photogrammetric mosaicking of two regions of the hummocky rim, hereinafter defined as DIVE 26a and DIVE 26b. For this purpose, the ROV was equipped with a dedicated photogrammetry tool sledge (Figure 2A) with a Spinner II Shark - High-End HD Zoom camera (Imenco®) pointed 90° downward, with the lens parallel to the seafloor, two additional strobes able to generate more than 2500W to enlighten the seafloor uniformly, and two deep-sea power lasers spaced at 14 cm. Before the photogrammetric dives, an experimental methodological protocol was designed on board, focusing on defining: (1) camera position and orientation, (2) intensity and coverage of lighting on the footage, (3) survey speed and altitude, and (4) appropriate overlap between adjacent lines, considering the seafloor morphological complexity. Data were then acquired in two selected areas on the north hummocky periphery rim (Figure 2B).
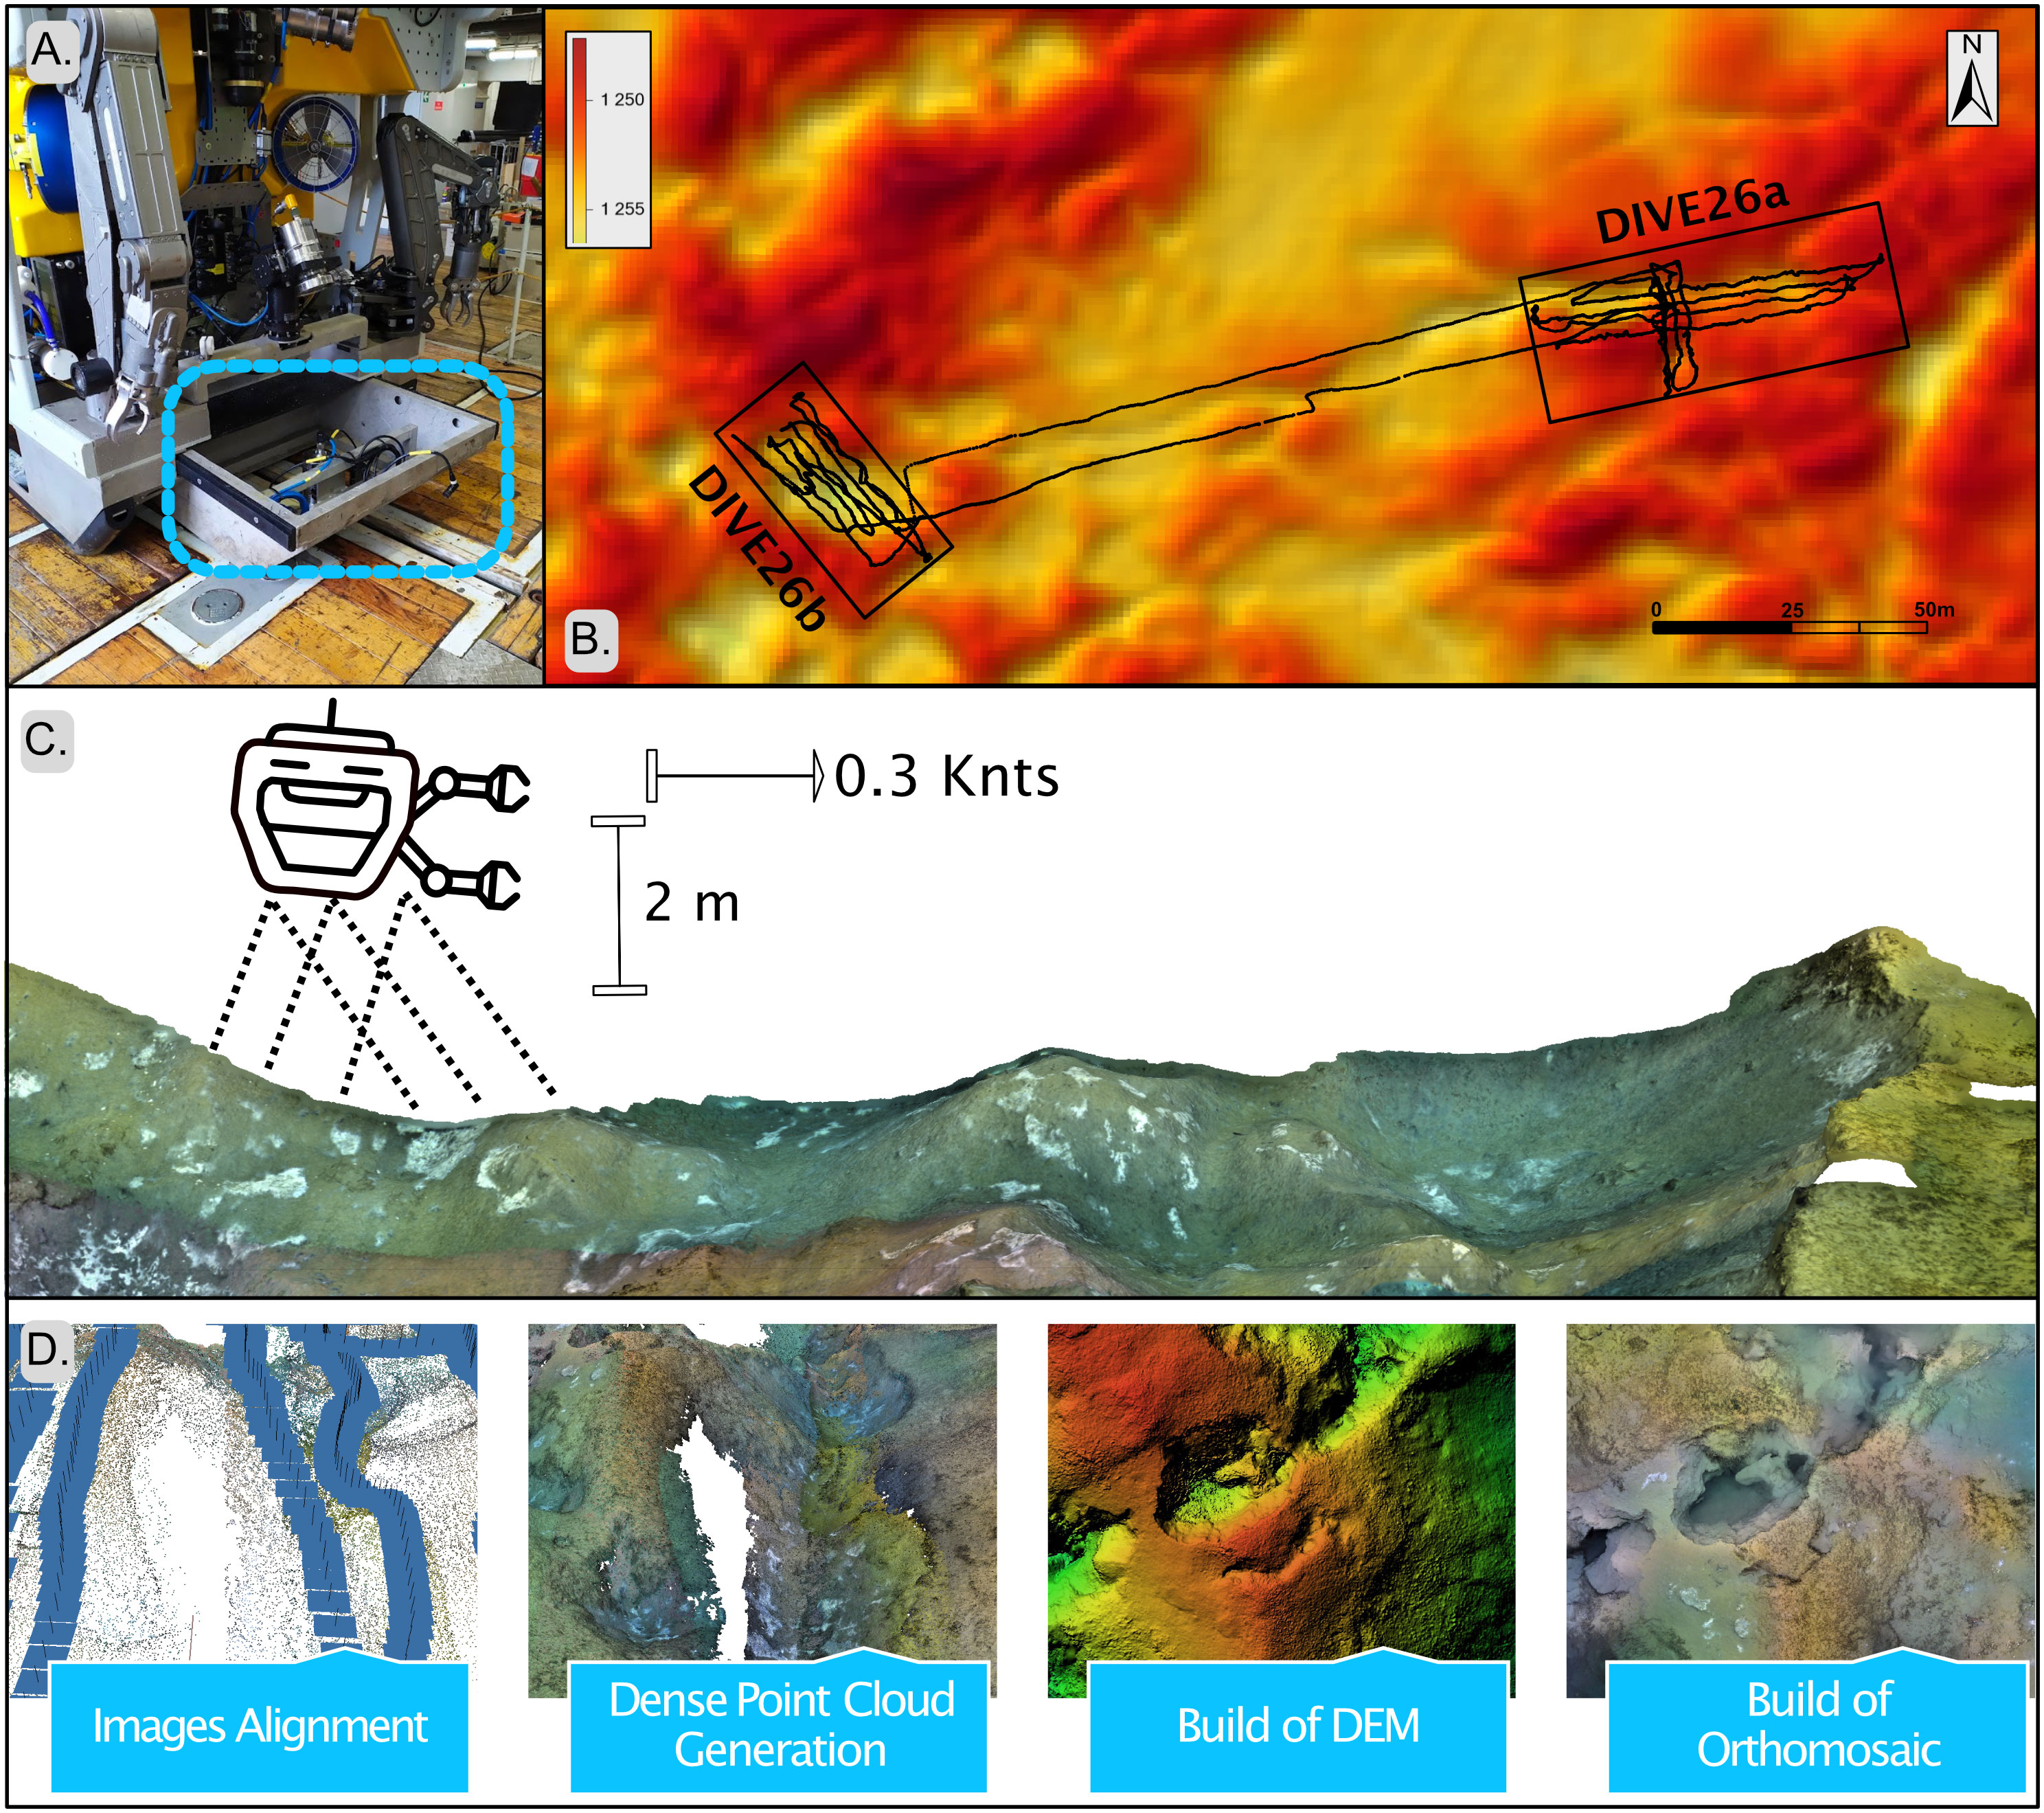
Figure 2 (A) Ægir600 ROV with dedicated photogrammetry sledge (B) Zoom on the two areas mapped and the ROV tracks. (C) Schematic representation of the ROV photogrammetric acquisition with altitude from the seafloor and speed maintained during the acquisition. (D) Main steps of the photogrammetric workflow in Agisoft Metashape.
During DIVE 26a (Figure 2B) were acquired 6 parallel video transects, 1.8 m spaced and approximately 50 meters long, with a survey speed of ≤ 0.3 knots. This area presented a complex seafloor morphology. For this reason, we added 3 transversal lines crossing the central part of the main video transects, to guarantee the proper overlap between the lines. On the other side, DIVE 26b (Figure 2B) inspected a slightly rounded depression, similar to a small crater. There, 5 parallel video transects were performed, 1.8 m spaced and approximately 30 m long, with a survey speed of ≤ 0.3 knots.
Positioning data for the all the ROV dives (MBES and photogrammetry) were obtained using the HIPAP 501 USBL (Ultra Short Base Line) high-precision underwater system. Such data was subsequently utilized to accurately scale and position the acquired models in their respective geographical contexts.
ROV video preprocessing and SfM models reconstruction
From the video acquired during DIVE 26a and 26b, 1 frame per second (a photogram every 30) was automatically extracted using the Scene Video Filter function of VLC Media Player®. The photograms, with a resolution of 1920x1080 pixels, were saved in PNG format and sorted by dive and the number of transects in each dive (Table 1). All the images were imported in Agisoft Metashape 1.8 Professional Edition® (Agisoft, 2018) and processed following a well-established photogrammetric workflow (Young et al., 2017; Price et al., 2019; Fallati et al., 2020; Lim et al., 2020; Ventura et al., 2020; Ventura et al., 2022; Montes-Herrera et al., 2023). First, an initial camera alignment called Align Photos was performed. This step involves estimating the camera positions and orientations in the scene by identifying overlapping features in the images (Agisoft, 2018). Once the photos were aligned, a detailed 3D Dense Point Cloud was generated. The point cloud serves as the base surface from which an ultra-high-resolution (mm) Digital Elevation Model (DEM) and an Orthomosaic were created for both dives (Figure 2D). During the SfM process, the models were accurately scaled using the two laser pointers as a scale bar.
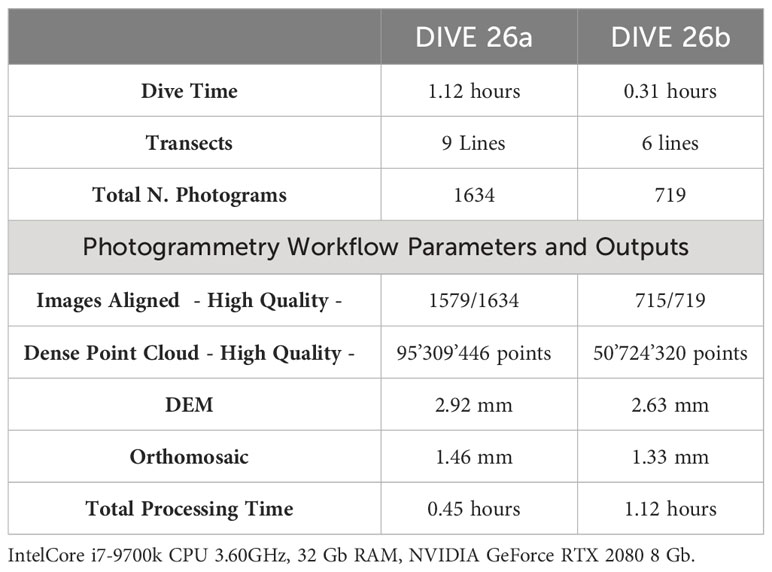
Table 1 ROV acquisition parameters, the photogrammetry workflow parameters and the workstation processing characteristics.
After scaling the models, we combined the data derived from USBL (time and coordinates), plotted as point shape file tracks in ArcGIS®, to some of the video frames used in SfM processing. We mostly selected the frames on the edge of the lines and in the middle of the models, correlating the times of these frames with the time and the position of the ROV recorded by the UBLS. Moreover, we also used as a reference the small-scale geomorphic elements detected by ROV-based microbathymetry also visible in the SfM DEMs, to spatially link the two models. This helped us to accurately georeference the models in WGS 84/UTM Zone 33N (Lim et al., 2020).
HMMV high-resolution geomorphometric analysis
Bathymetric layers, such as the processed microbathymetry from ROV and high-resolution DEMs extrapolated from SfM, were imported into ArcGIS Pro® 3.1. The 3D Analyst and Spatial Analyst functions were used to calculate terrain descriptors such as aspect, slope, and roughness for all the models, and Topographic Position Index (TPI) on the ROV microbathymetry. Aspect indicates the orientation of the slopes, expressed in cardinal directions. Slope measures the vertical gradient of the surface in degrees. Roughness measures the heterogeneity of the surface by calculating the difference between the minimum and maximum bathymetric values over a specific surface area. Lastly, TPI (based on a neighborhood size of 10 m) estimates the difference in bathymetry between a central cell and the mean value of surrounding cells within a given group (Sappington et al., 2007; Walbridge et al., 2018).
Seafloor features classification using OBIA
The ultra-high resolution orthomosaics derived from SfMs were imported in eCogniton® Developer 10.3 to perform Object-Based Image Analysis (OBIA) processing. OBIA is a commonly used technique for automatically analyzing images and categorizing features from data gathered from various remote sensors (Hossain and Chen, 2019). The methodology involves two main steps: the application of segmentation algorithms to group pixels into homogenous regions (segments), based on their spectral and geometric characteristics, and the classification of these segments into specified classes (Ventura et al., 2018; Conti et al., 2019; Hossain and Chen, 2019; Fallati et al., 2020).
A Multiresolution Segmentation algorithm was applied to the georeferenced orthomosaics, based on homogeneity criteria (Figure 3). The image layer weights were set equal for all three bands, and the optimal scale parameter found was set as 200 after several attempts. A shape value of 0.1 and compactness of 0.5 were established for the homogeneity criteria. After the segmentation process, a Supervised Classification Technique was used to classify the two surfaces into the four substrate types that characterize the study area: Bacterial Mats High-Density, Bacterial Mats Low-Density, Uncovered Mud, Sediment and Tubeworms. The classification scheme was built based on ROV video analysis, where classes were derived from Jerosch et al. (2007) and Gebruk et al. (2011). At least 30 well-defined samples were selected for each class to serve as training areas for the classification algorithm. Thanks to the high-quality data and the millimetric resolution of the obtained models, the different substrates were easily detected on the orthomosaics. The Support Vector Machine (SVM) algorithm was used to classify the segments considering all information derived from the input dataset, such as spectral value, brightness, size, shape and texture. We used a linear kernel type and a SVM-parameter of 2. SVM has gained much popularity in the scientific community and has proven to provide higher accuracy compared to parametric classification algorithms, such as Machine Learning (Mountrakis et al., 2011; Wahidin et al., 2015; Wicaksono et al., 2019). After the classification, the adjacent segments were merged, and the final output was exported as a shapefile.
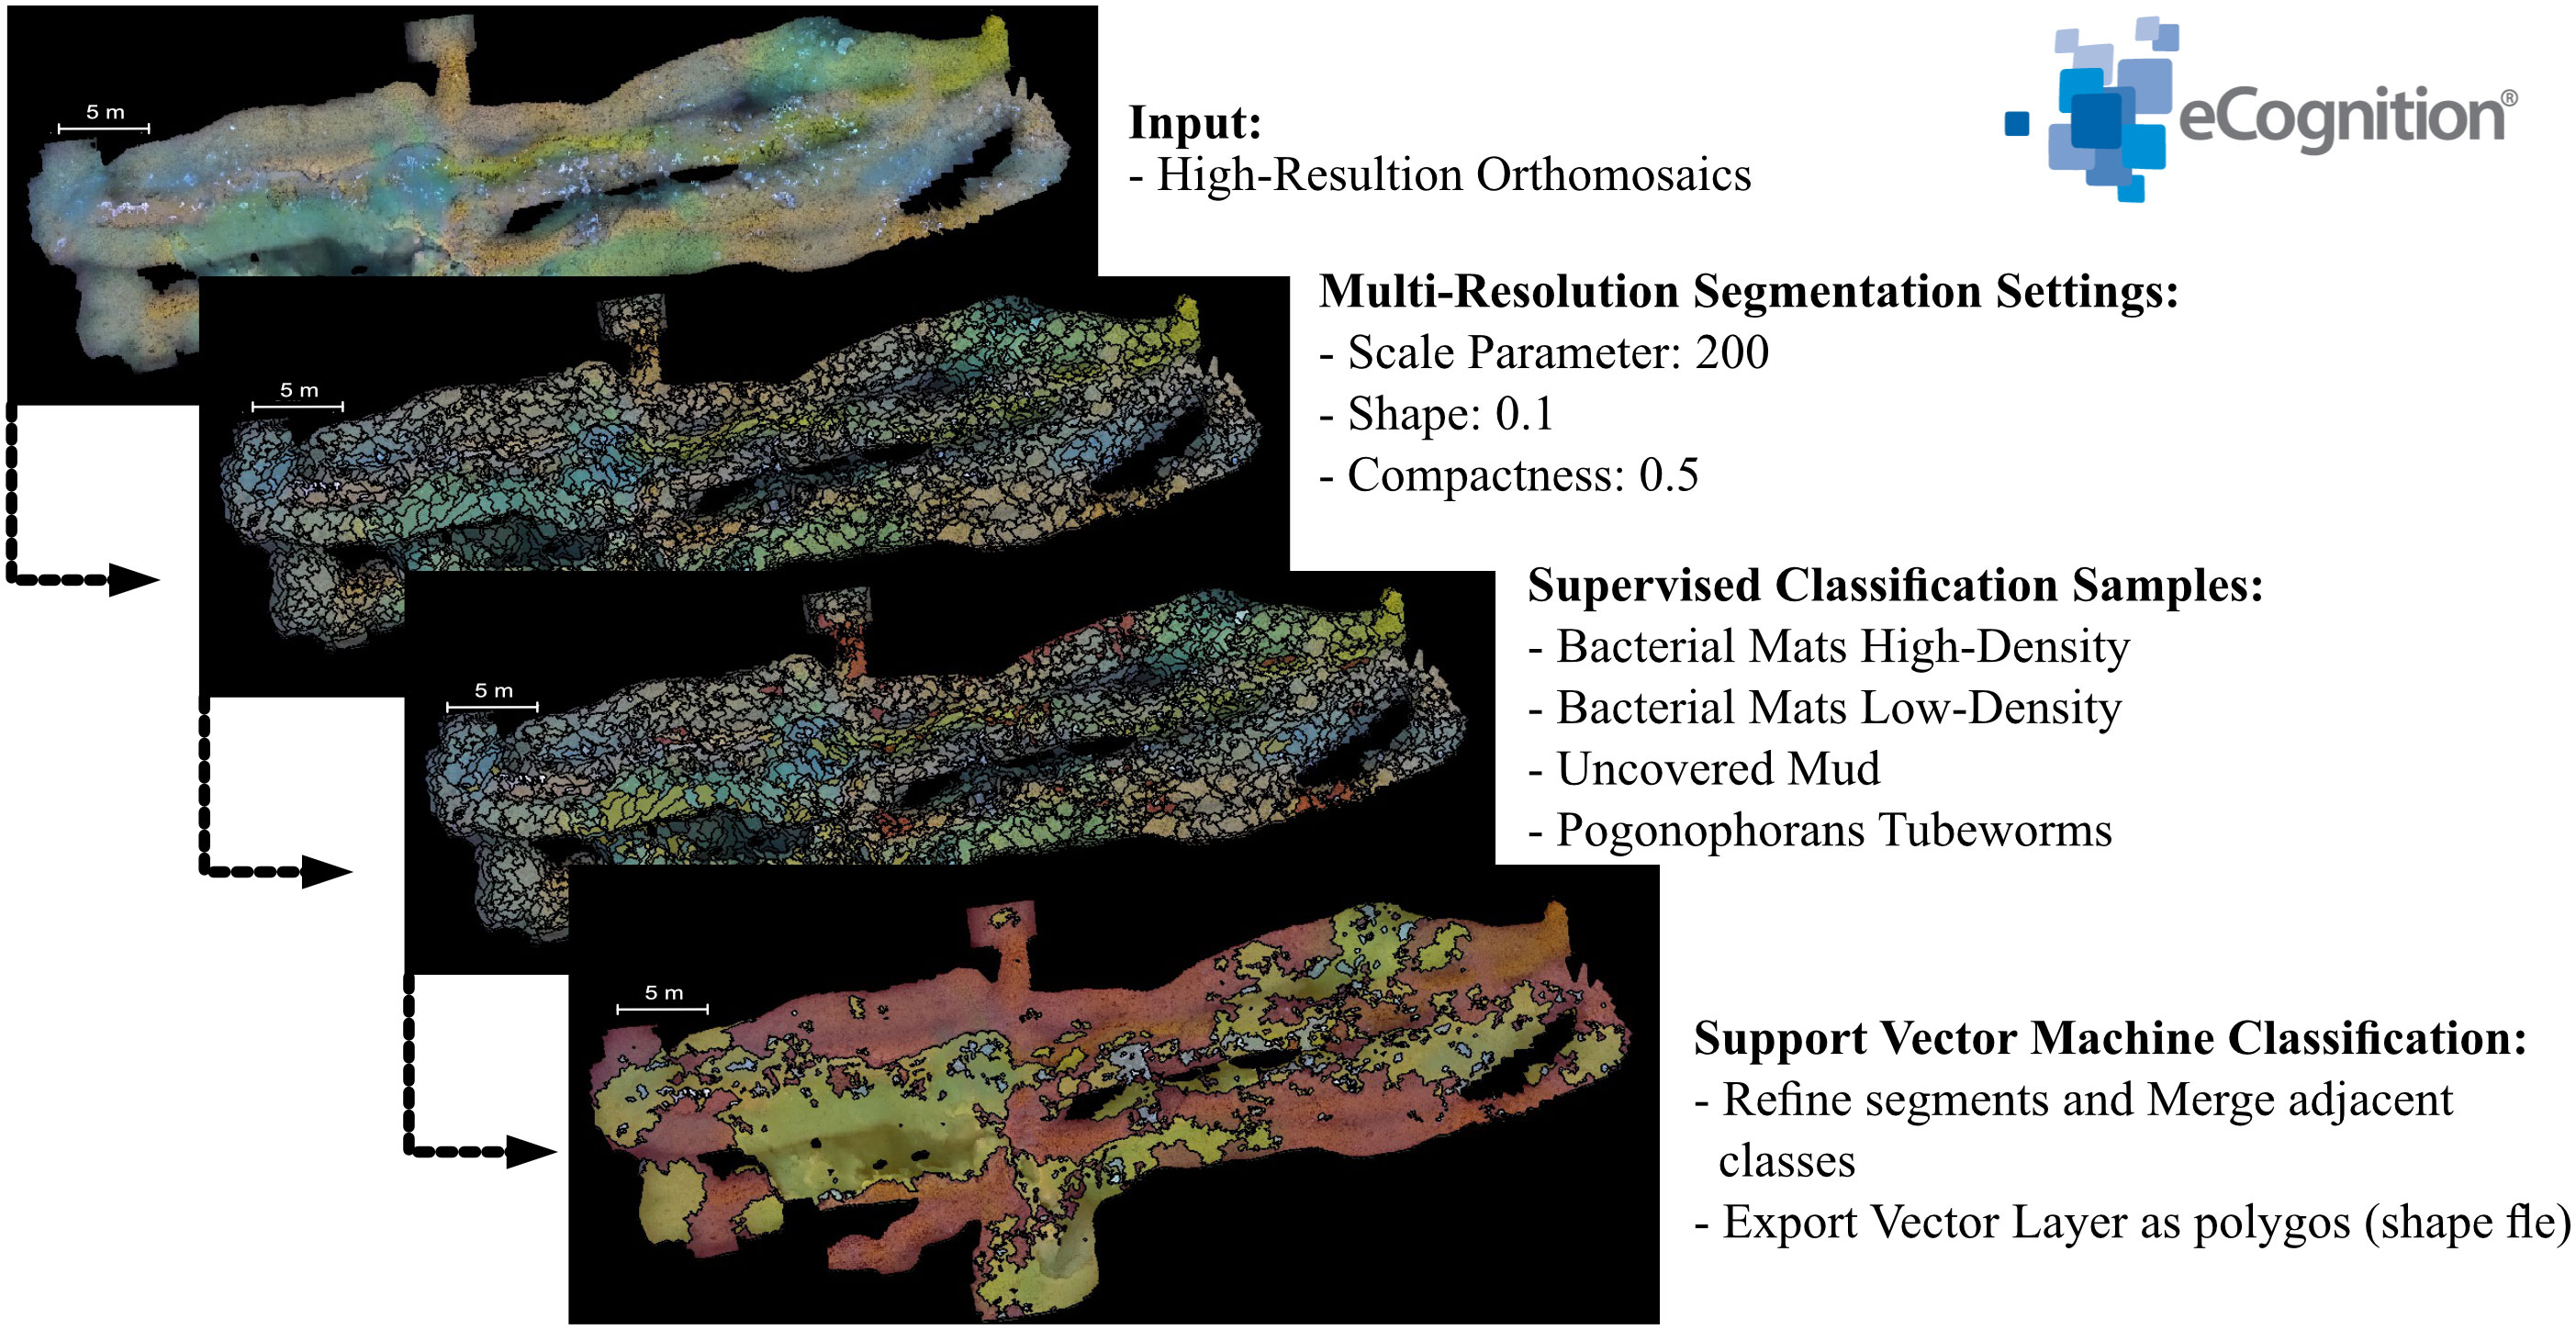
Figure 3 OBIA methodology workflow with eCogniton Developer 10.3 for the classification of ultra-high resolution ROV orthomosaics.
Classification accuracy assessment
The accuracy assessment of the obtained classified maps was done in ArcGIS Pro® 3.1 environment. On each map, 200 random points were plotted, equally distributed among the different classes, using the create accuracy assessment points function. The accuracy of the maps was determined by manually classifying the points and comparing them to the orthomosaics, which served as the ground truth layer. The high resolution of the models (∼1.5 mm/pix) allowed one of the co-authors, with expertise in cold seeps, to conduct an on-screen check of the benthic communities. The accuracy was further evaluated using a confusion matrix (compute confusion matrix function) to estimate the user and producer accuracy, the maps’ overall accuracy, and the kappa index. (Landis and Koch, 1977).
Results
HMMV microbathymetry: geomorphometric analysis
Thanks to the microbathymetry resolution of 0.6 m/cell, it was possible to obtain accurate descriptors of the seafloor morphology (Figure 4) that highlighted a precise subdivision of three main geomorphic units already described by Jerosch et al. (2007): a flat central crater, a peripheral hummocky rim and the external moat (partially covered by our survey to the northwest portion of the map). Geomorphometric parameters such as slope and ruggedness (Figures 4A, B) revealed areas with higher terrain complexity in the hummocky region, with an average slope higher than 40° and ruggedness values > 0.05.
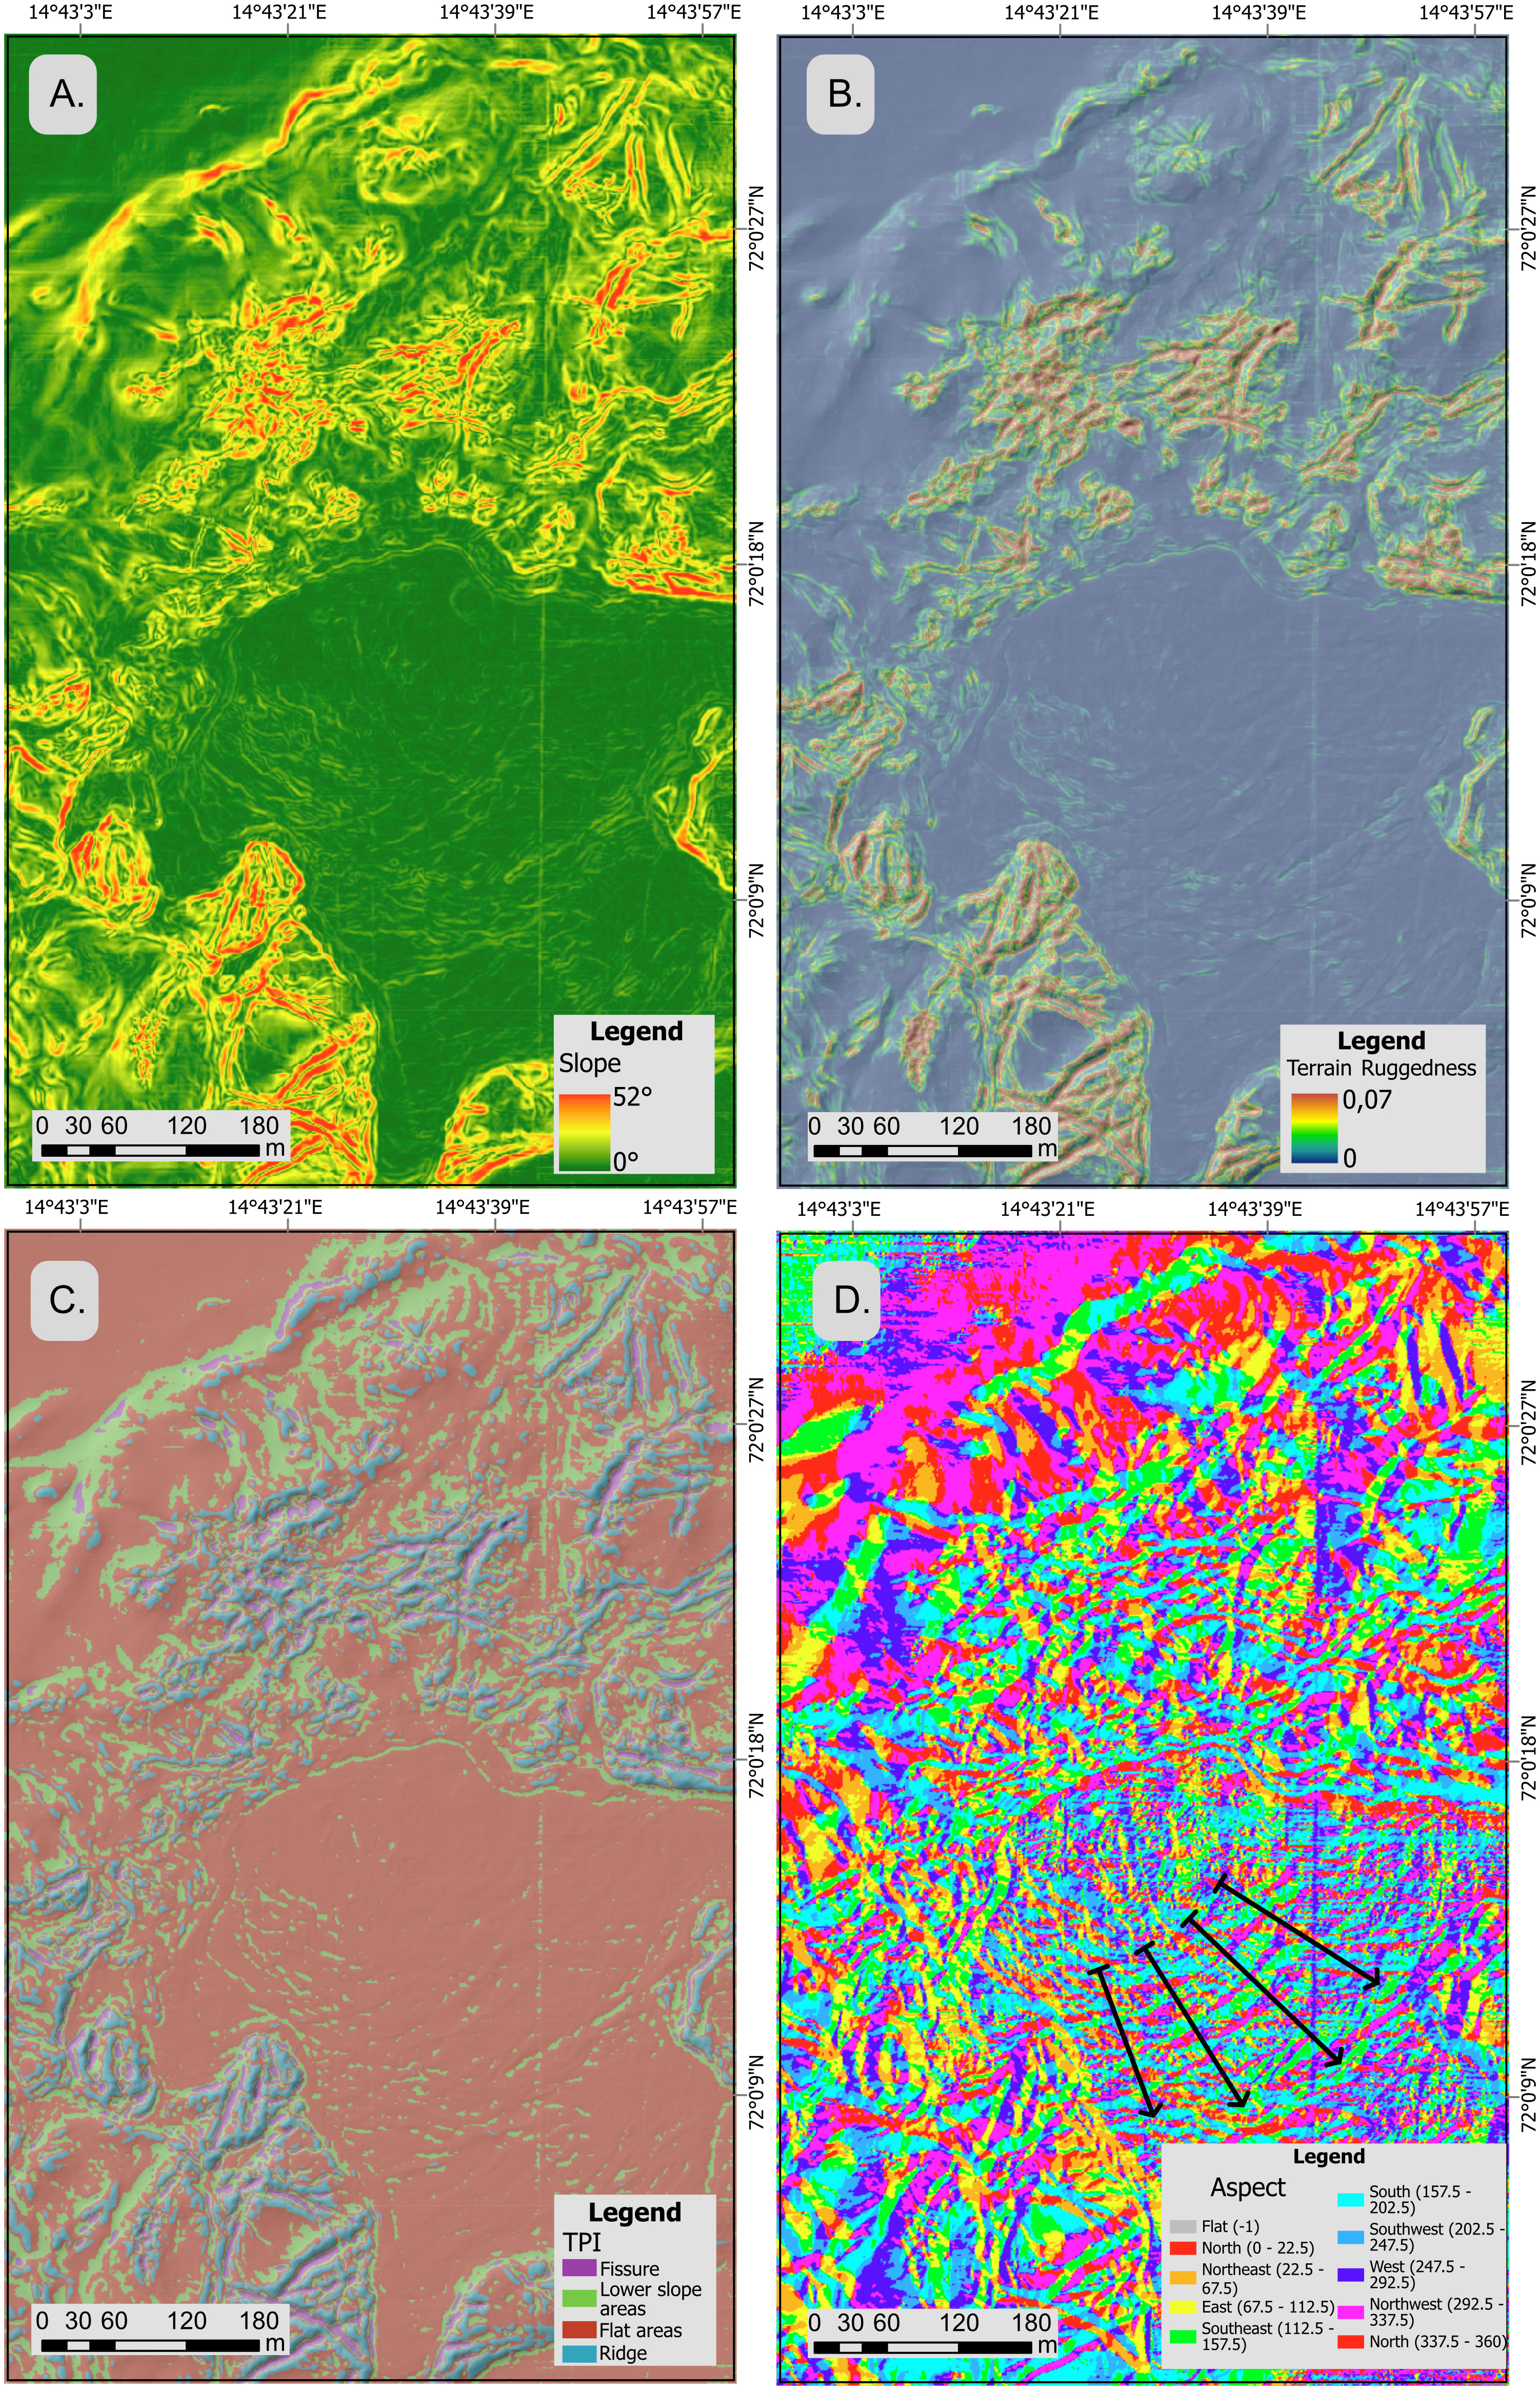
Figure 4 Morphometric analysis of HMMV ROV microbathymetry performed in ArcGIS Pro® 3.1. D. (A) Slope, (B) Terrain ruggedness, (C) Topographic Positing Index (TPI) and (D) Aspect maps. In the aspect map (D), the black arrows indicate the main direction of the of the principal mudflows.
The TPI (Figure 4C), allowed defining four landforms classes: fissure, lower slope areas, flat areas and ridges. Flat areas dominate the central crater, although the presence of small-scale, slightly arcuate seafloor undulations is more evident in the central and southern parts of this unit, as highlighted by slope and ruggedness. Moreover, the results obtained from the aspect analysis (Figure 4D), suggest the main direction of the principal mudflows along a Northwest-Southeast trend surface, as also documented by Jerosch et al. (2007) and Perez-Garcia et al. (2009).
The hummocky unit is marked by fissures and ridges that typify areas with high terrain complexity. However, based on the aspect map analysis, these landforms have no clear spatial pattern and seem randomly distributed. The northern section of the hummocky unit displays two distinct sub-units, with an uneven seafloor and a prominent network of fissures and ridges (Figure 5).
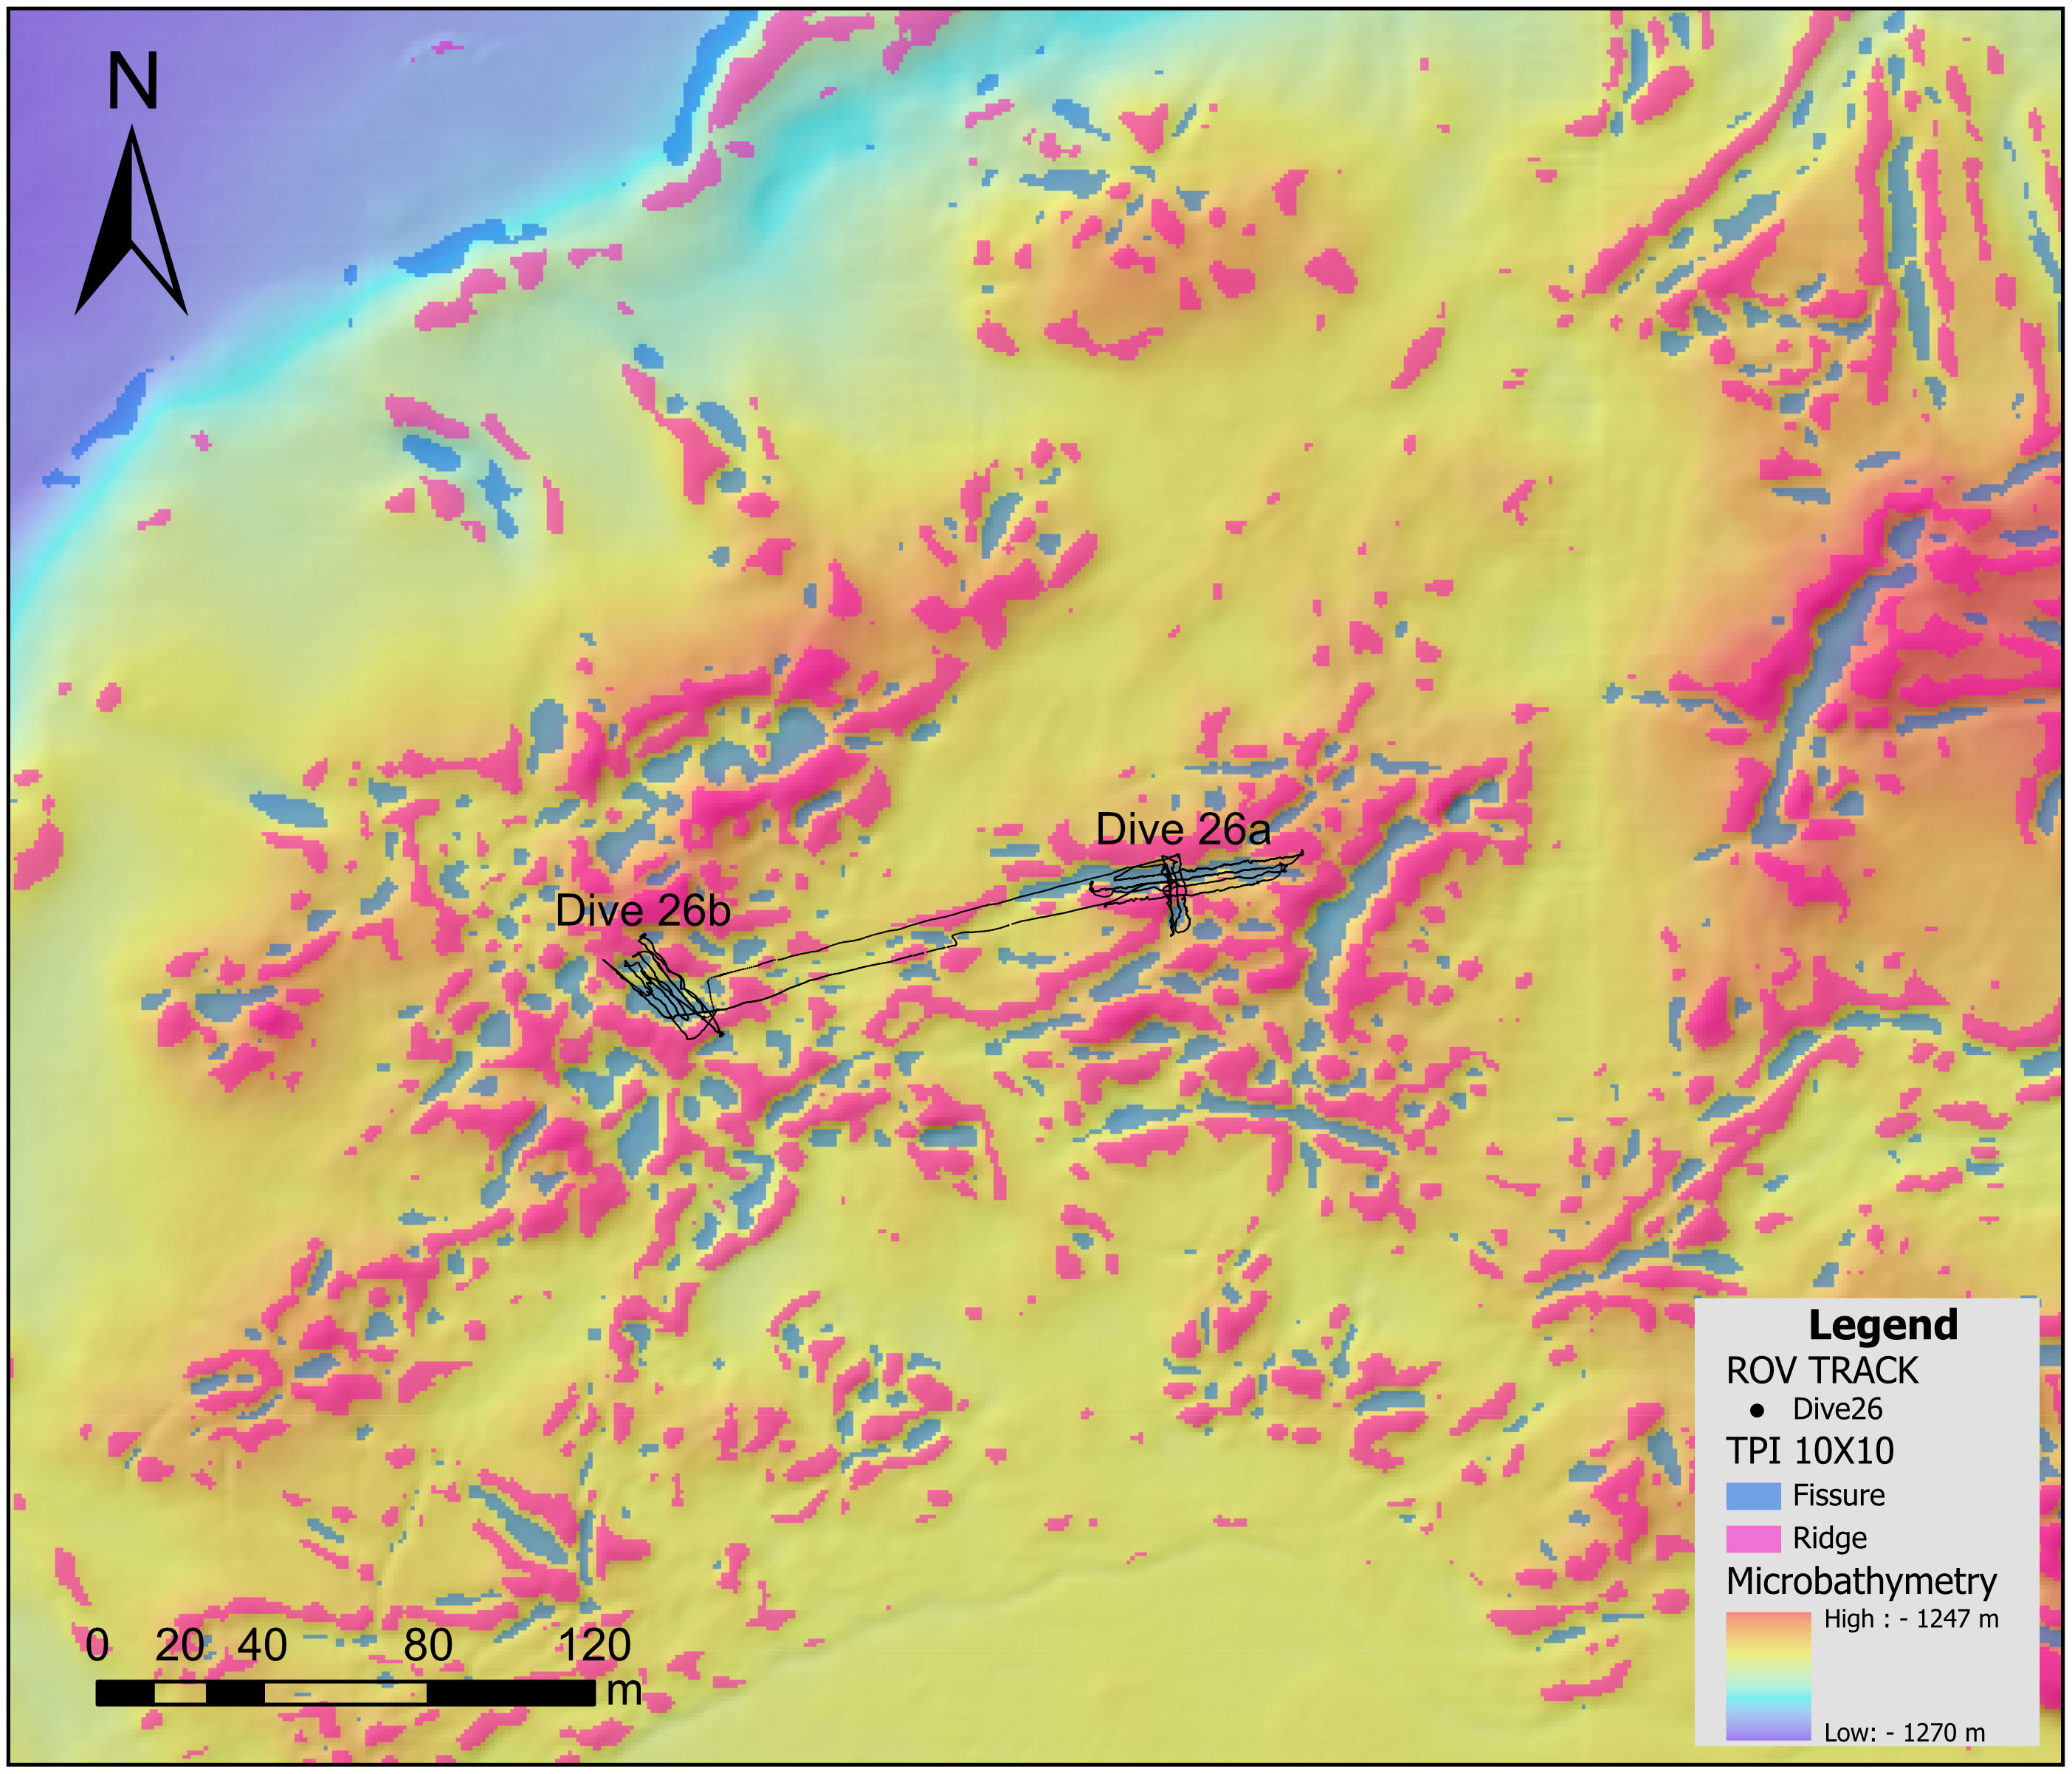
Figure 5 Topographic Positing Index (TPI) highlighting the Ridges and the Fissures, plotted on the hill-shaded model of the North part of the hummocky unit. On the model are plotted the ROV tracks of DIVE 26.
Ultra-high-resolution 2D and 3D models from SfM workflow
The SfM workflow on the ROV video frames created two ultra-high resolution seafloor models of 940 m2 at millimetric cell size (Tables 1, 2). The first, DIVE 26a, covered an area of 684 m2 with a resolution of 1.46 mm/pix for the orthomosaic and 2.92 mm/pix for the DEM (Figure 6). In contrast, the second, DIVE 26b, covered a slightly smaller area of 256 m2 but had a similar resolution of 1.33 and 2.63 mm/pix (Figure 7). The reconstructed models have a georeferencing error that falls within the estimated UBSL error of 1% of the ROV depth. Additionally, the scaling error within the models is 1.5 ± 0.7 mm, as calculated from the laser pointers. The georeferenced models are accurately aligned with the ROV microbathymetry and overlap seamlessly.
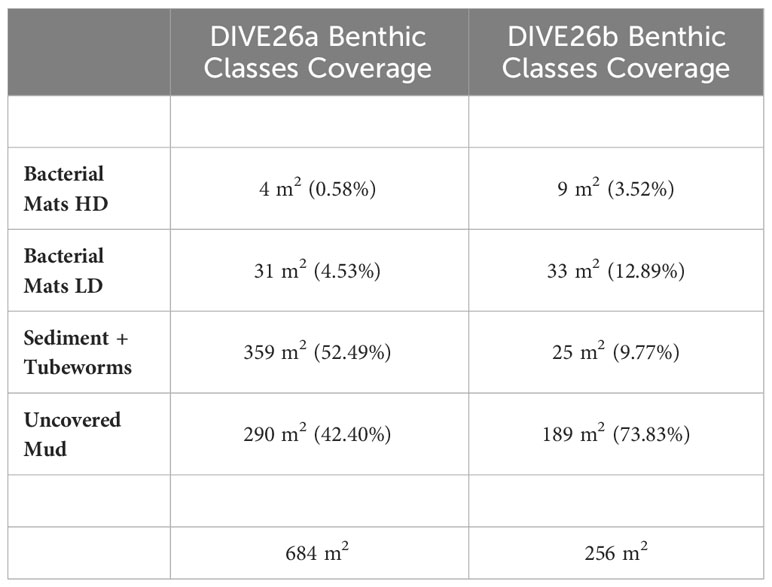
Table 2 Areal coverage of benthic classes for DIVE 26a and DIVE 26b derived from the OBIA classification.
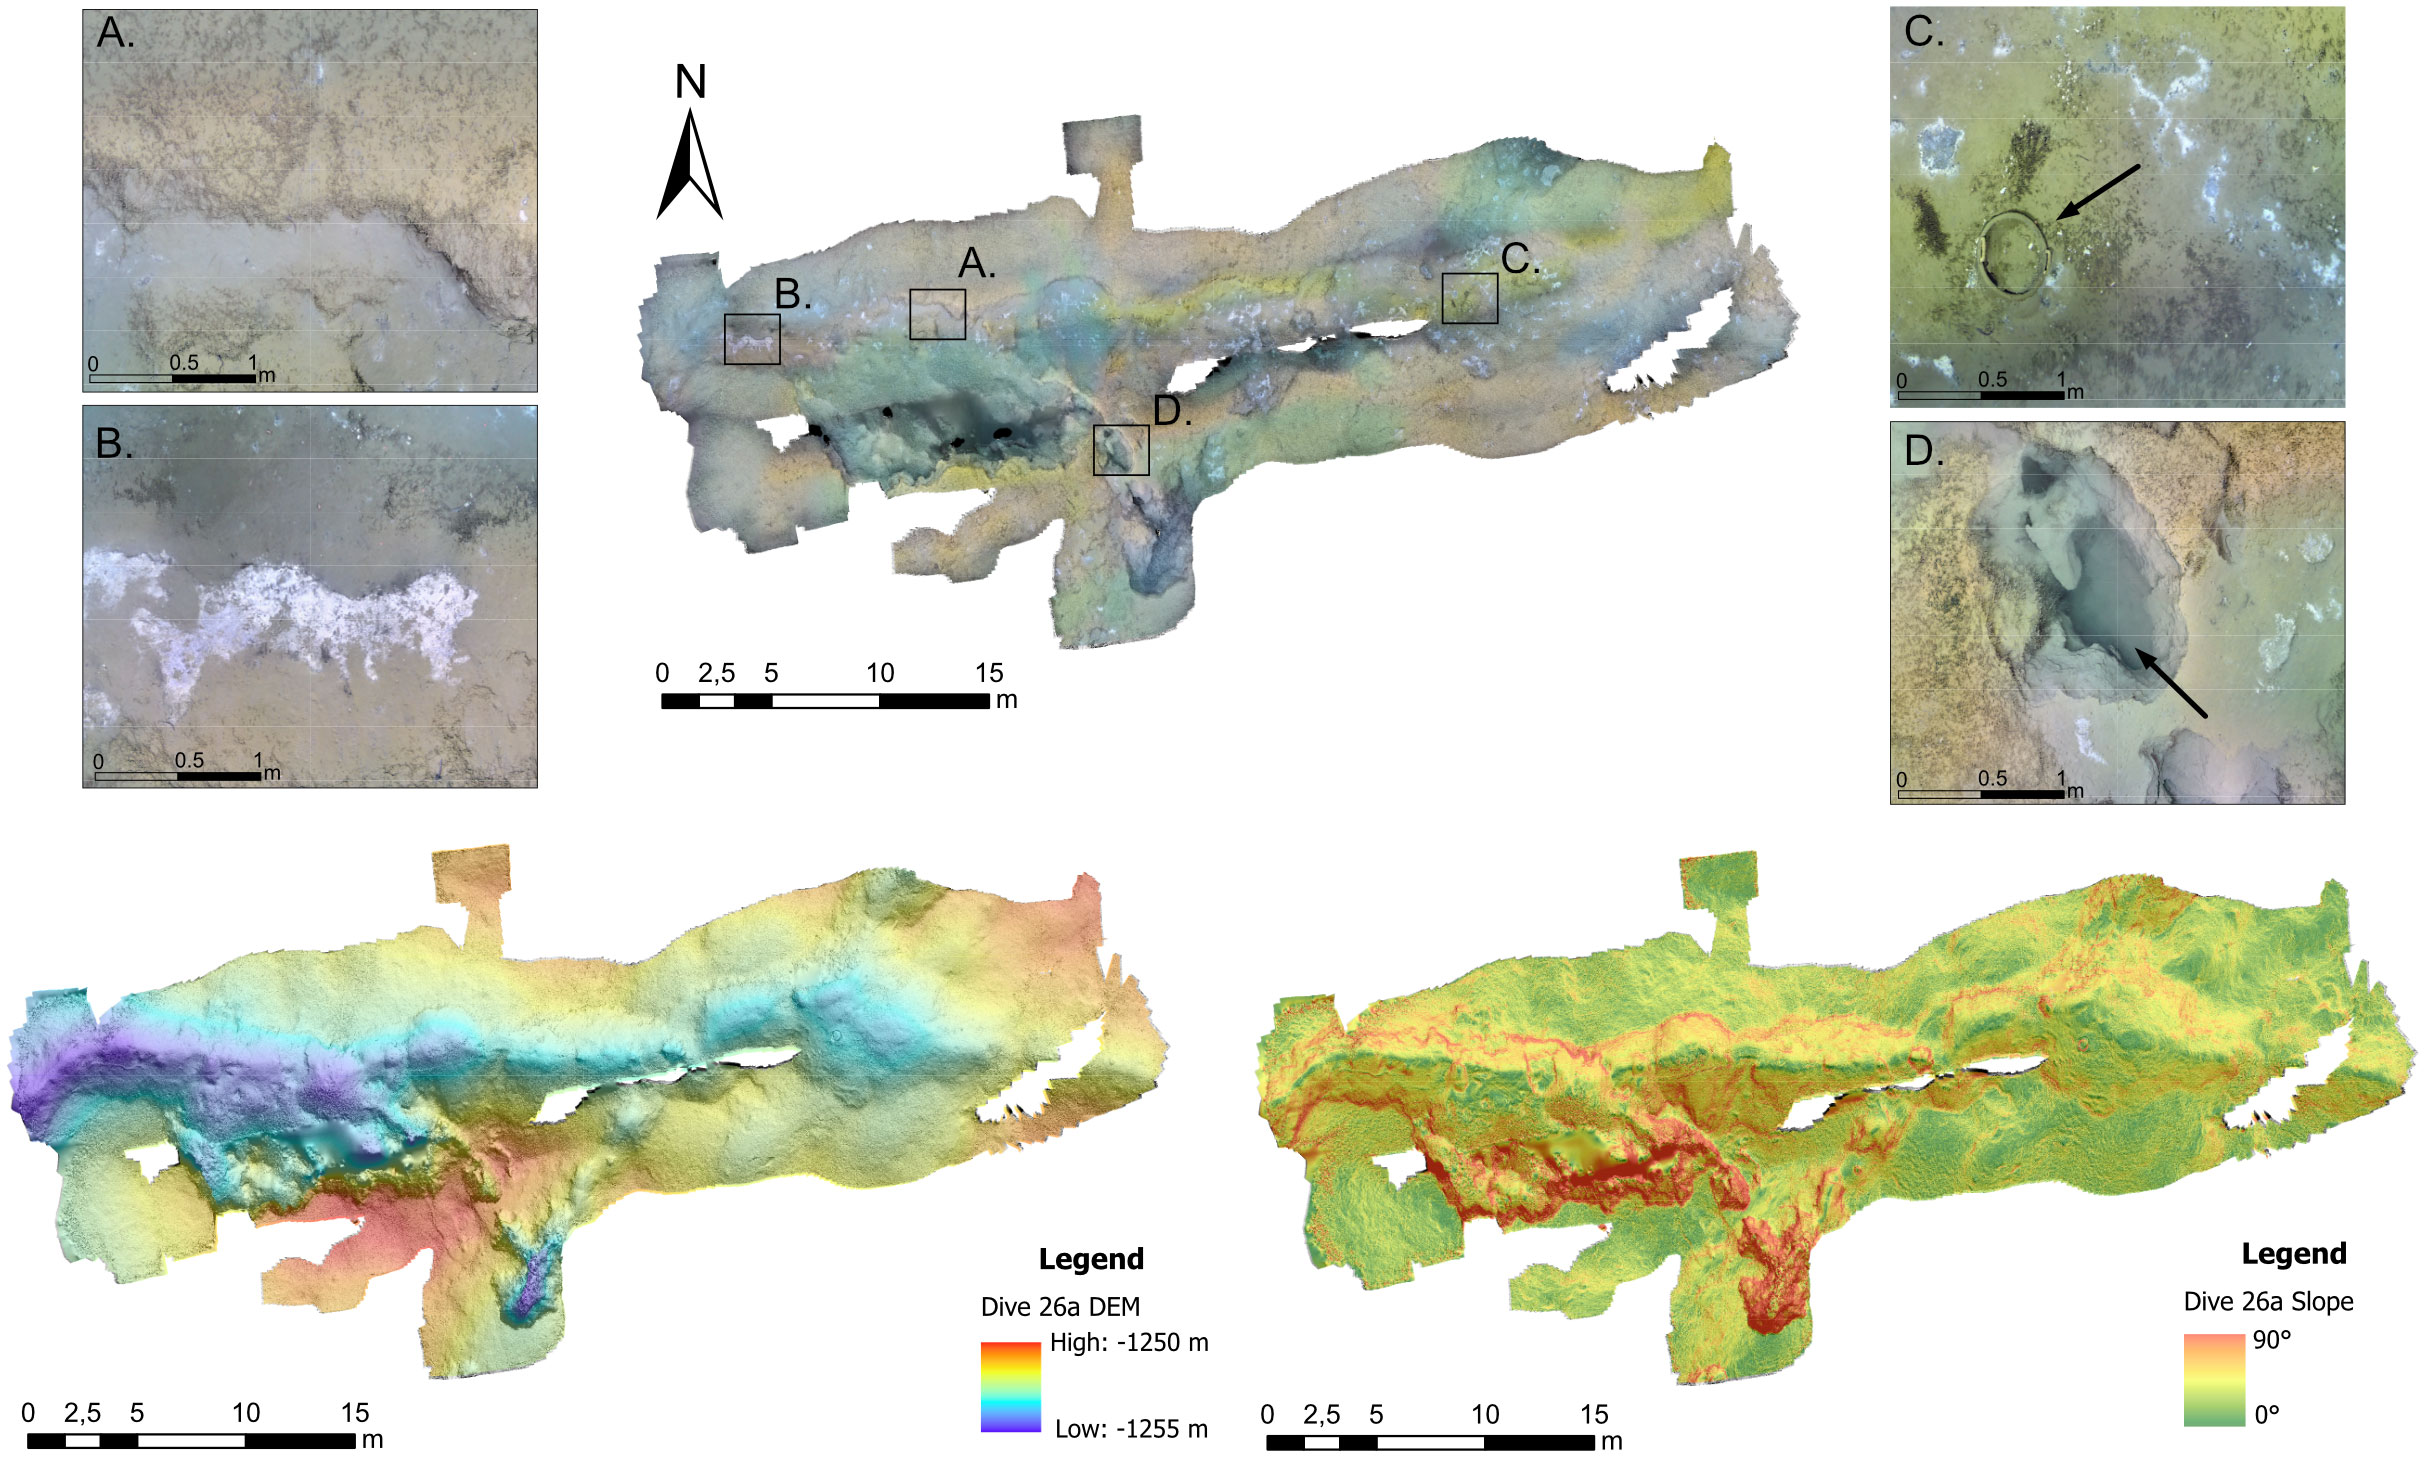
Figure 6 The DIVE 26a Orthomosaic, DEM, and Slope have been plotted on the hillshaded model. The zoom boxes highlight: (A) the edge of the ridge with tubeworms and fine sediment and the area with Uncovered Mud just below the abrupt step; (B) an area with a bacterial mat (High-Density) surrounded by Uncovered Mud; (C) the presence of anthropogenic debris (indicated by a black arrow); (D) a pit opened on the sea floor with uncovered mud (indicated by a black arrow).
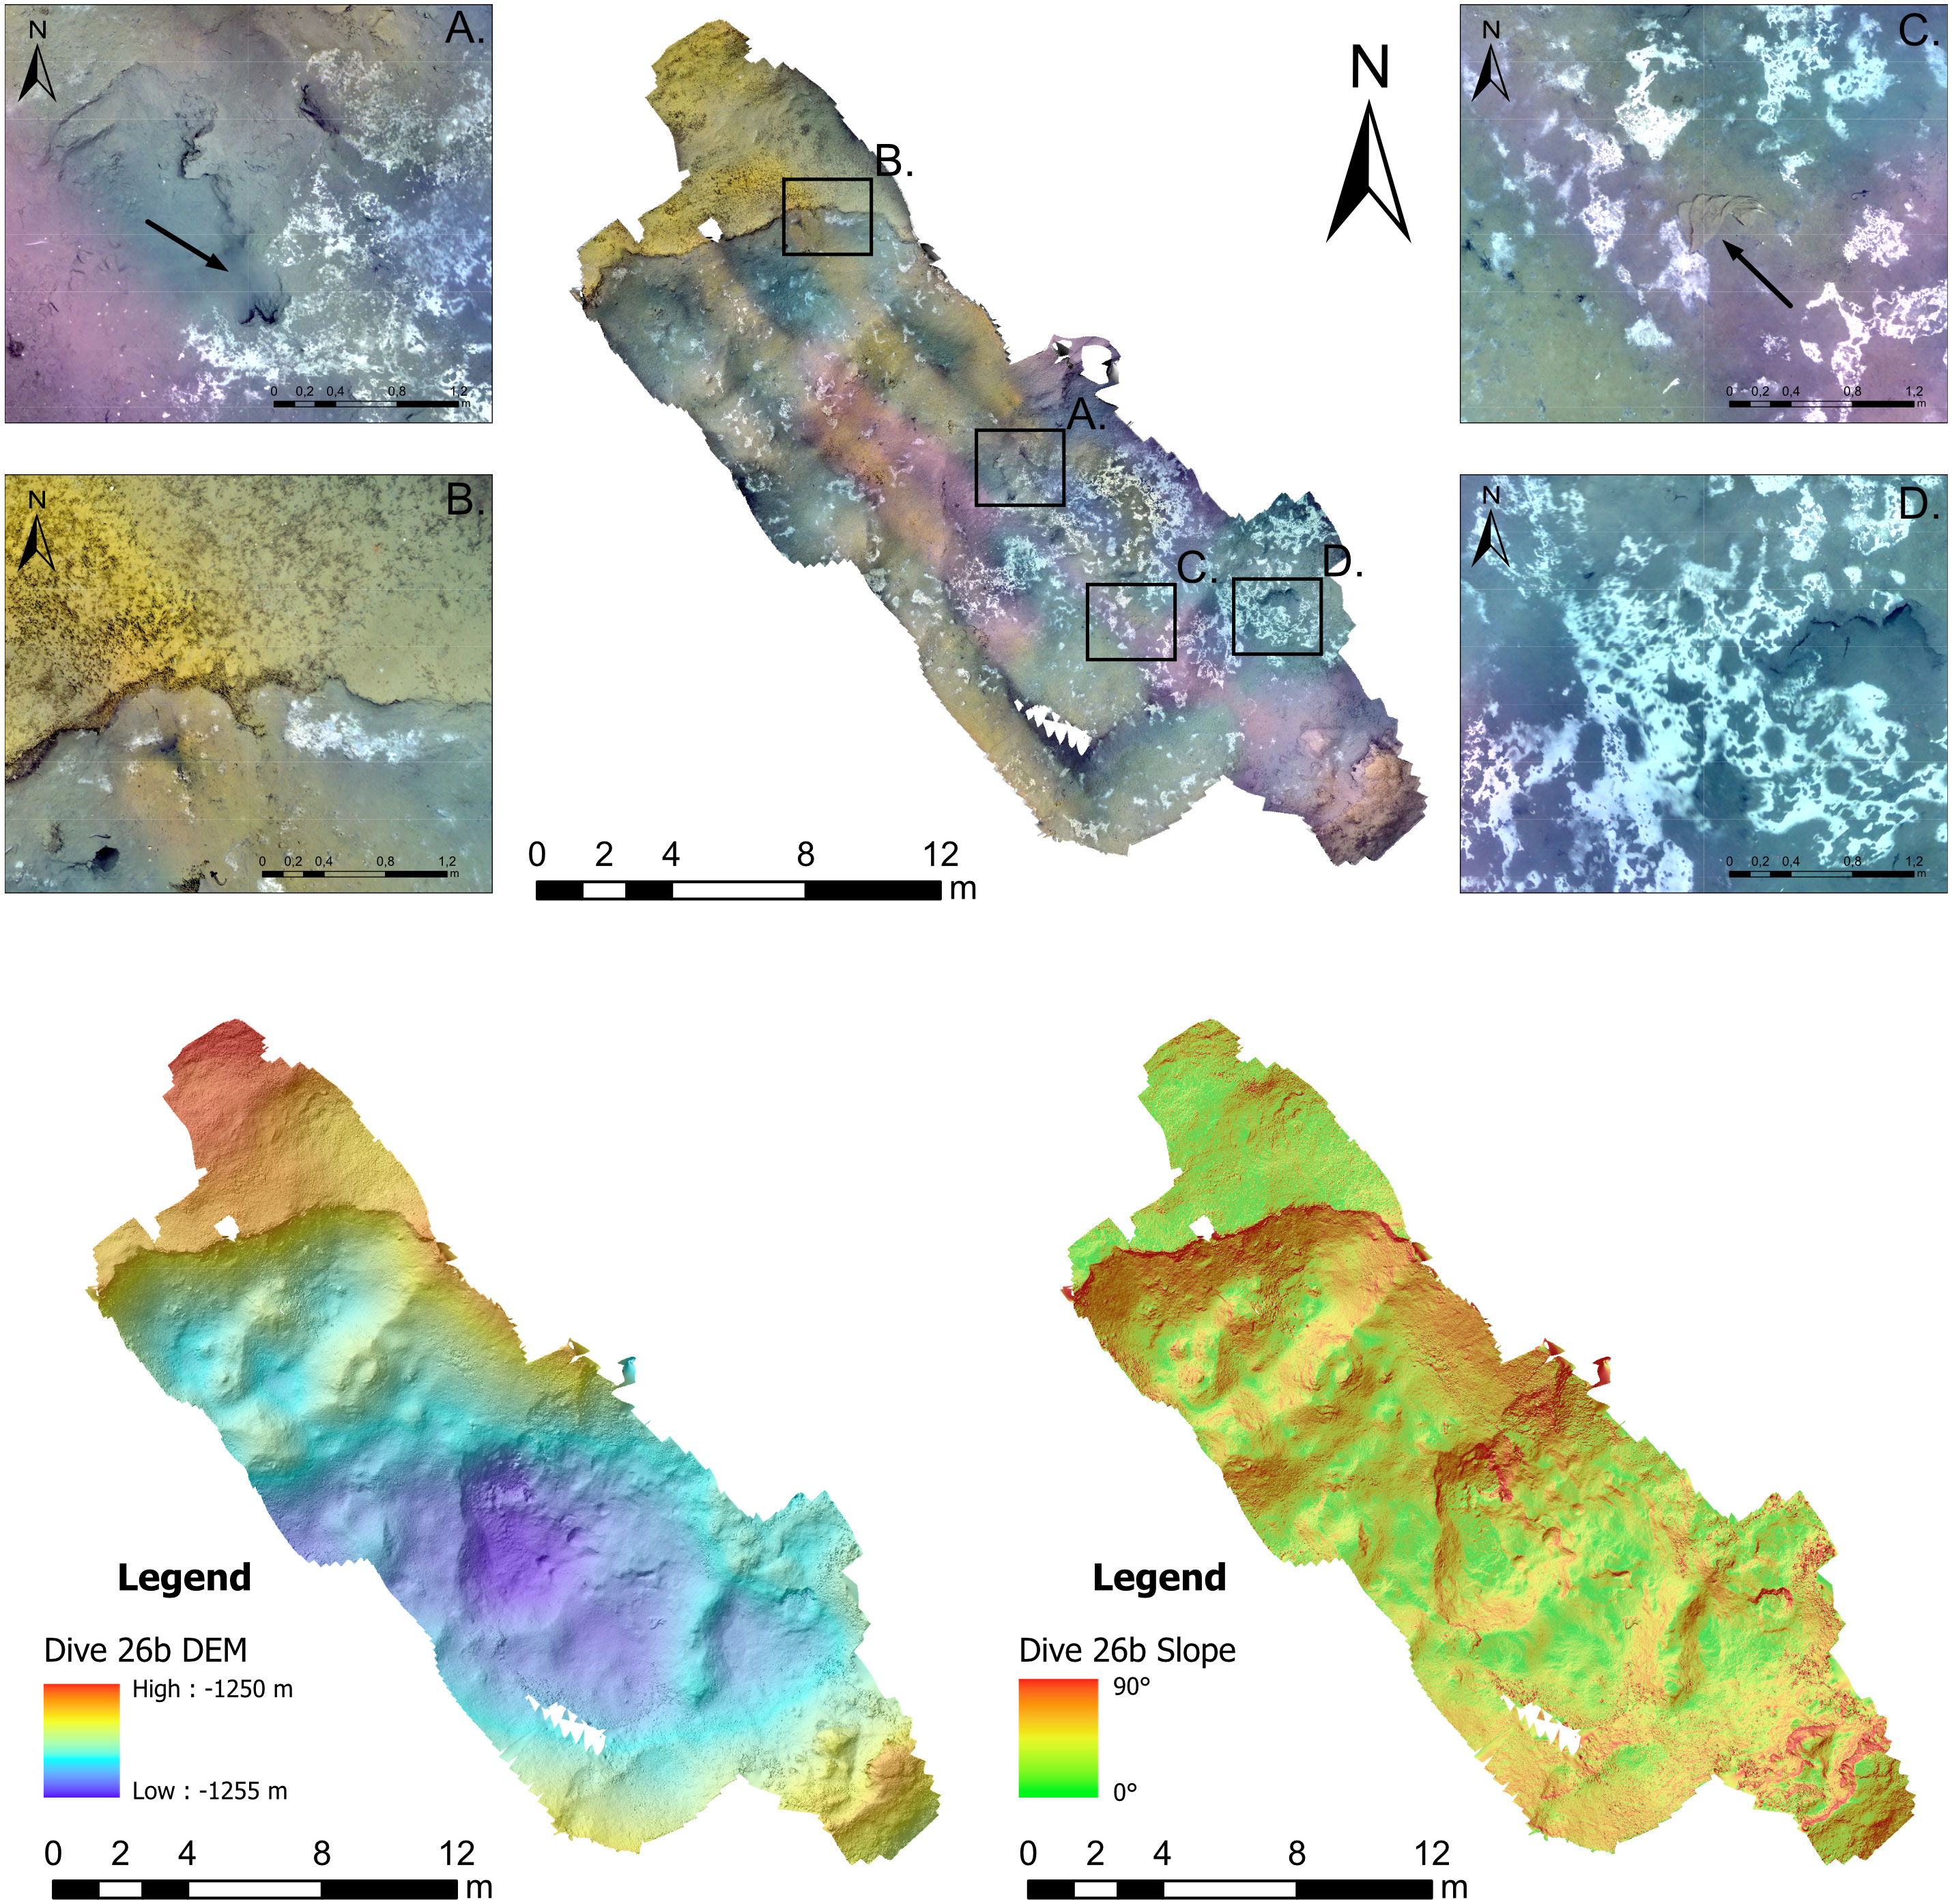
Figure 7 The DIVE 26b Orthomosaic, DEM, and slope plotted on the hillshaded model. The four zoomed boxes highlight: (A) Small cracks on the uncovered mud where continuous mud flow was recorded during the dive (indicated by a black arrow); (B) the edge of the depression marked with the change of slope and the tubeworms and fine sediments that dominate the upper part of the ridge; (C, D) are areas of the central part of the fissure dominated by Bacterial Mats coverage. In zoom box (C) is well visible an anthropogenic debris (burlap bag, indicated by a black arrow).
Dive 26a
Dive26a covered the hummocky unit along an elongated fissure (40 m length) and clearly showed peculiar landforms and chemosynthetic benthic communities thanks to the sub-centimetric resolution of the orthomosaic. As observed on the DEM and the slope analysis, a steepness greater than 70° is reached at some locations, where pits with uncovered sediments are evident (Figure 6D). The main chemosynthetic communities are the bacterial mats, which cover for 35 m2 the surface of the fissure (with variable density), and the pogonophora tubeworms, 542 m2, on the ridge summit. The ridge’s edge is clearly defined by a sudden shift in slope, which is noticeable in both the Slope model and the orthomosaic. Additionally, there is visible anthropogenic debris in the area (upper part of a bucket) (Figure 6C).
Dive 26b
Dive26b models focus on a smaller area that features a subcircular fissure and a marginal ridge. The section measures 25 m, and the DEM and slope models indicate a depression in the center that is surrounded by steep margins (> 70°). As observed on the orthomosaic, the center of the depression shows newly deposited mud and patches of bacterial mats with high coverage density, respectively 189 m2 and 42 m2. Additionally, a section of the seafloor with small fissures (Figure 7A) was detected during the dive, where a continuous mud flow was recorded. (Supplementary Video Material). Moreover, in this area, the ridge edges are well-defined in the slope, and the pogonophora tubeworms community dominates the submittal parts, covering 25 m2. Furthermore, there is man-made waste (probably a burlap bag) also present in this region (Figure 7C).
OBIA orthomosaics classification
eCognition’s OBIA workflow produced two classified maps depicting 940 m2 of hummocky unit seafloor communities (Figures 8, 9). The maps have similar overall accuracy rates of 87% (DIVE 26a) and 83% (DIVE 26b). However, the user accuracy for different classes ranges from 72% to 96%, as shown in Table 1S (Supplementary Materials).
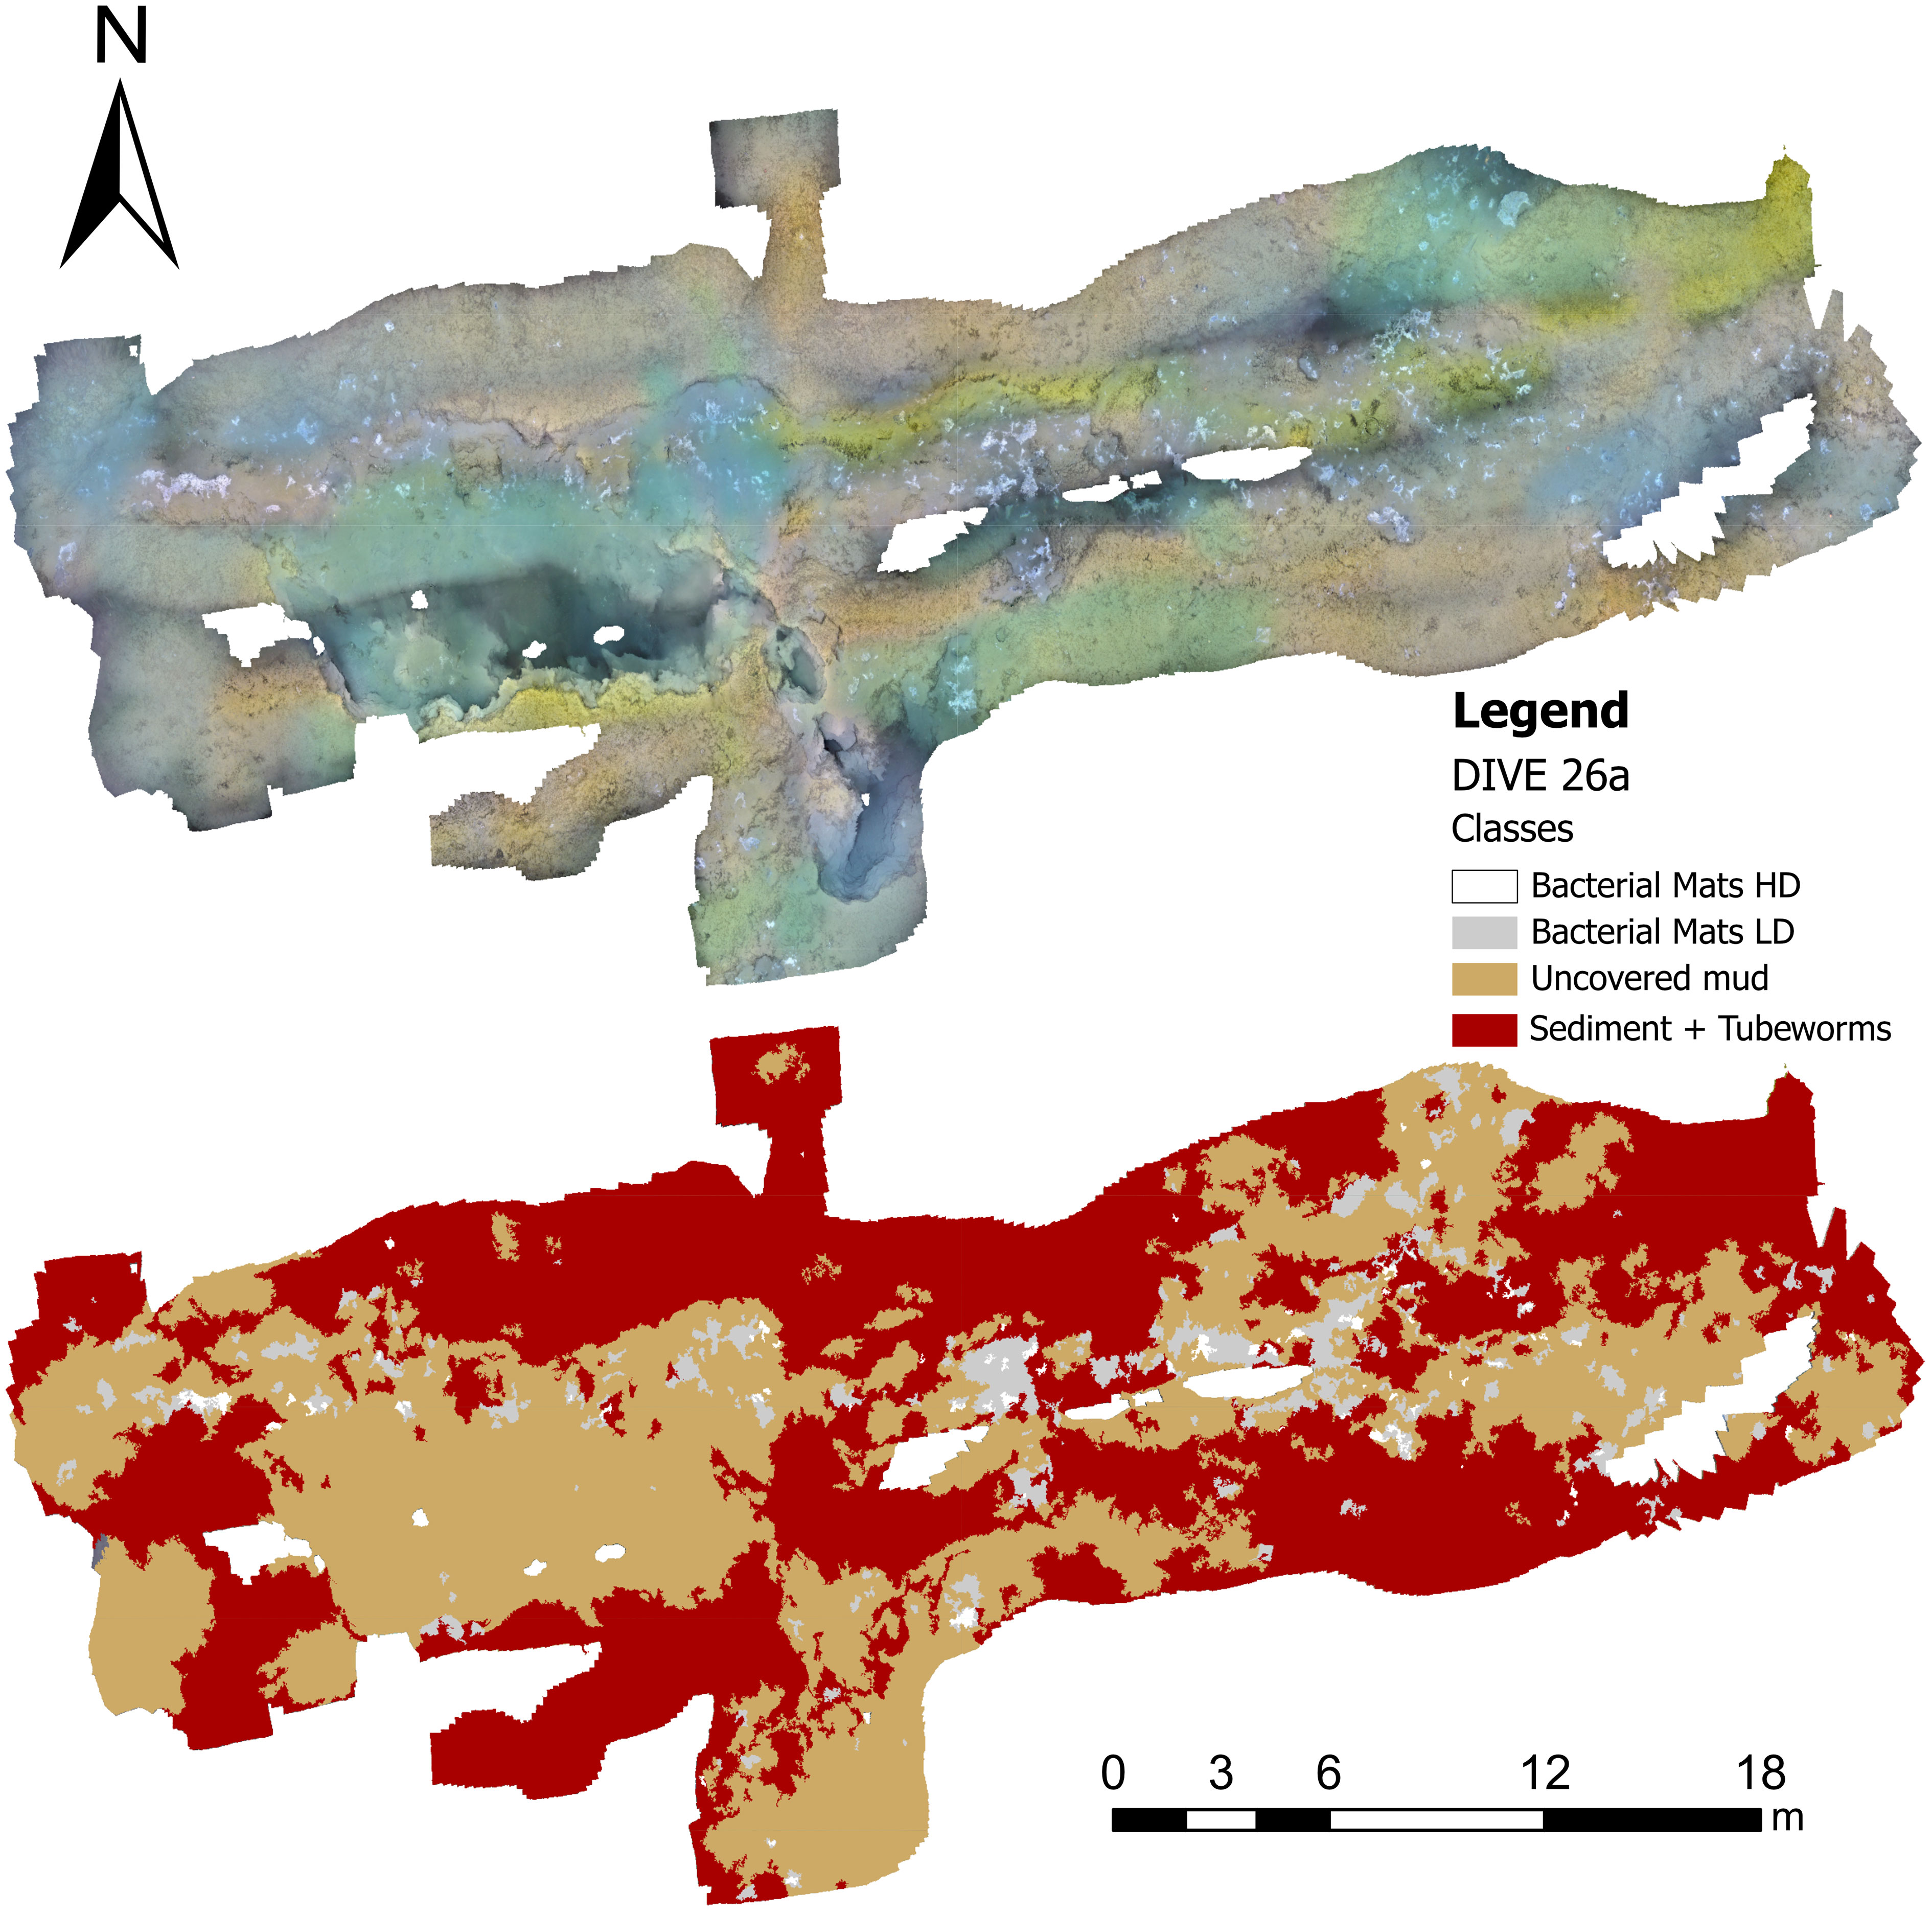
Figure 8 Classification of Dive 26a ultra-high resolution orthomosaic through OBIA and SVM classification.
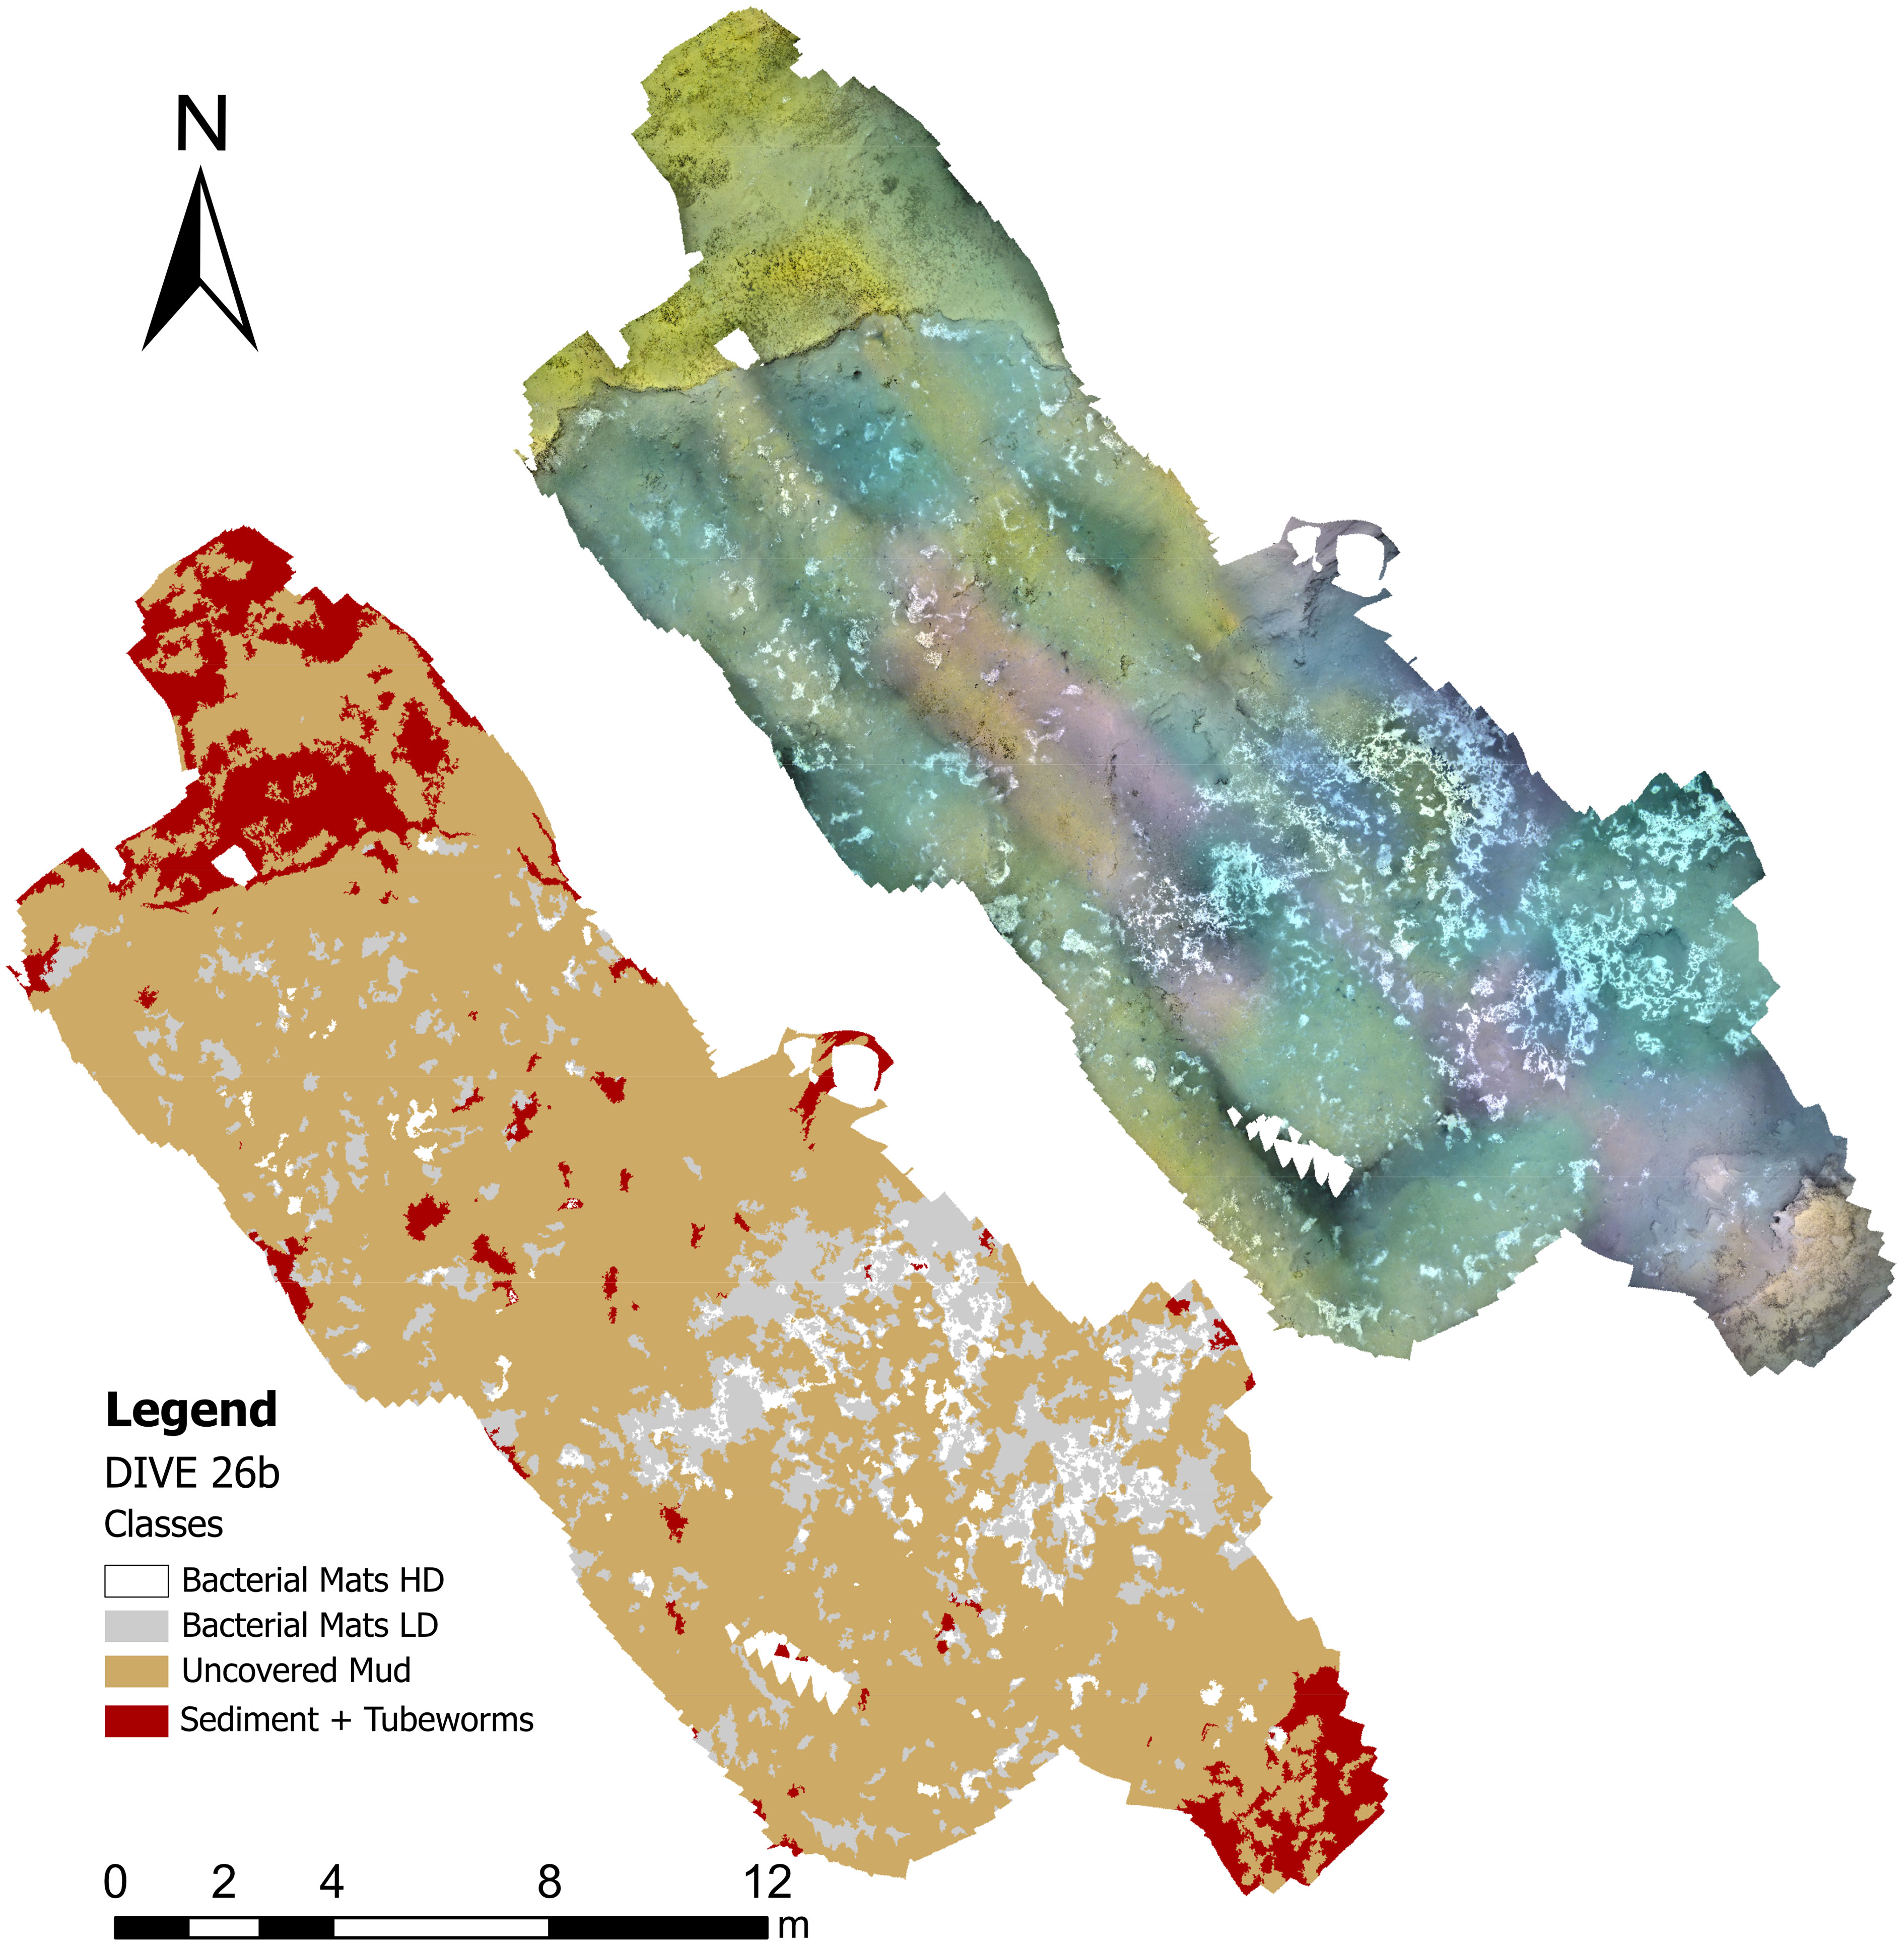
Figure 9 Classification of Dive 26b ultra-high resolution orthomosaic through OBIA and SVM classification.
Dive 26a map (Figure 8) shows a high coverage of pogonophora tubeworms d in fine sediments that create a “dense carpet” of organisms on the higher part of the area (ridge). Dense patches of bacterial mats cover the lower part of the area (fissure) developed on mud surface. There are more patches that are considered “low density” than “high density.” Fine sediments that are not covered by any macrofauna can be found near the pits, which are morphologies that create deep depressions on the eastern part of the model.
Dive 26b map (Figure 9) shows that the classes are distributed similarly to DIVE 26a. The upper part of the ridge is covered with tubeworms mixed with fine sediments, while the center of the fissure has only a few small patches. The depressed part of the map mainly consists of exposed uncovered sediment and bacterial mats. These mats are highly concentrated in the southeast area, near the point where mud flow is released (Figure 7A).
Discussion
Only in the last decade, the advancements in ocean robotic systems (e.g. ROVs), underwater cameras, and navigation/positioning systems made it possible to collect high-quality data in terms of resolution and accuracy in deep-sea environments. For example, Robert et al. (2017), integrated various mapping techniques and ocean technologies, including ROV and AUV MBES data as well as ROV photogrammetry, to map deep-sea vertical structures. Similarly, Conti et al. (2019), Price et al., (2019), Lim et al. (2020), and De Oliveira et al. (2022) utilized the combination of ROV microbathymetry and ROV SfM-derived models to investigate deep-water coral environments. These studies used DEMs and orthomosaics to extrapolate high-resolution terrain variables to investigate spatial patterns of vulnerable benthic habitats with a detail never achieved before in the deep-sea. In our research, we utilized a comparable method that involved combining a dataset made up of microbathymetric and photogrammetric models obtained through the use of a work-class ROV. The analysis of the ROV microbathymetry enabled us to determine an area with a high level of complexity within the hummocky region. Additionally, we were able to classify the landforms and the distribution of the chemosynthetic communities with the help of Sfm DEMs and orthomosaics.
HMMV landforms analysis
The ROV-based microbathymetry dataset (Figure 1) provided an accurate morpho-bathymetric map of the central sector of the HMMV. As emerged from the analysis of the slope and ruggedness maps, two main morphological units can be distinguished over the volcano’s central sector: the flat central crater, and the hummocky rim (Figure 10A). These units have already been described in previous studies by Gebruk et al. (2003) and Jerosch et al. (2007). An additional external unit, the moat, surrounds the two internal geomorphic units. However, it is still not clearly visible in our data as those are mainly focused on the central part of the HMMV (Figure 10A).
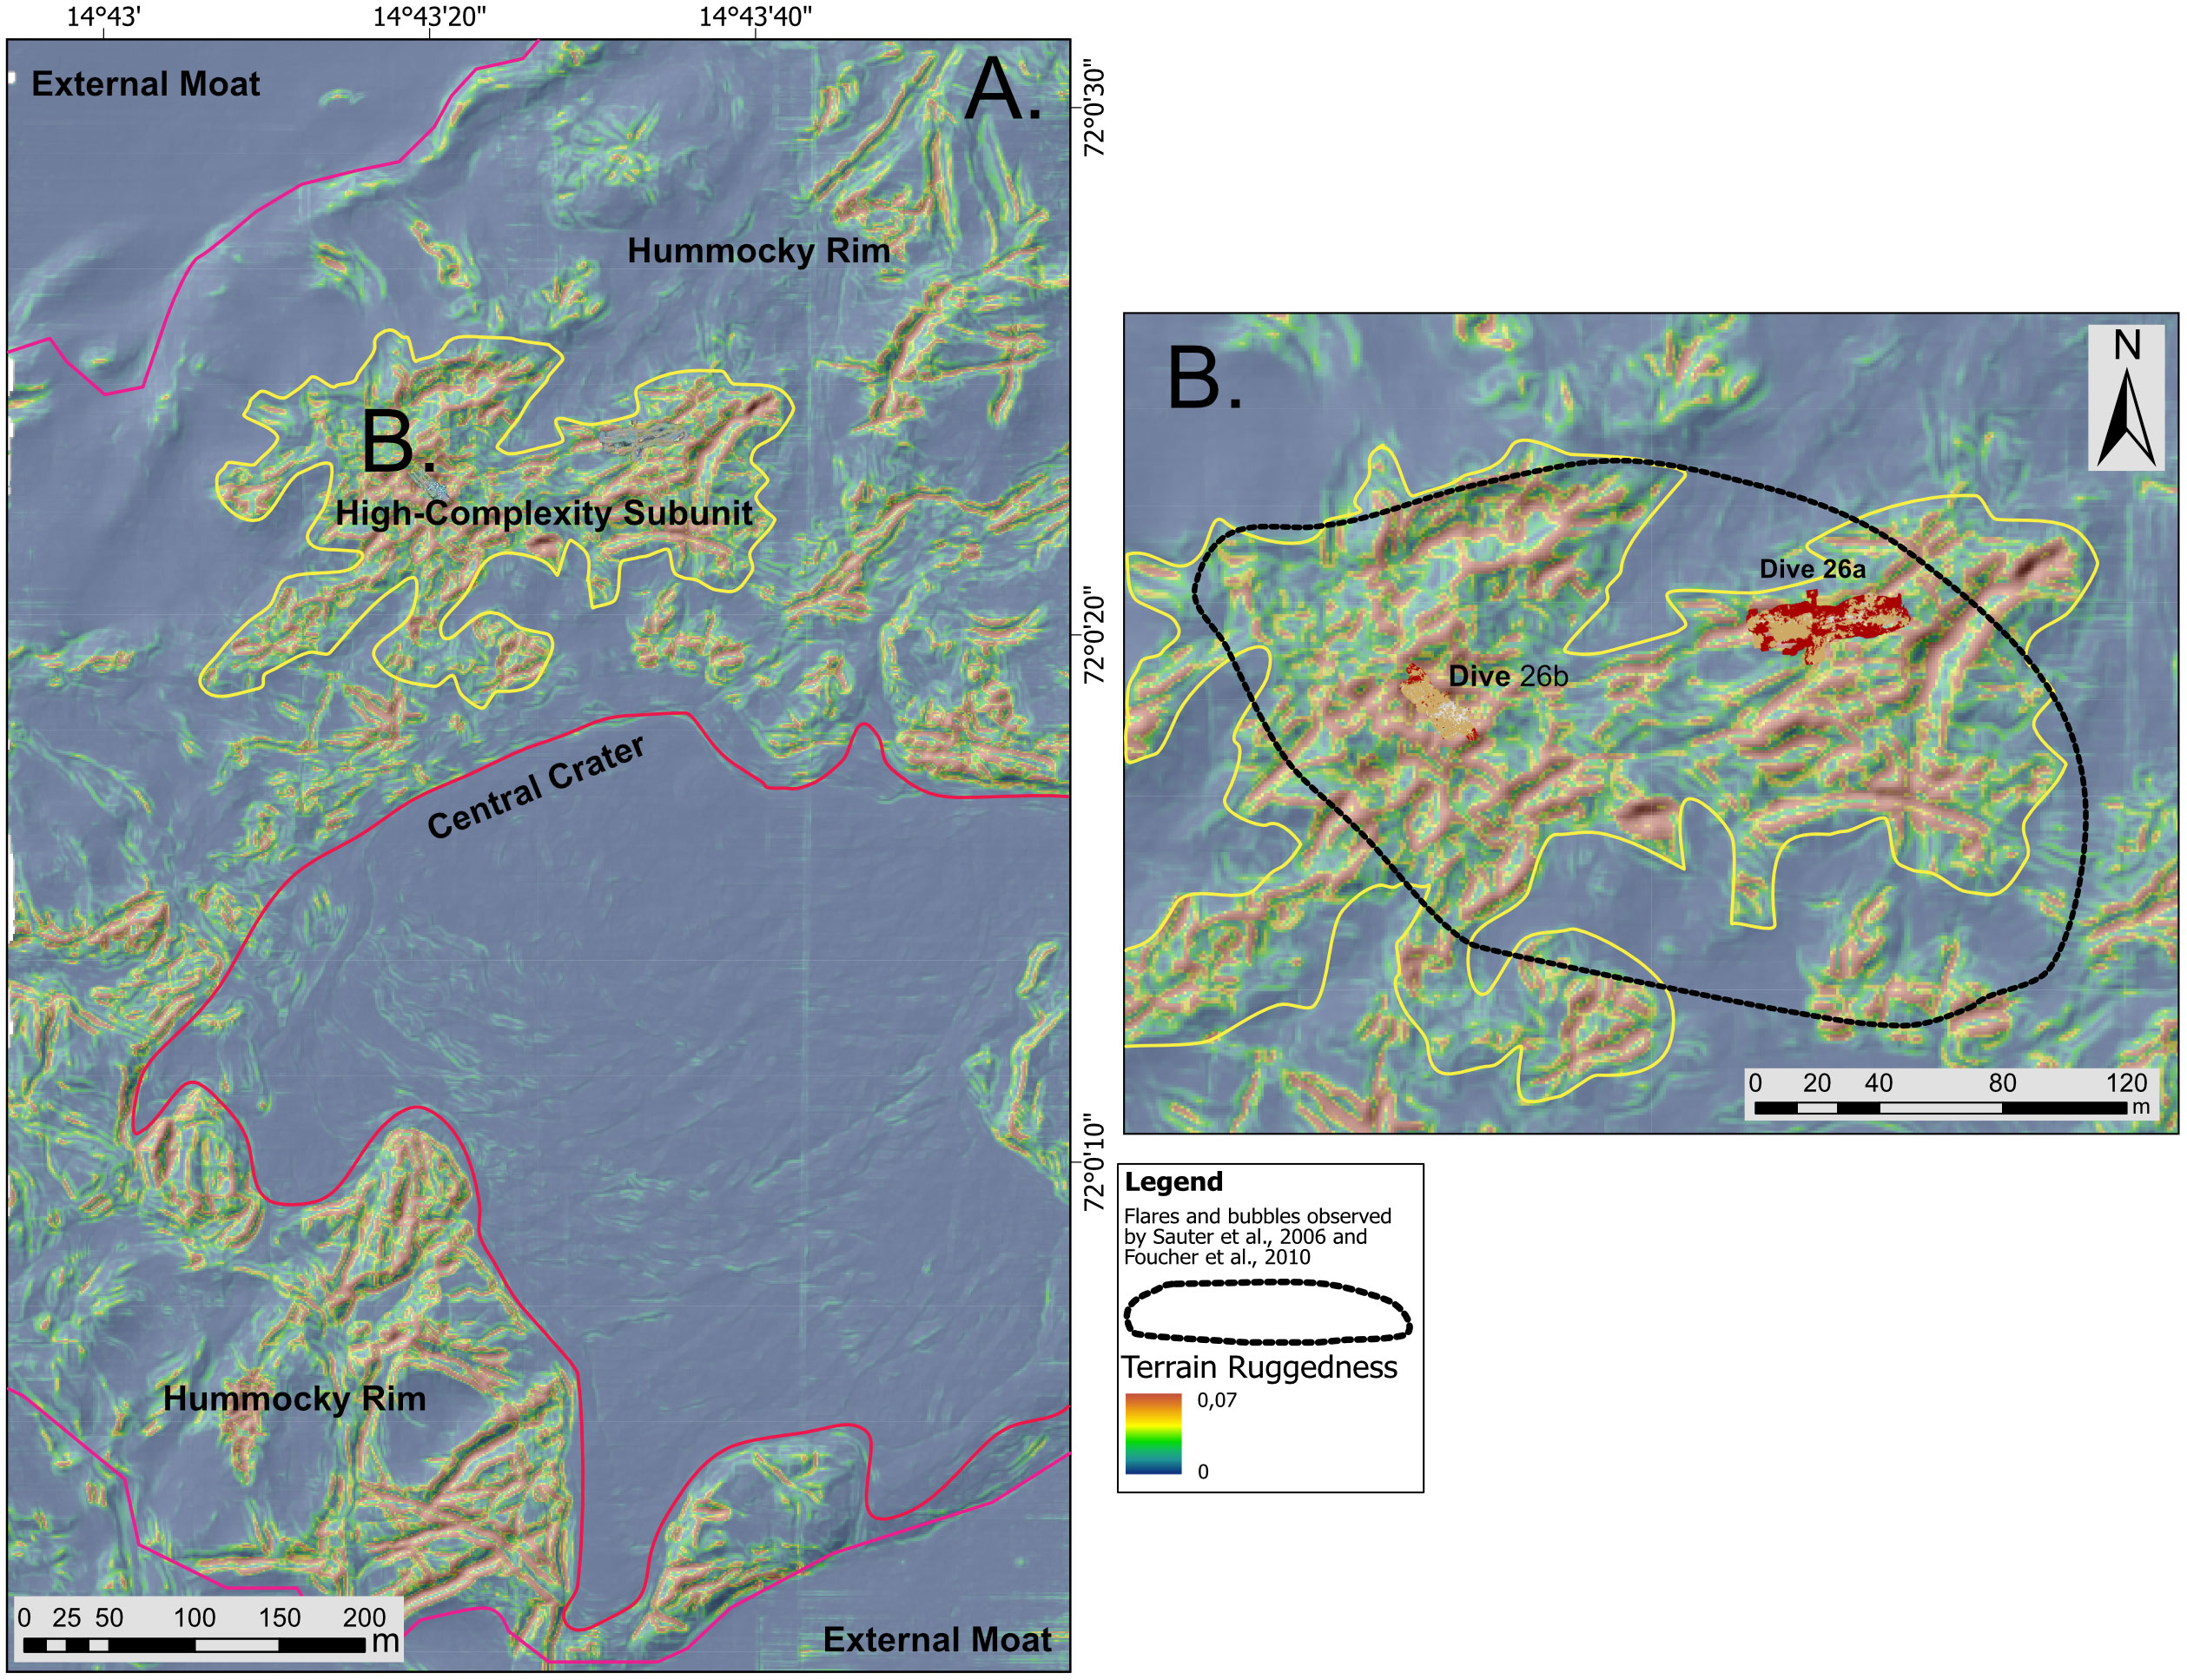
Figure 10 (A) Ruggedness map derived from ROV MBES microbathymerty. The three morphological units and the high-complexity subunit on the north part of the hummocky rim were highlighted on the map. (B) Zoom on the subunit characterized by a high level of ruggedness. Habitat maps of DIVE26a and DIVE26b fall within this area. The dotted line indicates the seafloor portion where most gas bubbles and acoustic flares were recorded in previous studies (Sauter et al., 2006; Foucher et al., 2010).
The ruggedness index reveals that some parts of the hummocky rim are more complex than others, with an intricate succession of ridges and fissures (Figure 4). Furthermore, the northern part of the hummocky unit is the area where most of the observations of large gas flares were detected in the water column through the years (Foucher et al., 2010). Gas bubbles were also observed in situ during previous expeditions, from the ROV videos, like at the so-called “Champagne” (Sauter et al., 2006) and the “Vickign” sites (Foucher et al., 2010). The sources of gas emissions have been located within the area covered by DIVE26a and DIVE26b (Foucher et al., 2010), indicating the intense gas seepage activity and mud extrusion of this subunit (Figure 10B). However, during the Ægir 6000 ROV exploration in 2021 (present study), no direct bubbles were observed. Instead, a continuous mud flow was recorded from small fissures in the area that was mapped during DIVE26b (Figure 7A); (Supplementary Video Materials). The compelling presence of numerous elements on the seafloor (fissures, bacterial mats and chemosynthetic fauna) highlight the frequent, but intermittent in time and space, seepage activity in this area. This was also well marked from the photogrammetric reconstruction of two of the fissures in the subunit (Figures 6, 7).
ROV photogrammetry on the hummocky subunit
Thanks to the ultra-high resolution ROV photogrammetry, we were able to delve deeper into the eco-geomorphological patterns of the hummocky subunit, reaching levels of resolution and accuracy far beyond any previous studies on cold seep environments. In fact, the models derived from the dedicated photogrammetry during DIVE26 have a higher resolution with respect to the video mosaics produced on HMMV by Jerosch et al. (2007) and the photo-mosaics by Marcon et al. (2013; 2014). Moreover, the DEMs (Figures 6, 7) obtained through the SfMs workflow make it possible to analyze the morphometric parameters of the monitored areas, unveiling more clearly the seafloor complexity and its relationship with associated habitats.
Basic surface landform parameters (i.e. hillshade and slope) computed for DIVE 26a, highlight deep pits (edged by ∼90° steep slopes) that form small craters exposing uncovered mud (Figure 6D). The rim of these pits appears composed of fine sediments densely colonized by tubeworms. The craters were likely created by sporadic gas venting that occurred throughout cracks in the seabed, which deeply marked the seafloor complexity in the surveyed subunits of the hummocky area (Foucher et al., 2010). The remaining part of the mapped area is an elongated steep fissure surrounded by sharped ridges; the fissure’s bottom is covered with mud colonized with bacterial mats, while at the top, the ridge is delimited by fine sediment and tubeworm communities. The spatial pattern associated with the detected chemoautotrophic communities (i.e. Beggiatoa mats and pogonophoran tubeworms) is also reflected in the DIVE 26b surveyed area (Figure 7). The occurrence of a dense layer of bacterial mats, covering the fissure’s bottom close to the minor fractures, with active fluid flow, confirms the seepage activity along fissures. On the contrary, the sharp transition marked by an abrupt slope change with the ridge summit, dominated by sediments and tubeworms (Figure 7B) confirms that tubeworms are commonly distributed where more stable conditions characterize the seafloor substrate in gas-charged deep-sea sediment and the seepage activity is not able to disrupt the seafloor.
The preferential allocation of the two communities, respectively on the upper part of the ridge and in the fissure, is related to the magnitude of methane fluxes in the sediment. In fact, the rates of anaerobic oxidation of methane control the availability of hydrogen sulfide used by Beggiatoa and pogonophorans (Boethius et al., 2000; Niemann et al., 2006; Argentino et al., 2022b). Beggiatoa mats are present in major abundance where the methane flux is high and AOM (Anaerobic Oxidation of Methane) occurs near the seafloor, while the pogonophorans, which can achieve sulfide from the deeper sediment layers, indicate a lower methane flux and deeper sediment interval hosting AOM (Jerosch et al., 2007; Åström et al., 2020). The location of these two communities can help determine methane seepage’s intensity. The Beggiatoa mats are often found in mud areas. At the same time, pogonophorans tubeworms tend to thrive in areas with lower (or deeper) levels of methane and hydrogen sulfide, as the upper ridge, indicated a clear spatial succession (Jerosch et al., 2007; Argentino et al., 2021; Argentino et al., 2022a). This succession emerges clearly by analyzing the SfM models obtained from DIVE26a and DIVE26b, especially when combining the terrain features with a visual examination of the seafloor. In fact, the millimetric resolution of the orthomosaic helped us to identify the spatial distribution of communities present in the area and to map them in detail through the OBIA workflow. Moreover, the orthomosaic’s resolution allowed the detection of abundant macrofauna, primarily Zoarcidae benthic fishes, in the mapped seafloor areas (SM Figure 11). These findings highlight the potential of ROV photogrammetry in studying the benthic macrofauna of cold seep environments, which are known as biodiversity hotspots in the ocean (Rybakova Goroslavskaya et al., 2013; Levin et al., 2015; Åström et al., 2018). Thanks to the georeferencing of the models and their high spatial accuracy, it could be possible to perform reliable measurements of the organisms, quantification of individual abundance, and analysis of their relationship with the surrounding environment.
OBIA seafloor classification
The OBIA classification provided accurate maps of the distribution of major benthic classes in DIVE26a and DIVE26b. The use of multiresolution segmentation and supervised classification sped up the classification process, minimizing the operator bias that can result from manual on-screen editing. In addition, the parameters established in the eCognition® decision tree can be used to classify orthomosaics of cold seeps obtained under comparable conditions.
In DIVE26a, Bacterial mats distributed sporadically over the lower parts of the fissure. It seems that colonization began in the eastern portion of the map, where small bacterial patches have been observed in the mud zone. Instead, the DIVE 26b map shows in the southern part, numerous patches of high and low-density Bacterial mats form a nearly continuous layer. This distribution may suggest the presence of high levels of methane in the upper part of the seabed, as evidenced by the active fluid flow recorded from seabed cracks. Moreover, the density of these patches can increase through time following the increment of the seepage activity, as described by Girard et al. (2020) in a long-term monitoring study (LOOME) conducted on a section of HMMV close to the regions mapped in DIVE 26. Scattered patches are present on the remaining fissure area, alternating with uncovered mud. In line with DIVE 26a, the tubeworms class was found to be prevalent in the upper section of the ridge. This redundant distribution of the substrate classes reinforces the clear link between the availability of methane near the sediment surface and the allocation of the two main chemosynthetic communities.
ROV photogrammetry constraints
When using the ROV photogrammetry approach, it is important to consider its limitations. Firstly, proper infrastructure is needed to collect reliable and high-quality data. This involves acquiring data from a R/V and with a work-class ROV. To achieve this, the ROV must be equipped with a high-definition camera that is oriented with the lens parallel to the seafloor, and powerful lights that can uniformly illuminate the camera’s focal view. Additionally, the positioning system must be highly accurate while the pilots must be skilled enough to maintain the ROV’s stability on the defined lines and at the same altitude from the bottom. Any lateral or vertical movements can cause a non-uniform illumination, which may reduce the probability of the alignment of the frames during the SfM workflow (Price et al., 2019). These challenges can be more difficult in areas with complex seafloors, such as the site mapped in this study. Consequently, to ensure the side overlap between the six parallel lines acquired in DIVE 26a, three extra transects had to be added, transversal to the main direction of the ROV.
There is another factor that should be taken into account: the amount of time required for data acquisition. In our research, it took approximately 2 hours of ROV video footage to map an area of 940 m2 (Lim et al., 2020). Additionally, conducting other scientific tasks, such as collecting sediment samples or acquiring MBES data, during photogrammetry can be impossible due to the presence of the dedicated sledge with the camera and the lights. Furthermore, the time required to bring the ROV back to the RV deck to adjust settings can further prolong the operation time.
Conclusion
Our study represents an advancement in understanding the geomorphology and ecological aspects of the Håkon Mosby Mud Volcano (HMMV) and its cold seep environments. Combining data from ROV microbathymetry and SfM photogrammetry, we obtained high-resolution information previously unattainable with traditional acoustic remote sensing methods. The integration of multi-sources and multi-resolution data allowed us to generate scaled and georeferenced bi- and three-dimensional (2D, 3D) models, providing detailed insights into the underwater features and cold seep habitats associated with the HMMV. Moreover, the application of ROV photogrammetry proved to be a powerful tool in deep-sea imaging research, enabling us to analyze the seafloor terrain with great precision.
The obtained ultra-high resolution SfM models facilitated a comprehensive analysis of the cold seep benthic communities, shedding light on their composition and spatial distribution with unprecedented detail. Using OBIA and SVM classification, we were able to accurately map the distribution of the primary chemoautotrophic habitats on 940 m2 of the high complexity hummocky rim. Four prominent substrate types were distinctly imaged in these regions: uncovered mud, bacterial mats high-density, bacterial mats low-density, sediments and tubeworms. This process helped to clarify their relationship with the terrain morphology and seepage activity, providing valuable knowledge for understanding the ecological functioning of cold seep ecosystems in MVs. Furthermore, our SfM models have exceptional spatial and geographical accuracy, making them a useful starting point for long-term studies. In fact, by monitoring the same area over time following the herein-defined workflow, our models can track changes in seafloor morphology and benthic habitat dynamics, providing a reliable baseline for research.
Data availability statement
The data presented in the study are deposited and available in the DATAVERSE.NO data repository at https://doi.org/10.18710/C1R1IN.
Author contributions
LF: Conceptualization, Investigation, Methodology, Writing – original draft, Writing – review & editing. GP: Funding acquisition, Resources, Supervision, Writing – review & editing. AS: Investigation, Methodology, Supervision, Writing – review & editing. AV: Writing – review & editing, Data curation, Methodology. CA: Writing – review & editing, Investigation. SB: Writing – review & editing, Funding acquisition, Resources.
Funding
The author(s) declare financial support was received for the research, authorship, and/or publication of this article. The Norwegian Research Council supported our research through project AKMA, Advancing Knowledge of Methane in the Arctic (project number 287869) and the Centre for Arctic Gas Hydrate, Environment and Climate (project number 223259). The research was also supported by the Marine Cartography Lab (BluGLab) of the Dept. of Earth and Environmental Sciences (DISAT), University of Milano-Bicocca, which provided lab facilities and software licences for data processing and analysis. The research project 2021-RTDAPON-149 (RTDa PON ‘ricerca e innovazione’ 2014–2020) funded LF's work.
Acknowledgments
We would like to thank the crew and scientific parties of AKMA-CAGE 21-1 cruise of R/V Kronprins Håkon as well as the engineers and technicians of the ROV Ægir6000.
Conflict of interest
The authors declare that the research was conducted in the absence of any commercial or financial relationships that could be construed as a potential conflict of interest.
The author(s) declared that they were an editorial board member of Frontiers, at the time of submission. This had no impact on the peer review process and the final decision.
Publisher’s note
All claims expressed in this article are solely those of the authors and do not necessarily represent those of their affiliated organizations, or those of the publisher, the editors and the reviewers. Any product that may be evaluated in this article, or claim that may be made by its manufacturer, is not guaranteed or endorsed by the publisher.
Supplementary material
The Supplementary Material for this article can be found online at: https://www.frontiersin.org/articles/10.3389/fmars.2023.1269197/full#supplementary-material
Supplementary Figure 1 | Benthic macrofauna identified in the orthomosaics. (A) Amblyraja hyperborean, a ray commonly found in cold seep environments, lay on a substrate of fine sediments and tubeworms. (B) Several fishes of the species Lycodes squamiventer (Family Zoarcidae) lay on the uncovered mud scattered with bacterial mats.
References
Agisoft (2018) Agisoft PhotoScan User Manual. Professional Edition, Version 1.4. Available at: http://www.agisoft.com/downloads/user-manuals/.
Aloisi G., Bouloubassi I., Heijs S., Pancost R. D., Pierre C., Sinninghe Damsteé J. S., et al. (2002). CH4-consuming microorganisms and the formation of carbonate crusts at cold seeps. Earth Planetary Sci. Lett. 203 (1), 195–203. doi: 10.1016/S0012-821X(02)00878-6
Andreassen K., Hubbard A., Winsborrow M., Patton H., Vadakkepuliyambatta S., Plaza-Faverola A., et al. (2017). Massive blow-out craters formed by hydrate-controlled methane expulsion from the Arctic seafloor. Science 356 (6341), 948–953. doi: 10.1126/science.aal4500
Argentino C., Lee A., Fallati L., Sahy D., Birgel D., Peckmann J., et al. (2022a). Biogeochemistry and timing of methane-derived carbonate formation at Leirdjupet fault complex, SW Barents sea. Front. Earth Sci. 10. doi: 10.3389/feart.2022.1029471
Argentino C., Savini A., Panieri G. (2022b). Integrating Fine-Scale Habitat Mapping and Pore Water Analysis in Cold Seep Research: A Case Study from the SW Barents Sea. World Atlas Submarine Gas Hydrates Continental Margins (Cham). doi: 10.1007/978-3-030-81186-0_43
Argentino C., Waghorn K. A., Vadakkepuliyambatta S., Polteau S., Bünz S., Panieri G. (2021). Dynamic and history of methane seepage in the SW Barents Sea: New insights from Leirdjupet Fault Complex. Sci. Rep. 11 (1), 4373. doi: 10.1038/s41598-021-83542-0
Åström E. K. L., Carroll M. L., Ambrose W. G., Sen A., Silyakova A., Carroll J. L. (2018). Methane cold seeps as biological oases in the high-Arctic deep sea. Limnology Oceanography 63 (S1), S209–S231. doi: 10.1002/lno.10732
Åström E. K. L., Sen A., Carroll M. L., Carroll J. L. (2020). Cold seeps in a warming arctic: insights for benthic ecology. Front. Mar. Sci. 7. doi: 10.3389/FMARS.2020.00244/BIBTEX
Bell K. L. C., Chow J. S., Hope A., Quinzin M. C., Cantner K. A., Amon D. J., et al. (2022). Low-cost, deep-sea imaging and analysis tools for deep-sea exploration: A collaborative design study. Front. Mar. Sci. 9. doi: 10.3389/fmars.2022.873700
Blouin A., Imbert P., Sultan N., Callot J.-P. (2019). Evolution model for the absheron mud volcano: from in situ observations to numerical modeling. J. Geophysical Research: Earth Surface. 124, 766–794. doi: 10.1029/2018JF004872
Boethius A., Kjällquist M., Magnell O., Apel J. (2020). Human encroachment, climate change and the loss of our archaeological organic cultural heritage: Accelerated bone deterioration at Ageröd, a revisited Scandinavian Mesolithic key-site in despair. PloS One 15, (7). doi: 10.1371/journal.pone.0236105
Bünz S., Panieri G. (2022). “CAGE21-1 cruise report: AKMA-AKER-GReAT,” in CAGE – Centre for Arctic Gas Hydrate, Environment and Climate Report Series, vol. 9. doi: 10.7557/cage.6677
Clarke J. E. H. (2018). “Multibeam echosounders,” in Submarine Geomorphology. Eds. Micallef A., Krastel S., Savini A. (Springer Geology). doi: 10.1007/978-3-319-57852-1_3
Conti L. A., Lim A., Wheeler A. J. (2019). High resolution mapping of a cold water coral mound. Sci. Rep. 9 (1), Articolo 1. doi: 10.1038/s41598-018-37725-x
De Beer D., Sauter E., Niemann H., Kaul N., Foucher J. P., Witte U., et al. (2006). In situ fluxes and zonation of microbial activity in surface sediments of the Håkon Mosby Mud Volcano. Limnology Oceanography 51 (3), 1315–1331. doi: 10.4319/LO.2006.51.3.1315
De Oliveira L. M. C., Lim A., Conti L. A., Wheeler A. J. (2022). High-resolution 3D mapping of cold-water coral reefs using machine learning. Front. Environ. Sci. 10. doi: 10.3389/fenvs.2022.1044706
Dubilier N., Bergin C., Lott C. (2008). Symbiotic diversity in marine animals: The art of harnessing chemosynthesis. Nat. Rev. Microbiol. 6 (10), Articolo 10. doi: 10.1038/nrmicro1992
Dupré S., Buffet G., Mascle J., Foucher J.-P., Gauger S., Boetius A., et al. (2008). High-resolution mapping of large gas emitting mud volcanoes on the Egyptian continental margin (Nile Deep Sea Fan) by AUV surveys. Mar. Geophysical Res. 29 (4), 275–290. doi: 10.1007/s11001-009-9063-3
Etiope G. (2015). “Gas seepage classification and global distribution,” in Natural Gas Seepage: The Earth’s Hydrocarbon Degassing. Ed. Etiope G. (Springer International Publishing), 17–43. doi: 10.1007/978-3-319-14601-0_2
Faleide J. I., Solheim A., Fiedler A., Hjelstuen B. O., Andersen E. S., Vanneste K. (1996). Late Cenozoic evolution of the western Barents Sea-Svalbard continental margin. Global Planetary Change 12 (1), 53–74. doi: 10.1016/0921-8181(95)00012-7
Fallati L., Saponari L., Savini A., Marchese F., Corselli C., Galli P. (2020). Multi-temporal UAV data and bject-based image analysis (OBIA) for estimation of substrate changes in a post-bleaching scenario on a Maldivian reef. Remote Sens. 12 (13), 2093. doi: 10.3390/rs12132093
Feseker T., Foucher J. P., Harmegnies F. (2008). Fluid flow or mud eruptions? Sediment temperature distributions on Håkon Mosby mud volcano, SW Barents Sea slope. Mar. Geology 247 (3–4), 194–207. doi: 10.1016/J.MARGEO.2007.09.005
Fiedler A., Faleide J. I. (1996). Cenozoic sedimentation along the southwestern Barents Sea margin in relation to uplift and erosion of the shelf. Global Planetary Change 12 (1), 75–93. doi: 10.1016/0921-8181(95)00013-5
Foubert A., Huvenne V. A. I., Wheeler A., Kozachenko M., Opderbecke J., Henriet J.-P. (2011). The Moira Mounds, small cold-water coral mounds in the Porcupine Seabight, NE Atlantic: Part B—Evaluating the impact of sediment dynamics through high-resolution ROV-borne bathymetric mapping. Mar. Geology 282 (1), 65–78. doi: 10.1016/j.margeo.2011.02.008
Foucher J. P., Dupré S., Scalabrin C., Feseker T., Harmegnies F., Nouzé H. (2010). Changes in seabed morphology, mud temperature and free gas venting at the Håkon Mosby mud volcano, offshore northern Norway, over the time period 2003-2006. Geo-Marine Lett. 30 (3–4), 157–167. doi: 10.1007/s00367-010-0193-z
Foucher J.-P., Westbrook G. K., Boetius A., Ceramicola S., Dupré S., Mascle J., et al. (2009). Structure and drivers of cold seep ecosystems. Oceanography 22 (1), 92–109. doi: 10.5670/oceanog.2009.11
Gebruk A. V., Krylova E. M., Lein A. Y., Vinogradov G. M., Anderson E., Pimenov N. V., et al. (2003). Methane seep community of the Håkon Mosby mud volcano (the Norwegian Sea): Composition and trophic aspects. Sarsia 88 (6), 394–403. doi: 10.1080/00364820310003190
Girard F., Sarrazin J., Olu K. (2020). Impacts of an eruption on cold-seep microbial and faunal dynamics at a mud volcano. Front. Mar. Sci. 7. doi: 10.3389/fmars.2020.00241
Hjelstuen B. O., Eldholm O., Faleide J. I., Vogt P. R. (1999). Regional setting of Hakon Mosby Mud Volcano, SW Barents Sea margin. Geo-Marine Lett. 19 (1–2), 22–28. doi: 10.1007/s003670050089
Hossain M. D., Chen D. (2019). Segmentation for Object-Based Image Analysis (OBIA): A review of algorithms and challenges from remote sensing perspective. ISPRS J. Photogrammetry Remote Sens. 150, 115–134. doi: 10.1016/j.isprsjprs.2019.02.009
Huvenne V. A. I., Robert K., Marsh L., Lo Iacono C., Le Bas T. P., Wynn R. B. (2018). ROVs and AUVs. Submarine Geomorphology (Heidelberg), 93–108.
Jerosch K., Schlüter M., Foucher J. P., Allais A. G., Klages M., Edy C. (2007). Spatial distribution of mud flows, chemoautotrophic communities, and biogeochemical habitats at Håkon Mosby Mud Volcano. Mar. Geology 243 (1–4), 1–17. doi: 10.1016/j.margeo.2007.03.010
Joye S. B. (2020). The geology and biogeochemistry of hydrocarbon seeps. Annu. Rev. Earth Planetary Sci. 48 (1), 205–231. doi: 10.1146/annurev-earth-063016-020052
Judd A., Hovland M. (2007). “Seabed fluid flow: the impact on geology, biology and the marine environment,” (Cambridge: Cambridge University Press). doi: 10.1017/CBO9780511535918
Kallmejer J. (2017). “Life at vents and seeps (Life in extreme environments),” in De Gruyter, 1st edn.
Kopf A. J. (2002). Significance of mud volcanism. Rev. Geophysics 40 (2), 2-1-2–2-152. doi: 10.1029/2000RG000093
Laberg J. S., Vorren T. O. (1993). A Late Pleistocene submarine slide on the Bear Island Trough Mouth Fan. Geo-Marine Lett. 13 (4), 227–234. doi: 10.1007/BF01207752
Laberg J. S., Vorren T. O. (1996). The middle and late pleistocence evolution and the bear island trough mouth fan. Global Planetary Change 12 (1), 309–330. doi: 10.1016/0921-8181(95)00026-7
Landis J. R., Koch G. G. (1977). The measurement of observer agreement for categorical data. Biometrics 33 (1), 159–174. doi: 10.2307/2529310
Lee D.-H., Kim J.-H., Lee Y. M., Kim J.-H., Jin Y. K., Paull C., et al. (2021). Geochemical and microbial signatures of siboglinid tubeworm habitats at an active mud volcano in the Canadian beaufort sea. Front. Mar. Sci. 8. doi: 10.3389/fmars.2021.656171
Leon J. X., Roelfsema C. M., Saunders M. I., Phinn S. R. (2015). Measuring coral reef terrain roughness using «Structure-from-Motion» close-range photogrammetry. Geomorphology 242, 21–28. doi: 10.1016/j.geomorph.2015.01.030
Levin L. A., Le Bris N. (2015). The deep ocean under climate change. Science 350 (6262), 766–768. doi: 10.1126/science.aad0126
Lim A., Huvenne V. A. I., Vertino A., Spezzaferri S., Wheeler A. J. (2018). New insights on coral mound development from groundtruthed high-resolution ROV-mounted multibeam imaging. Mar. Geology 403, 225–237. doi: 10.1016/j.margeo.2018.06.006
Lim A., Wheeler A. J., Price D. M., O’Reilly L., Harris K., Conti L. (2020). Influence of benthic currents on cold-water coral habitats: A combined benthic monitoring and 3D photogrammetric investigation. Sci. Rep. 10 (1), 1–15. doi: 10.1038/s41598-020-76446-y
Loher M., Pape T., Marcon Y., Römer M., Wintersteller P., Praeg D., et al. (2018). Mud extrusion and ring-fault gas seepage – upward branching fluid discharge at a deep-sea mud volcano. Sci. Rep. 8, 6275. doi: 10.1038/s41598-018-24689-1
MacDonald I. R., Buthman D. B., Sager W. W., Peccini M. B., Guinasso N. L. Jr. (2000). Pulsed oil discharge from a mud volcano. Geology 28 (10), 907–910. doi: 10.1130/0091-7613(2000)28<907:PODFAM>2.0.CO;2
Marcon Y. (2014). “LAPMv2: An improved tool for underwater large-area photo-mosaicking,” in 2014 oceans - st. John’s, 1–10. doi: 10.1109/OCEANS.2014.7003185
Marcon Y., Sahling H., Allais A. G., Bohrmann G., Olu K. (2014). Distribution and temporal variation of mega-fauna at the Regab pockmark (Northern Congo Fan), based on a comparison of videomosaics and geographic information systems analyses. Mar. Ecol. 35 (1), 77–95. doi: 10.1111/maec.12056
Marcon Y., Sahling H., Bohrmann G. (2013). LAPM: A tool for underwater large-area photo-mosaicking. Geoscientific Instrumentation Methods Data Syst. 2 (2), 189–198. doi: 10.5194/gi-2-189-2013
Mayer L., Jakobsson M., Allen G., Dorschel B., Falconer R., Ferrini V., et al. (2018). The nippon foundation—GEBCO seabed 2030 project: the quest to see the world’s oceans completely mapped by 2030. Geosciences 8 (2), Articolo 2. doi: 10.3390/geosciences8020063
Mazzini A., Etiope G. (2017). Mud volcanism: An updated review. Earth-Science Rev. 168, 81–112. doi: 10.1016/J.EARSCIREV.2017.03.001
Mengerink K. J., Van Dover C. L., Ardron J., Baker M. C., Escobar-Briones E., Gjerde K., et al. (2014). A call for deep-ocean stewardship. Science 344, 696–698. doi: 10.1126/science.1251458
Milkov A. V., Vogt P. R., Crane K., Lein A. Y., Sassen R., Cherkashev G. A. (2004). Geological, geochemical, and microbial processes at the hydrate-bearing Håkon Mosby mud volcano: A review. Chem. Geology 205 (3–4), 347–366. doi: 10.1016/j.chemgeo.2003.12.030
Montalbetti E., Fallati L., Casartelli M., Maggioni D., Montano S., Galli P., et al. (2022). Reef complexity influences distribution and habitat choice of the corallivorous seastar Culcita schmideliana in the Maldives. Coral Reefs 41 (2), 253–264. doi: 10.1007/s00338-022-02230-1
Montes-Herrera J. C., Hill N., Cummings V. J., Johnstone G. J., Stark J. S., Lucieer V. (2023). Remote sensing of Antarctic polychaete reefs (Serpula narconensis): reproducible workflows for quantifying benthic structural complexity with action cameras, remotely operated vehicles and structure-from-motion photogrammetry. Remote Sens. Ecol. Conserv. doi: 10.1002/rse2.358
Mountrakis G., Im J., Ogole C. (2011). Support vector machines in remote sensing: A review. ISPRS J. Photogrammetry Remote Sens. 66 (3), 247–259. doi: 10.1016/j.isprsjprs.2010.11.001
Niemann H., Lösekann T., De Beer D., Elvert M., Nadalig T., Knittel K., et al. (2006). Novel microbial communities of the Haakon Mosby mud volcano and their role as a methane sink. Nature 443 (7113), 854–858. doi: 10.1038/nature05227
Opderbecke J., Simeoni P., Allais A.-G., Edy C., Bisquay H. (2004). “High resolution swath bathymetric sea-bed mapping with the ROV victor 6000,” in The Fourteenth International Offshore and Polar Engineering Conference.
Paull C. K., Dallimore S. R., Caress D. W., Gwiazda R., Melling H., Riedel M., et al. (2015). Active mud volcanoes on the continental slope of the Canadian Beaufort Sea. Geochemistry Geophysics Geosystems. 16, 3160–3181. doi: 10.1002/2015GC005928
Perez-Garcia C., Feseker T., Mienert J., Berndt C. (2009). The Håkon Mosby mud volcano: 330 000 years of focused fluid flow activity at the SW Barents Sea slope. Mar. Geology 262 (1–4), 105–115. doi: 10.1016/j.margeo.2009.03.022
Price D. M., Robert K., Callaway A., Lo lacono C., Hall R. A., Huvenne V. A. I. (2019). ). Using 3D photogrammetry from ROV video to quantify cold-water coral reef structural complexity and investigate its influence on biodiversity and community assemblage. Coral Reefs. doi: 10.1007/s00338-019-01827-3
Ramirez-Llodra E. (2020). “DeepSea ecosystems: biodiversity and anthropogenic impacts,” in The Law of the Seabed. Eds. Banet C. (Brill | Nijhoff).
Robert K., Huvenne V. A. I., Georgiopoulou A., Jones D. O. B., Marsh L., Carter D. O. G., et al. (2017). New approaches to high-resolution mapping of marine vertical structures. Sci. Rep. 7 (1), 9005. doi: 10.1038/s41598-017-09382-z
Rybakova Goroslavskaya E., Galkin S., Bergmann M., Soltwedel T., Gebruk A. (2013). Density and distribution of megafauna at the Håkon Mosby mud volcano (the Barents Sea) based on image analysis. Biogeosciences 10 (5), 3359–3374. doi: 10.5194/bg-10-3359-2013
Sappington J. M., longshore K. M., thompson D. B. (2007). Quantifying landscape ruggedness for animal habitat analysis: A case study using bighorn sheep in the Mojave desert. J. Wildlife Manage. 71 (5), 1419–1426. doi: 10.2193/2005-723
Sauter E. J., Muyakshin S. I., Charlou J.-L., Schlüter M., Boetius A., Jerosch K., et al. (2006). Methane discharge from a deep-sea submarine mud volcano into the upper water column by gas hydrate-coated methane bubbles. Earth Planetary Sci. Lett. 243 (3), 354–365. doi: 10.1016/j.epsl.2006.01.041
Savini A., Krastel S., Micallef A. (2021). “Perspectives on submarine geomorphology: an introduction,” in Reference Module in Earth Systems and Environmental Sciences (Elsevier). doi: 10.1016/B978-0-12-818234-5.00192-9
Savini A., Pinson S., Bistacchi A., Etiope G., Holland C. (2018). Imaging shallow gas migration pathways in a mud-volcano province using an autonomous underwater vehicle (Malta Plateau, Mediterranean Sea). Near Surface Geophysics. 16, 681–699. doi: 10.1002/nsg.12017
Singh H., Can A., Eustice R., Lerner S., McPhee N., Roman C. (2004). Seabed AUV offers new platform for high-resolution imaging. Eos Trans. Am. Geophysical Union 85 (31), 289. doi: 10.1029/2004EO310002
Thurber A. R., Sweetman A. K., Narayanaswamy B. E., Jones D. O. B., Ingels J., Hansman R. L. (2014). Ecosystem function and services provided by the deep sea. Biogeosciences 11, 3941–3963. doi: 10.5194/bg-11-3941-2014
Ventura D., Bonifazi A., Gravina M. F., Belluscio A., Ardizzone G. (2018). Mapping and classification of ecologically sensitive marine habitats using unmanned aerial vehicle (UAV) imagery and object-based image analysis (OBIA). Remote Sens. 10 (9), 1331. doi: 10.3390/rs10091331
Ventura D., Dubois S. F., Bonifazi A., Jona Lasinio G., Seminara M., Gravina M. F., et al. (2020). Integration of close-range underwater photogrammetry with inspection and mesh processing software: A novel approach for quantifying ecological dynamics of temperate biogenic reefs. Remote Sens. Ecol. Conserv., rse2.178. doi: 10.1002/rse2.178
Ventura D., Mancini G., Casoli E., Pace D. S., Lasinio G. J., Belluscio A., et al. (2022). Seagrass restoration monitoring and shallow-water benthic habitat mapping through a photogrammetry-based protocol. J. Environ. Manage. 304, 114262. doi: 10.1016/j.jenvman.2021.114262
Vogt P. R., Cherkashev G., Ginsburg G., Ivanov G., Milkov A., Crane K., et al. (1997). Haakon Mosby mud volcano: A warm methane seep with seafloor hydrates and chemosynthesis-based Ecosystem in late Quarternary Slide Valley, Bear Island Fan, Barents Sea passive margin. EOS Trans. AGU 78 (48), 187–189. doi: 10.1029/97eo00326
Vogt P. R., Gardner J., Crane K. (1999). The Norwegian-Barents-Svalbard (NBS) continental margin: Introducing a natural laboratory of mass wasting, hydrates, and ascent of sediment, pore water, and methane. Geo-Marine Lett. 19 (1–2), 2–21. doi: 10.1007/s003670050088
Wahidin N., Siregar V. P., Nababan B., Jaya I., Wouthuyzen S. (2015). Object-based image analysis for coral reef benthic habitat mapping with several classification algorithms. Proc. Environ. Sci. 24, 222–227. doi: 10.1016/j.proenv.2015.03.029
Walbridge S., Slocum N., Pobuda M., Wright D. J. (2018). Unified geomorphological analysis workflows with benthic terrain modeler. Geosciences (Switzerland) 8 (3), 94. doi: 10.3390/geosciences8030094
Westoby M. J., Brasington J., Glasser N. F., Hambrey M. J., Reynolds J. M. (2012). «Structure-from-Motion» photogrammetry: A low-cost, effective tool for geoscience applications. Geomorphology 179(December 2012), 300–314. doi: 10.1016/j.geomorph.2012.08.021
Whitt C., Pearlman J., Polagye B., Caimi F., Muller-Karger F., Copping A., et al. (2020). Future vision for autonomous ocean observations. Front. Mar. Sci. 7. doi: 10.3389/fmars.2020.00697
Wicaksono P., Aryaguna P. A., Lazuardi W. (2019). Benthic habitat mapping model and cross validation using machine-learning classification algorithms. Remote Sens. 11 (11), 1–24. doi: 10.3390/rs11111279
Wölfl A.-C., Snaith H., Amirebrahimi S., Devey C. W., Dorschel B., Ferrini V., et al. (2019). Seafloor mapping – the challenge of a truly global ocean bathymetry. Front. Mar. Sci. 6. doi: 10.3389/fmars.2019.00283
Keywords: ROV, structure from motion, microbathymetry, Haakon Mosby Mud Volcano, arctic seafloor mapping, arctic cold seeps, methane seepage, benthic environment
Citation: Fallati L, Panieri G, Argentino C, Varzi AG, Bünz S and Savini A (2023) Characterizing Håkon Mosby Mud Volcano (Barents Sea) cold seep systems by combining ROV-based acoustic data and underwater photogrammetry. Front. Mar. Sci. 10:1269197. doi: 10.3389/fmars.2023.1269197
Received: 29 July 2023; Accepted: 09 October 2023;
Published: 31 October 2023.
Edited by:
Mariacristina Prampolini, National Research Council (CNR), ItalyReviewed by:
Daniele Spatola, Sapienza University of Rome, ItalyRiccardo Arosio, University College Cork, Ireland
Daniele Ventura, Sapienza University of Rome, Italy
Martina Pierdomenico, National Research Council (CNR), Italy
Tobias Himmler, University of Bremen, Germany
Copyright © 2023 Fallati, Panieri, Argentino, Varzi, Bünz and Savini. This is an open-access article distributed under the terms of the Creative Commons Attribution License (CC BY). The use, distribution or reproduction in other forums is permitted, provided the original author(s) and the copyright owner(s) are credited and that the original publication in this journal is cited, in accordance with accepted academic practice. No use, distribution or reproduction is permitted which does not comply with these terms.
*Correspondence: Luca Fallati, luca.fallati@unimib.it; Giuliana Panieri, giuliana.panieri@uit.no