
Isolation and Structure Determination of Echinochrome A Oxidative Degradation Products

 , , ,
, , ,
Abstract
:
1. Introduction
2. Results and Discussion
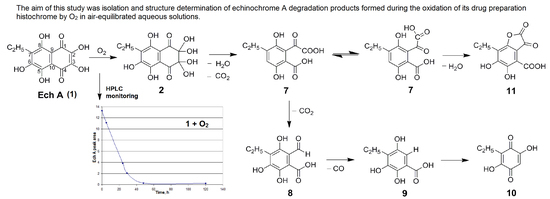
2.1. Isolation and Structure Elucidation of Echinochrome A Oxidative Degradation Products
2.2. Proposed Mechanism of Echinochrome A Oxidative Degradation
2.3. Predicted Toxicity of Echinochrome A and Its Oxidation Products
3. Materials and Methods
3.1. Materials
3.2. Instruments
3.3. HPLC–DAD–MS Analysis
3.4. HPLC Method Validation
3.5. Oxidation Products Preparation and Isolation
3.6. In Silico Toxicity Studies
4. Conclusions
Supplementary Materials
Author Contributions
Funding
Acknowledgments
Conflicts of Interest
References
- Mishchenko, N.P.; Fedoreev, S.A.; Bagirova, V.L. Histochrome: A New Original Domestic Drug. Pharm. Chem. J. 2003, 37, 48–52. [Google Scholar] [CrossRef]
- Mischenko, N.P.; Fedoreyev, S.A.; Pokhilo, N.D.; Anufriev, V.P.; Denisenko, V.A.; Glazunov, V.P. Echinamines A and B, First Aminated Hydroxynaphthazarins from the Sea Urchin Scaphechinus mirabilis. J. Nat. Prod. 2005, 68, 1390–1393. [Google Scholar] [CrossRef]
- Vasileva, E.A.; Mishchenko, N.P.; Tran, V.T.T.; Vo, H.M.N.; Bui, L.M.; Denisenko, V.A.; Fedoreyev, S.A. Quinoid Pigments from the Sea Urchin Astropyga radiata. Chem. Nat. Compd. 2017, 53, 356–358. [Google Scholar] [CrossRef]
- Hou, Y.; Vasileva, E.A.; Carne, A.; McConnell, M.; Bekhit, A.E.-D.A.; Hou, Y. Naphthoquinones of the spinochrome class: Occurrence, isolation, biosynthesis and biomedical applications. RSC Adv. 2018, 8, 32637–32650. [Google Scholar] [CrossRef] [Green Version]
- Jeong, S.H.; Kim, H.K.; Song, I.-S.; Lee, S.J.; Ko, K.S.; Rhee, B.D.; Kim, N.; Mishchenko, N.P.; Fedoreyev, S.A.; Stonik, V.A.; et al. Echinochrome A Protects Mitochondrial Function in Cardiomyocytes against Cardiotoxic Drugs. Mar. Drugs 2014, 12, 2922–2936. [Google Scholar] [CrossRef] [Green Version]
- Jeong, S.H.; Kim, H.K.; Song, I.-S.; Noh, S.J.; Marquez, J.; Ko, K.S.; Rhee, B.D.; Kim, N.; Mishchenko, N.P.; Fedoreyev, S.A.; et al. Echinochrome A Increases Mitochondrial Mass and Function by Modulating Mitochondrial Biogenesis Regulatory Genes. Mar. Drugs 2014, 12, 4602–4615. [Google Scholar] [CrossRef] [PubMed]
- Seo, D.Y.; A McGregor, R.; Noh, S.J.; Choi, S.-J.; Mishchenko, N.P.; Fedoreyev, S.A.; Stonik, V.A.; Han, J. Echinochrome A Improves Exercise Capacity during Short-Term Endurance Training in Rats. Mar. Drugs 2015, 13, 5722–5731. [Google Scholar] [CrossRef] [Green Version]
- Kim, H.K.; Youm, J.B.; Jeong, S.H.; Lee, S.R.; Song, I.-S.; Ko, T.H.; Pronto, J.R.; Ko, K.S.; Rhee, B.D.; Kim, N.; et al. Echinochrome A regulates phosphorylation of phospholamban Ser16 and Thr17 suppressing cardiac SERCA2A Ca2+ reuptake. Pflügers Archiv. Eur. J. Physiol. 2014, 467, 2151–2163. [Google Scholar] [CrossRef]
- Park, J.H.; Lee, N.-K.; Lim, H.J.; Mazumder, S.; Rethineswaran, V.K.; Kim, Y.-J.; Jang, W.B.; Ji, S.T.; Kang, S.; Kim, D.Y.; et al. Therapeutic Cell Protective Role of Histochrome under Oxidative Stress in Human Cardiac Progenitor Cells. Mar. Drugs 2019, 17, 368. [Google Scholar] [CrossRef] [Green Version]
- Park, G.-B.; Kim, M.-J.; Vasileva, E.A.; Mishchenko, N.P.; Fedoreyev, S.A.; Stonik, V.A.; Han, J.; Lee, H.S.; Kim, D.; Jeong, J.-Y. Echinochrome A Promotes Ex Vivo Expansion of Peripheral Blood-Derived CD34+ Cells, Potentially through Downregulation of ROS Production and Activation of the Src-Lyn-p110δ Pathway. Mar. Drugs 2019, 17, 526. [Google Scholar] [CrossRef] [Green Version]
- Gusev, E.I.; Stonik, V.A.; Martynov, M.I.; Guseva, M.R.; Shchukin, I.A.; Agafonova, I.G.; Mishchenko, N.P.; Fedoreev, S.A. An influence of histochrome on the dynamics of neurological disorders and MRT-picture in experimental hemorrhagic stroke. Zhurnal Nevrol. i psikhiatrii im. S.S. Korsakova 2005, 105, 61–66. [Google Scholar]
- Kim, R.; Hur, D.; Kim, H.K.; Han, J.; Mishchenko, N.P.; Fedoreyev, S.A.; Stonik, V.A.; Chang, W. Echinochrome A Attenuates Cerebral Ischemic Injury through Regulation of Cell Survival after Middle Cerebral Artery Occlusion in Rat. Mar. Drugs 2019, 17, 501. [Google Scholar] [CrossRef] [PubMed] [Green Version]
- Mohamed, A.S.; Soliman, A.M.; Marie, M.A.S. Mechanisms of echinochrome potency in modulating diabetic complications in liver. Life Sci. 2016, 151, 41–49. [Google Scholar] [CrossRef]
- Soliman, A.M.; Mohamed, A.S.; Marie, M.A.S. Comparative study between the hypoglycemic and antioxidant effects of echinochrome on type 1 and type 2 diabetes mellitus. Res. J. Biol. 2016, 4, 1–9. [Google Scholar]
- Lee, S.R.; Pronto, J.R.D.; Sarankhuu, B.-E.; Ko, K.S.; Rhee, B.D.; Kim, N.; Mishchenko, N.P.; Fedoreyev, S.A.; Stonik, V.A.; Han, J. Acetylcholinesterase Inhibitory Activity of Pigment Echinochrome A from Sea Urchin Scaphechinus mirabilis. Mar. Drugs 2014, 12, 3560–3573. [Google Scholar] [CrossRef] [Green Version]
- Oh, S.-J.; Seo, Y.; Ahn, J.-S.; Shin, Y.Y.; Yang, J.W.; Kim, H.K.; Han, J.; Hou, Y.; Fedoreyev, S.A.; Stonik, V.A.; et al. Echinochrome A Reduces Colitis in Mice and Induces In Vitro Generation of Regulatory Immune Cells. Mar. Drugs 2019, 17, 622. [Google Scholar] [CrossRef] [Green Version]
- Lebed’ko, O.A.; Ryzhavskii, B.Y.; Tkach, O.V.; Kuznetsova, M.S.; Guseva, O.E. Influence of oral administration echinochrome A on structural-metabolic disorders, bleomycin-induced in the rat lung early stage postnatal ontogenesis. Far East Med. J. 2016, 3, 93–97. [Google Scholar]
- Kozlov, V.K.; Kozlov, M.V.; Guseva, O.E.; Lebedko, O.A.; Morozova, N.V. Antioxidative activity of echinochrome A in case of chronic inflammatory lung diseases in children. Pacific Med. J. 2009, 3, 116–117. [Google Scholar]
- Kozlov, V.K.; Kozlov, M.V.; Lebedko, O.A.; Yephimenko, M.V.; Guseva, O.E.; Morozova, N.V. Influence of echinochrome A on some parameters of systemic free-radical status and t-cell immunity under chronic inflammatory lung diseases in children at the period of remission. Far East Med. J. 2010, 1, 55–58. [Google Scholar]
- Anufrieva, A.V.; Lebedko, O.A.; Berezina, G.P.; Kozlov, V.K. Effect of echinochrome A on biogenesis of free radicals in the gastric mucosa of adolescents with erosive gastroduodenitis. Far East Med. J. 2012, 1, 78–81. [Google Scholar]
- Anufrieva, A.V.; Lebed’ko, O.A.; Berezina, G.P.; Kozlov, V.K. Correction of free radical disordes at erosive gastroduodenitis. Health. Med. Ecol. Sci. 2014, 3, 13–15. [Google Scholar]
- Sengupta, P.; Chatterjee, B.; Tekade, R.K. Current regulatory requirements and practical approaches for stability analysis of pharmaceutical products: A comprehensive review. Int. J. Pharm. 2018, 543, 328–344. [Google Scholar] [CrossRef] [PubMed]
- Novikov, V.L.; Shestak, O.P.; Mishchenko, N.P.; Fedoreev, S.A.; Vasileva, E.A.; Glazunov, V.P.; Artyukov, A.A. Oxidation of 7-ethyl-2,3,5,6,8-pentahydroxy-1,4-naphthoquinone (echinochrome A) by atmospheric oxygen 1. Structure of dehydroechinochrome. Russ. Chem. Bull. 2018, 67, 282–290. [Google Scholar] [CrossRef]
- Mishchenko, N.P.; Fedoreev, S.A.; Glazunov, V.P.; Denisenko, V.A.; Krasovskaya, N.P.; Glebko, L.I.; Maslov, L.G.; Dmitrenok, P.S.; Bagirova, V.L. Isolation and Identification of Impurities in the Parent Substance of Echinochrome and in the Drug Histochrome. Pharm. Chem. J. 2004, 38, 50–53. [Google Scholar] [CrossRef]
- Rao, P.S.; Reddy, P.P.; Seshadri, T.R. Methylation of hydroxy flavonols using methyl iodide and potassium carbonate. Proc. Math. Sci. 1940, 12, 495. [Google Scholar] [CrossRef]
- Kuhn, R.; Wallenfels, K. Dehydroechinochrom. Ber. Deutsch. Chem. Gesel. (A und B Ser.) 1942, 75, 407–413. [Google Scholar] [CrossRef]
- Malinovskaya, G.V.; Chizhova, A.Y.; Anufriev, V.P.; Glazunov, V.P.; Denisenko, V.A. The chemistry of naphthazarine derivatives. Russ. Chem. Bull. 1999, 48, 1587–1589. [Google Scholar] [CrossRef]
- Moore, R.E.; Singh, H.; Scheuer, P.J. Isolation of Eleven New Spinochromes from Echinoids of the Genus Echinothrix. J. Org. Chem. 1966, 31, 3645–3650. [Google Scholar] [CrossRef]
- Hovorka, S.W.; Schoneich, C. Oxidative Degradation of Pharmaceuticals: Theory, Mechanisms and Inhibition. J. Pharm. Sci. 2001, 90, 253–269. [Google Scholar] [CrossRef]
- Hoffmann, M.E.; Ciampi, D.B.; Durán, N. The autooxidation of 2,3,5,6-tetrahydroxy-2,5-cyclohexadiene-1,4-dione under physiological conditions. Cell. Mol. Life Sci. 1987, 43, 217–220. [Google Scholar] [CrossRef]
- Dántola, M.L.; Vignoni, M.; Capparelli, A.L.; Lorente, C.; Thomas, A.H. Stability of 7,8-Dihydropterins in Air-Equilibrated Aqueous Solutions. Helvetica Chim. Acta 2008, 91, 411–425. [Google Scholar] [CrossRef]
- Herrmann, N.; Heinz, N.; Dolg, M.; Cao, X. Quantum chemical study of the autoxidation of ascorbate. J. Comput. Chem. 2016, 37, 1914–1923. [Google Scholar] [CrossRef] [PubMed]
- Lebedev, A.V.; Levitskaya, E.L.; Tikhonova, E.V.; Ivanova, M.V. Antioxidant properties, autooxidation, and mutagenic activity of echinochrome a compared with its etherified derivative. Biochem. (Moscow) 2001, 66, 885–893. [Google Scholar] [CrossRef]
- Novikov, V.L.; Shestak, O.P. Thermal and photochemical oxidation of 2-acetylcyclopentanone with atmospheric oxygen. Russ. Chem. Bull. 2012, 61, 1099–1110. [Google Scholar] [CrossRef]
- Pracht, J.; Boenigk, J.; Isenbeck-Schröter, M.; Keppler, F.; Schöler, H.F. Abiotic Fe(III) induced mineralization of phenolic substances. Chemosphere 2001, 44, 613–619. [Google Scholar] [CrossRef]
- Banerjee, P.; O Eckert, A.; Schrey, A.K.; Preissner, R. ProTox-II: A webserver for the prediction of toxicity of chemicals. Nucleic Acids Res. 2018, 46, W257–W263. [Google Scholar] [CrossRef] [Green Version]
- Berdyshev, D.V.; Glazunov, V.P.; Novikov, V.L. 7-Ethyl-2,3,5,6,8-pentahydroxy-1,4-naphthoquinone (echinochrome A): A DFT study of the antioxidant mechanism. 1. Interaction of echinochrome A with hydroperoxyl radical. Russ. Chem. Bull. 2007, 56, 413–429. [Google Scholar] [CrossRef]
- Glazunov, V.P.; Berdyshev, D.V.; Novikov, V.L. 7-Ethyl-2,3,5,6,8-pentahydroxy-1,4-naphthoquinone (echinochrome A): A DFT study of the antioxidant mechanism 2.* The structure of monosodium salts of echinochrome A and their reactions with the hydroperoxyl radical. Russ. Chem. Bull. 2010, 59, 43–54. [Google Scholar] [CrossRef]
- Fedoreyev, S.A.; Krylova, N.V.; Mishchenko, N.P.; Vasileva, E.A.; Pislyagin, E.A.; Iunikhina, O.V.; Lavrov, V.F.; Svitich, O.A.; Ebralidze, L.K.; Leonova, G.N. Antiviral and Antioxidant Properties of Echinochrome A. Mar. Drugs 2018, 16, 509. [Google Scholar] [CrossRef] [Green Version]
- SMART; Bruker AXS Inc.: Madison, Wisconsin, USA, 1998.
- SAINT; Bruker AXS Inc.: Madison, Wisconsin, USA, 2003.
- Sheldrick, G.M. SHELXT– Integrated space-group and crystal-structure determination. Acta Crystallogr. Sect. A Found. Adv. 2015, 71, 3–8. [Google Scholar] [CrossRef] [Green Version]
- Sheldrick, G.M. Crystal structure refinement with SHELXL. Acta Crystallogr. Sect. C Struct. Chem. 2015, C71, 3–8. [Google Scholar] [CrossRef] [PubMed]
- Moore, R.; Singh, H.; Chang, C.; Scheuer, P. Polyhydroxynaphthoquinones: Preparation and hydrolysis of methoxyl derivatives. Tetrahedron 1967, 23, 3271–3305. [Google Scholar] [CrossRef]
Sample Availability: Samples of the compounds are not available. |


| Compound | Peak Intensity Relative to 2, (%) | Formula | Measured m/z [M − H]− | Calculated m/z [M − H]− |
|---|---|---|---|---|
| 2 | 100 | C12H12O9 | 299.0399 | 299.0409 |
| 3 | 3 | C12H8O7 | 263.0192 | 263.0197 |
| 4 | 6 | C12H10O8 | 281.0294 | 281.0303 |
| 5 | 2 | C11H10O6 | 237.0397 | 237.0405 |
| 6 | 3 | C11H10O7 | 253.0356 | 253.0356 |
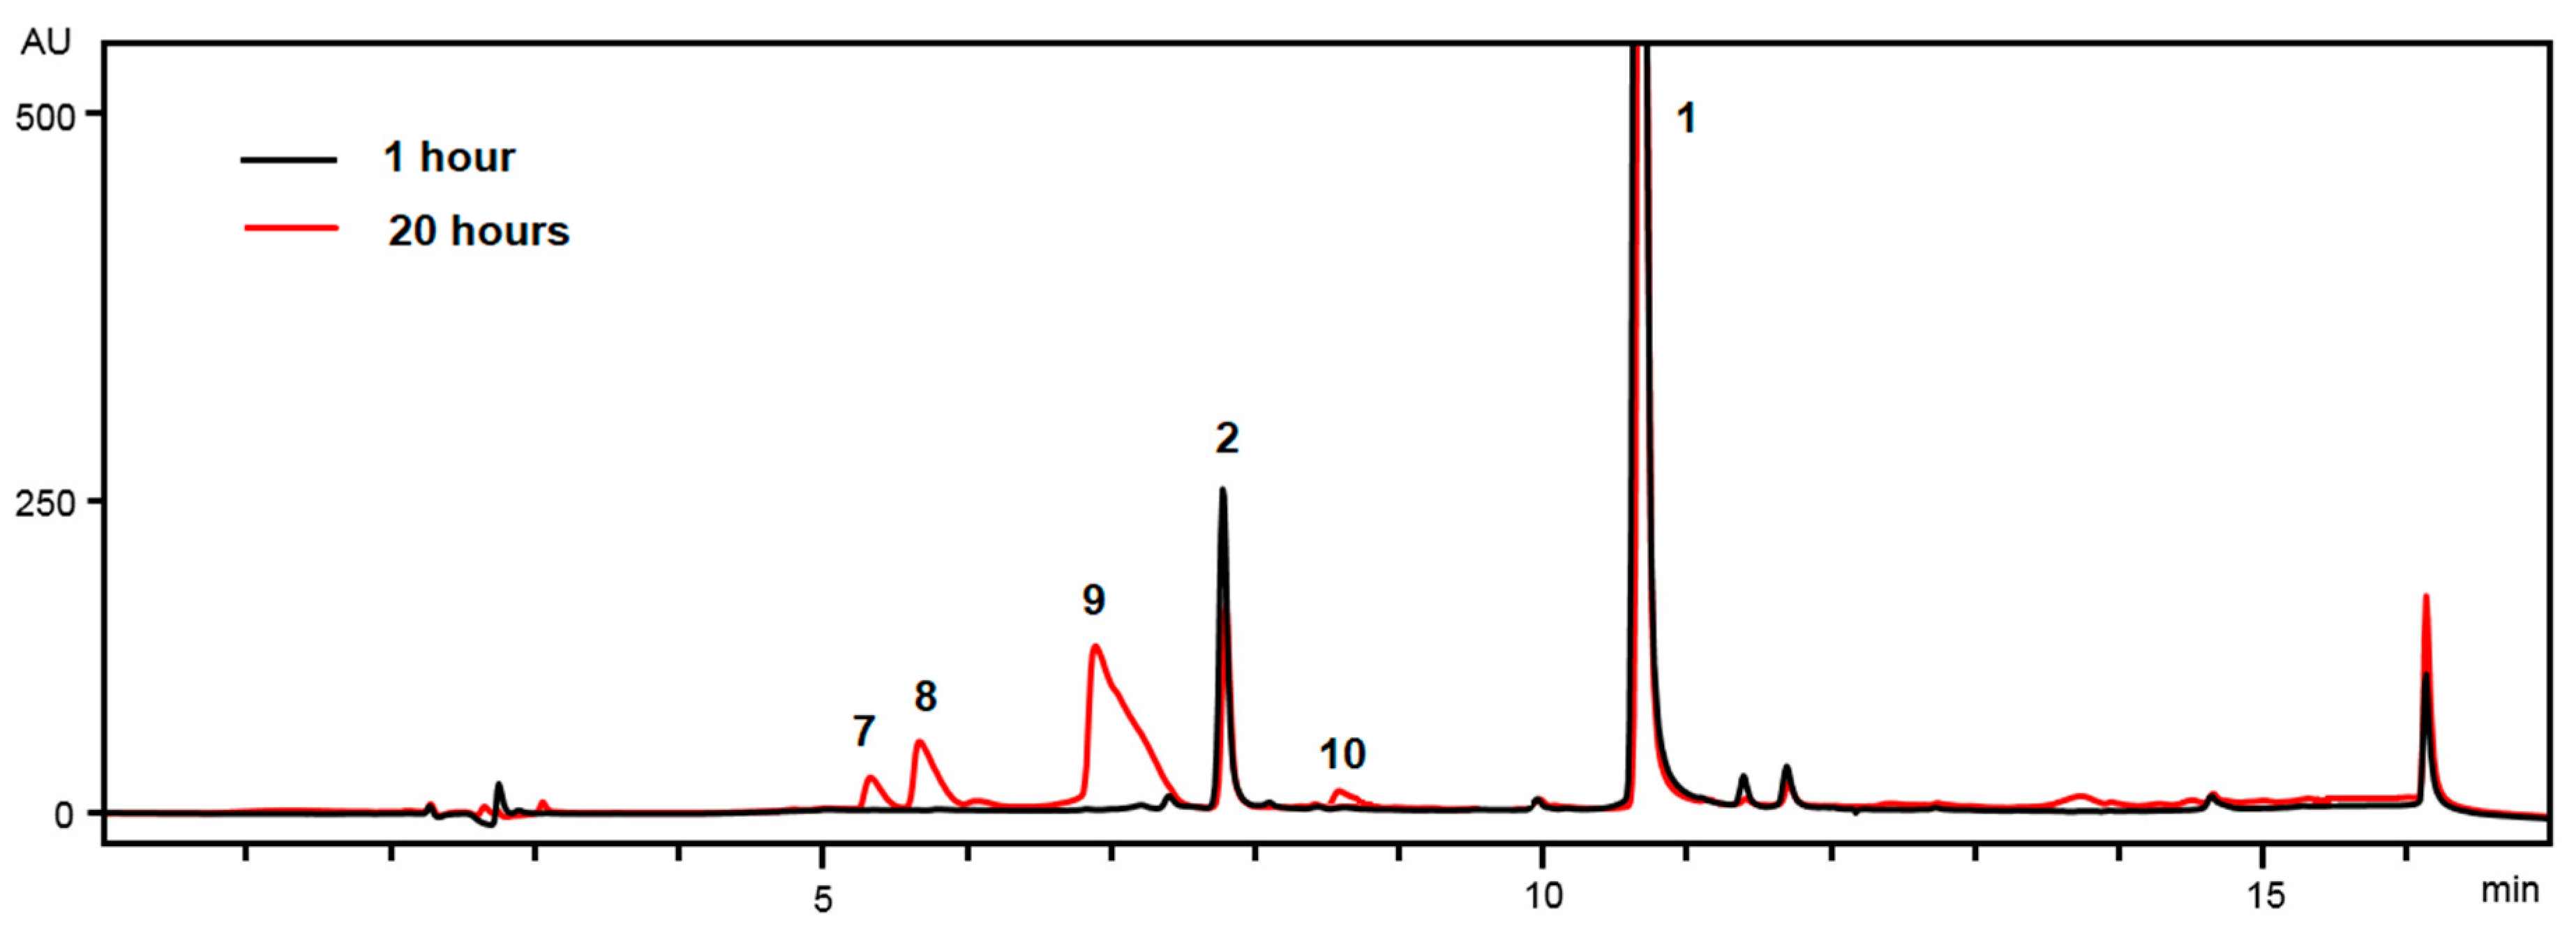
| Compound | Rt (min) | Formula | Measured m/z [M − H]− | Calculated m/z [M − H]− | λmax (nm) |
|---|---|---|---|---|---|
| 1 | 10.71 | C12H10O7 | 265.0352 | 265.0348 | 254, 338, 471 |
| 2 | 7.79 | C12H12O9 | 299.0399 | 299.0409 | 256, 321, 391 |
| 7 | 5.32 | C11H10O8 | 269.0304 | 269.0297 | 219, 271, 320 |
| 8 | 5.67 | C10H10O6 | 225.0405 | 225.0399 | 270, 320 |
| 9 | 6.89 | C9H10O5 | 197.0452 | 197.0450 | 228, 251, 333 |
| 10 | 8.56 | C8H8O4 | 167.0343 | 167.0344 | 287 |
| No. | Dimethyl Ether of 7 (CDCl3) | Methyl Ether of 8 (Acetone-d6) | 9 (Acetone-d6) | ||||||
|---|---|---|---|---|---|---|---|---|---|
| δC | δH | HMBC | δC | δH | HMBC | δC | δH | HMBC | |
| 1 | 107.7 | 107.2 | 109.4 | ||||||
| 2 | 106.3 | 109.3 | 144.4 | 10.70 (1H, s, OH) | 1, 2 | ||||
| 3 | 158.4 | 11.30 (1H, s, OH) | 2, 3, 4, 5 | 159.7 | 13.36 (1H, s, OH) | 2, 3, 4 | 144.5 | 8.01 (1H, s, OH) | |
| 4 | 124.0 | 124.2 | 126.3 | ||||||
| 5 | 150.7 | 6.53 (1H, s, OH) | 3, 4, 5, 6 | 150.7 | 6.56 (1H, s, OH) | 4, 5, 6 | 148.2 | 7.54 (1H, s, OH) | |
| 6 | 143.3 | 10.49 (1H, s, OH) | 1, 5, 6 | 144.9 | 11.35 (1H, s, OH) | 1, 5, 6 | 104.8 | 6.88 (1H, s, H) | 1, 3, 4, 5, 9 |
| 7 | 16.2 | 2.76 (2H, q, J = 7.5, CH2) | 3, 4, 5, 8 | 16.5 | 2.77 (2H, q, J = 7.5, CH2) | 3, 4, 5, 8 | 17.7 | 2.73 (2H, q, J = 7.5, CH2) | 3, 4, 5, 8 |
| 8 | 12.6 | 1.16 (3H, t, J = 7.5, CH3) | 4, 7 | 12.5 | 1.17 (3H, t, J = 7.5, CH3) | 4, 7 | 13.2 | 1.12 (3H, t, J = 7.5, CH3) | |
| 9 | 169.1 | 170.6 | 172.7 | ||||||
| 10 | 186.8 | 195.2 | 10.43 (1H, s, COH) | 2, 3, 4 | |||||
| 11 | 162.9 | ||||||||
| 9-OCH3 | 53.0 | 3.88 (3H, s, OCH3) | 1, 9 | 53.02 | 4.04 (3H, s, OCH3) | ||||
| 11-OCH3 | 52.2 | 3.82 (3H, s, OCH3) | 10, 11 | ||||||
| Classification and target | Ech A and its Degradation Products | ||||||
|---|---|---|---|---|---|---|---|
| 1 (Ech-B) | 1 (Ech-Q) | 2 | 7 | 8 | 9 | 10 | |
| Predicted toxicity class | II | IV | III | IV | IV | IV | V |
| Predicted LD50, mg/kg | 16 | 487 | 221 | 2000 | 2000 | 1800 | 2800 |
| Organ Toxicity | |||||||
| Hepatotoxicity | Inactive | Inactive | Inactive | Inactive | Inactive | Inactive | Inactive |
| Toxicity Endpoints | |||||||
| Carcinogenicity | Inactive | Inactive | Inactive | Inactive | Inactive | Inactive | Inactive |
| Immunotoxicity | Inactive | Inactive | Inactive | Inactive | Inactive | Inactive | Inactive |
| Mutagenicity | Active | Active | Inactive | Inactive | Inactive | Inactive | Inactive |
| Cytotoxicity | Inactive | Inactive | Inactive | Inactive | Inactive | Inactive | Inactive |
Publisher’s Note: MDPI stays neutral with regard to jurisdictional claims in published maps and institutional affiliations. |
© 2020 by the authors. Licensee MDPI, Basel, Switzerland. This article is an open access article distributed under the terms and conditions of the Creative Commons Attribution (CC BY) license (http://creativecommons.org/licenses/by/4.0/).
Share and Cite
Mishchenko, N.P.; Vasileva, E.A.; Gerasimenko, A.V.; Grigorchuk, V.P.; Dmitrenok, P.S.; Fedoreyev, S.A. Isolation and Structure Determination of Echinochrome A Oxidative Degradation Products. Molecules 2020, 25, 4778. https://doi.org/10.3390/molecules25204778
Mishchenko NP, Vasileva EA, Gerasimenko AV, Grigorchuk VP, Dmitrenok PS, Fedoreyev SA. Isolation and Structure Determination of Echinochrome A Oxidative Degradation Products. Molecules. 2020; 25(20):4778. https://doi.org/10.3390/molecules25204778
Chicago/Turabian StyleMishchenko, Natalia P., Elena A. Vasileva, Andrey V. Gerasimenko, Valeriya P. Grigorchuk, Pavel S. Dmitrenok, and Sergey A. Fedoreyev. 2020. "Isolation and Structure Determination of Echinochrome A Oxidative Degradation Products" Molecules 25, no. 20: 4778. https://doi.org/10.3390/molecules25204778