Fertilization and Tree Species Influence on Stable Aggregates in Forest Soil
by
 ,
,
Jacob E. Kemner
1, 
Mary Beth Adams
2,
Louis M. McDonald
3,
William T. Peterjohn
4 and
Charlene N. Kelly
1,* 1
Division of Forestry and Natural Resources, Davis College, West Virginia University, Morgantown, WV 26506, USA
2
Northern Research Station, US Forest Service, Morgantown, WV 26506, USA
3
Division of Plant and Soil Sciences, Davis College, West Virginia University, Morgantown, WV 26506, USA
4
Department of Biology, Eberly College, West Virginia University, Morgantown, WV 26506, USA
*
Author to whom correspondence should be addressed.
Forests 2021, 12(1), 39; https://doi.org/10.3390/f12010039
Submission received: 6 November 2020
/
Revised: 26 December 2020
/
Accepted: 27 December 2020
/
Published: 30 December 2020
(This article belongs to the Special Issue Soil Properties, Quality Monitoring and Restoration in Forest Ecosystems)
Abstract
:Background and objectives: aggregation and structure play key roles in the water-holding capacity and stability of soils and are important for the physical protection and storage of soil carbon (C). Forest soils are an important sink of ecosystem C, though the capacity to store C may be disrupted by the elevated atmospheric deposition of nitrogen (N) and sulfur (S) compounds by dispersion of soil aggregates via acidification or altered microbial activity. Furthermore, dominant tree species and the lability of litter they produce can influence aggregation processes. Materials and methods: we measured water-stable aggregate size distribution and aggregate-associated organic matter (OM) content in soils from two watersheds and beneath four hardwood species at the USDA Forest Service Fernow Experimental Forest in West Virginia, USA, where one watershed has received (NH4)2SO4 fertilizer since 1989 and one is a reference/control of similar stand age. Bulk soil OM, pH, and permanganate oxidizable carbon (POXC) were also measured. Research highlights: fertilized soil exhibited decreased macro-aggregate formation and a greater proportion of smaller micro-aggregates or unassociated clay minerals, particularly in the B-horizon. This shift in aggregation to soil more dominated by the smallest (<53 µm) fraction is associated with both acidification (soil pH) and increased microbially processed C (POXC) in fertilized soil. Intra-aggregate OM was also depleted in the fertilized soil (52% less OM in the 53–2000 µm fractions), most strongly in subsurface B-horizon soil. We also document that tree species can influence soil aggregation, as soil beneath species with more labile litter contained more OM in the micro-aggregate size class (<250 µm), especially in the fertilized watershed, while species with more recalcitrant litter promoted more OM in the macro-aggregate size classes (500–2000 µm) in the reference watershed. Conclusions: long-term fertilization, and likely historic atmospheric deposition, of forest soils has weakened macro-aggregation formation, with implications for soil stability, hydrology, and storage of belowground C.

1. Introduction
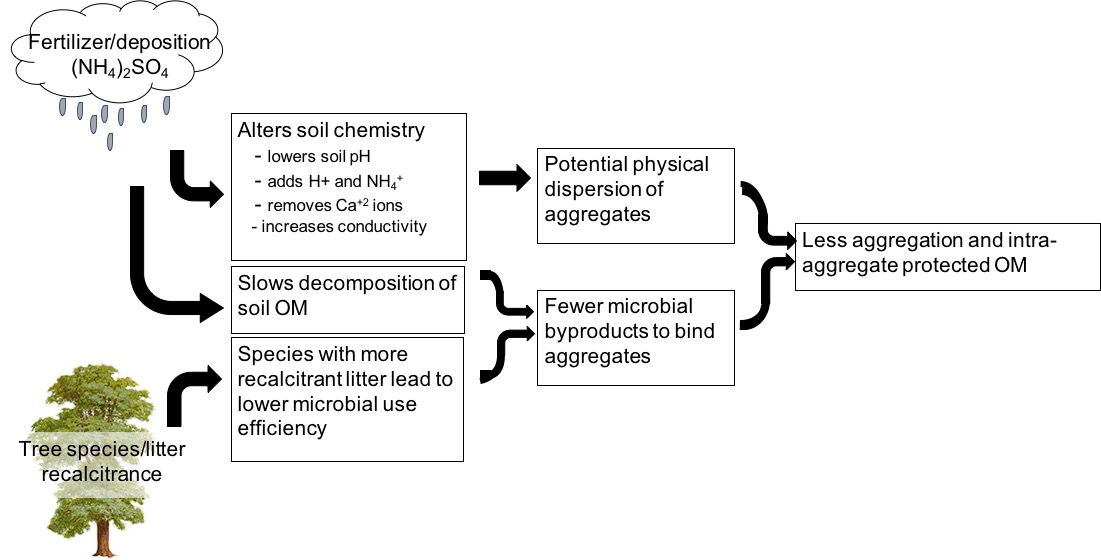
Changes in soil aggregation over time may be an important indicator of soil health. The process of aggregation results in consolidation of soil particles into peds and increased pore size variability. With a wide variety of pore sizes (micro- and macropores), air and water exchange are more quickly facilitated and plant roots more easily penetrate through the soil profile. Additionally, pore size variability regulates and restricts soil organism movement as well as the water needed for biological function [1]. Martin et al. [2] described three aggregate-forming processes: (1) bacteria and fungi binding particles together; (2) gelatinous organic materials holding particles together; (3) clay particles cohering either due to organo-mineral interactions or flocculation around iron and aluminum oxides and entrapping larger particles. All three of these processes and their interplay determine the distribution of macro- vs. micro-aggregates in soil. These processes have been well-studied more recently to define macro-aggregates (>250 μm) as being made up of a conglomeration of smaller micro-aggregates (<250 μm) as well as particulate organic matter (OM), fungal hyphae, organic binding agents, and pore space [3,4,5,6]. The process of aggregation can also result in positive feedback, with mycorrhizal and other fungi able to grow in macro-aggregate pore spaces [7]. In contrast, micro-aggregates provide habitat space for up to 70% of soil bacterial species [8,9]. Within aggregates, especially micro-aggregates, soil carbon (C) is also physically protected from bacterial decomposition through strong organo-mineral interactions with polyvalent cations [4,10,11], rendering what is referred to as stabilized soil organic C (SOC). This protected C is especially important for C sequestration, as the strength of aggregation and the stability of aggregate-associated SOC determines the efficacy of the soil as a C sink [12]. Differing factors, including biological influences, soil parent material, degree of weathering and clay minerology, and soil acidity and ionic composition can all affect aggregation of soil particles.
The clay minerology of soil, specifically the proportion of 2:1 clays (such as montmorillonite or vermiculite) relative to the proportion of 1:1 clays (kaolinite or serpentine), controls aggregation. In systems with limited C inputs, 1:1 clays tend to form more stable macro-aggregates, while in systems with more C input, 2:1 clays tend to form more stable macro-aggregates [13]. This is due to the negative charges of organic matter (OM) and clay particles being concurrently bound to charged cations, while 1:1 clays can have both positive and negative charges and are more readily mineral-bound [14]. 2:1 clays have greater specific surface area and cation exchange capacity (CEC), leading to stronger aggregation forces at mineral surfaces [15], while 1:1 clays have relatively lower CEC values and less aggregation capacity. Finally, 2:1 clays also have a permanent surface charge (usually net negative) that is not influenced by soil pH conditions, while 1:1 clays have a pH-dependent net surface charge [13]. In acidic soils, soils made up of predominantly 1:1 clays are expected to exhibit less aggregation capacity than would occur in higher pH soil due to changes in surface charge capacity, whereas 2:1 clays likely would not exhibit changes in aggregate formation as a function of acidification [14].
1.1. Tree Species Influence on Aggregation
Soil aggregation may be altered by biological influences such as soil microbial biomass and activity as well as characteristics of tree species. Disparities in the mineral association of soil C between arbuscular mycorrhizae (AM)-associated species and ectomycorrhizal mycorrhizae (ECM)-associated species have been demonstrated due to differences in litter composition and lability as well as differences in the soil microbial community [16,17,18,19]. ECM-associated species tend to have “closed” nutrient cycles, in which leaf litter is made up of relatively recalcitrant and high C:nitrogen (N) ratio materials, resulting in ECM fungi “mining” nutrients (especially N) directly from organic materials via enzyme secretion [20]. AM-associated species tend to have “open” nutrient cycles, in which leaf litter is comparatively labile and more available for microbial decomposition and the AM fungus takes up inorganic N after it has been microbially processed [16].
AM fungi have previously been shown to be positively correlated to soil aggregate development [21,22] through abundant hyphal biomass and secretion of glomalin-related soil protein (GRSP), though the extent of influence may depend upon both fungal and plant species [23]. As described by Six et al. [6], bacterial decomposition products aid mostly in the formation of micro-aggregates while fungi aid in the formation of macro-aggregates due to the “sticky string bag” formed by hyphae [24]. Following the concept of the Microbial Efficiency Matrix Stabilization (MEMS) framework [17], labile plant litter associated with AM tree species promotes more rapid microbial activity and a greater amount of microbial products, which may create more organo-mineral interactions and greater aggregate formation [25,26]. With both of these concepts, we expect that there is enhanced microbial activity in areas influenced by AM-associated tree species and, as a result, more C protection and storage in the smaller size class of soil aggregates. However, in forested ecosystems that have received decades of elevated atmospheric deposition of nitrogen and sulfur compounds [27], these expected C and aggregate dynamics may be disrupted [28].
1.2. Acidity and Ionic Composition Influence on Aggregation
In ecosystems experiencing elevated N deposition, soil microbial communities and activity are altered [29,30,31,32], resulting in decreased enzymatic activity and decomposition rates and increased soil C [30,33]. While more microbially processed OM can facilitate soil aggregation, acidification processes (e.g., oxidation via nitrification and leaching of base cations such as Ca2+) due to elevated atmospheric deposition of N may result in decreased aggregation [34], either through inhibition of microbial decomposition processes, changes in pH-dependent charges on mineral surfaces, or dispersion processes associated with particular cations. For example, with accumulation of NH4+ and H+ and increases in electrical conductivity (EC) with deposition, soil aggregation may be reduced due to dispersion of soil colloids [35,36,37] as the relative concentrations of these ions increase, whereas the presence of abundant Ca2+ ions would result in flocculation or creation of aggregates [38,39].
West Virginia and the Central Appalachian region in eastern US have historically experienced high levels of atmospheric N deposition in the country. The decline in N deposition across the region resulting from policies stemming from the Clean Air Act [40] raises questions relating to ecosystem recovery, particularly the fate of C that has accumulated in soil as a result of acidification processes [31,33]. If the accumulated soil C does not reside in protected aggregates—the result of acidification processes that decrease microbial decomposition—recovery from historic deposition levels may result in rapid decomposition as microbial process rates resume. This poses risks at the ecosystem level (loss of soil C, soil structure, and the resultant trophic effects on the ecosystem as a whole) as well as at the global biome level (C emissions).
Here, we investigate the role of long-term fertilization and tree species in soil aggregation in two experimental watersheds at the US Forest Service Fernow Experimental Forest (FEF). The main objectives for this study were to compare size class distribution of water-stable soil aggregates and OM distribution throughout aggregate size classes in soils from a watershed receiving long-term elevated deposition of ammonium sulfate (NH4)2SO4 and a reference watershed. Specifically, we aimed (1) to determine if experimental fertilization and documented acidification affects soil aggregation and OM distribution throughout the aggregate size fractions; (2) to determine if selected tree species differentially influence soil aggregation capacity and OM distribution throughout the aggregate size fractions; and (3) to determine if the effect that acidification has on soil aggregation dynamics depends upon the tree species influencing the soil. To address these objectives, we tested the following hypotheses: (1) fertilization negatively affects soil aggregate weight and intra-aggregate OM content; (2) AM-associated tree species, or those with relatively easily degradable litter, promote greater aggregate weight and intra-aggregate OM content, particularly in the micro-aggregate size classes, than ECM-associated species; and (3) aggregates in soil influenced by AM tree species will be more sensitive to acidification than those influenced by ECM tree species because aggregates are formed by microbial by-products of decomposition.
2. Materials and Methods
2.1. Site Description
This study utilized two gaged watersheds within the USDA Forest Service FEF near Parsons, West Virginia, USA. The 1900-ha FEF was established in 1934 within the Monongahela National Forest. Annual precipitation is relatively evenly distributed per annum and averages 1458 mm [41]. Average monthly precipitation peaks in June (144 mm) and typically reaches its lowest value in October (97 mm). Average yearly temperature is 9.2 °C, with an average monthly maximum in July (20.6 °C) and minimum in January (−2.8 °C) [41].
The hardwood reference watershed (WS7-REF; 24 ha; elevation range 730–860 m) was clearcut logged in sections, beginning in 1964 and continuing to 1967; it was then maintained barren with herbicides until 1969 and, since, has been allowed to regrow naturally. WS7-REF has hillslopes with north/south aspects along the stream. Soils in this watershed are dominantly Calvin (Calvin channery silt loam), with small ridgeline areas of Dekalb series (Dekalb channery loam and Dekalb extremely stony loam; Dekalb loamy-skeletal, siliceous, active, mesic typic Dystrudept), derived from acidic sandstone parent material [42]. Dominant vegetation in WS7-REF is tulip poplar (Liriodendron tulipifera Linnaeus), Northern red oak (Quercus rubra Linnaeus), and sugar maple (Acer saccharum Marshall), with an understory of dogwood (Cornus florida Linnaeus), striped maple (Acer pensylvanicum Linnaeus), cucumber magnolia (Magnolia acuminata Linnaeus), and several species of fern. From the most recent 2018 survey, basal area in this watershed was approximately 13.5 m2 ha−1.
The hardwood watershed that receives fertilizer application (WS3 -FERT; 34.3 ha, elevation range 735–860 m) was clearcut between July 1969 and May 1970, excluding a 2.99 ha buffer strip along the stream channel, where a light selection cut was made. In 1972, the buffer strip was clearcut and all debris in or near the channel was removed. Soils in this watershed are Calvin channery silt loams (loamy-skeletal, mixed, mesic typic Dystrudept, derived from acidic sandstone and Hampshire formation shale parent material [43]). The predominant clays of the FEF have been cursorily described as muscovite (2:1) and vermiculite (2:1) [44]. The watershed receives 35 kg N ha−1 yr−1 in the form of (NH4)2SO4 as aerial deposition three times a year via helicopter. Fertilizer applications began in 1989, when standing trees were approximately 19 years old. Dominant vegetation in WS3-FERT is black cherry (Prunus serotina Ehrhart), red maple (Acer rubrum Linnaeus), black birch (Betula lenta Linnaeus), and American beech (Fagus grandifolia Ehrhart) [45], with an understory of striped maple, red maple, and increasing abundance of Rubus species. Basal area in this watershed is approximately 17.5 m2 ha−1.
2.2. Soil Sample Collection
To investigate how tree species influences aggregation size distribution and associated OM distribution, four live individuals of each tree species (tulip poplar, Northern red oak, black cherry, and black birch) were selected throughout the watershed, each on a mid-slope section of each watershed and each having a minimum DBH of 16.25 cm. Using each selected tree as a plot-center, we determined the surrounding stand basal area by species using a BAF-10 prism. To further understand how differing mycorrhizal associations may affect aggregation and carbon storage processes, we selected two tree species for investigation as AM-associated species (black cherry and tulip poplar) and two as ECM-associated species (black birch and Northern red oak).
In May and June 2019, soil samples were collected via auger from below each selected tree. Soil samples were taken at each of the four cardinal directions around each tree within the dripline. A-horizon samples were collected between 0–10 cm depth, and B-horizon samples were collected between 10–45 cm depth. B-horizon soil is distinct from A-horizon soil visually by a lighter color, a greater silt content, and a subangular blocky structure [42]. The 45-cm depth sampling generally represents the extent of the B-horizon in these watersheds and has been described as a BW2 horizon [46]. Samples were bulked at each sampling point to produce one mixed sample per location (n = 2 watersheds; n = 4 species; n = 4 individual trees; n = 2 soil horizons; and N = 64 bulk soil samples).
2.3. Water-Stable Aggregate and Organic Matter Analyses
Soil samples were air dried following collection and then sieved to 2 mm. Approximately 100 g of air-dried soil was used for slaking and wet-sieving utilizing an apparatus similar to that described by Yoder [47] and Ekwue et al. [48] and following the methodology of Mikha and Rice [11] and Kelly et al. [49]. This procedure utilizes stacked sieves to separate and recover all particle size fractions greater than 53 μm. Sieve mesh sizes were 2000, 1000, 500, 250, and 53 μm. Particles smaller than 53 μm were considered free micro-aggregates or unassociated clay particles. To slake the soils, samples were slowly submerged within the nested sieves into a 2.5-mM solution of CaCl2, to prevent aggregate dispersion. Yoder (1936) discussed that pure water exerts dispersion forces on soil colloids, and Demolon and Hénin [50] further suggested using a solution of Ca(NO3)2. Due to the intent to measure nitrogenous compounds, CaCl2 was used instead to the same effect. Soils were soaked for 10 min. The machine agitated soils for 10 min at a 4-cm stroke length at 30 rpm. Samples were quantitatively transferred from the sieves into drying tins and placed in a drying oven at 50 °C until fully dried and then were weighed. Subsamples of each size class were dried at 105 °C for 24 h for correction to dry weight.
To express aggregate size fractions on a sand-free weight basis, subsamples (2–5 g) of each aggregate size class were weighed and 10–25 mL of 5 g L−1 of sodium hexametaphosphate (Na6P6O18) (SHMP) was added as a dispersing agent. Samples were left overnight, shaken for 4 h on an orbital shaker, then passed through a 53-µm sieve, washed with deionized water, and dried at 105 °C for 24 h. All aggregate weights are presented as sand-free corrected weights.
To determine soil pH, 5.0 ± 0.10 g of air-dried soil was placed in 10 mL 0.01 M CaCl2, shaken, and allowed to settle for 1 h before reading by a pH electrode (GENERAL digital, Taiwan). To determine OM content, subsamples (0.5–10 g) of dried soil were weighed in aluminum tins and placed into a muffle furnace at 550 °C for 8 h. Upon removal, samples were allowed to cool and then weighed to determine the percent loss of mass due to ignition of OM [51].
As an estimate of soil microbial activity and the active pool of soil C, we measured permanganate oxidizable carbon (POXC) [52]; 5.0 ± 0.10 g of dried soil was mixed with 2 mL of 0.2 M KMnO4 solution and 18 mL H2O, then placed on an orbital shaker for 2 min, and allowed to settle for 10 min before 0.5 mL of the supernatant was diluted to 50 mL with deionized water. An aliquot (100 μL) was pipetted into a clear 96-well plate, along with a duplicate set of standards prepared from KMnO4 stock solution and deionized water control and read at 550 nm using a Synergy HTX plate reader (Biotek, Winooski, VT, USA).
Clay mineralogy within watersheds was examined by X-ray diffraction (XRD) analyses. Soil samples from two locations across two watersheds and horizons were composited such that we analyzed one A-horizon and one B-horizon sample for each watershed (n = 6). Composited samples were pretreated with 30% hydrogen peroxide to remove organic matter, sieved to 250 µm, and then air dried. Clay mineralogy was analyzed using a PANalytical X’Pert Pro X-ray Diffractometer (XRD) at the Shared Research Facility at West Virginia University.
2.4. Data Analysis
Differences in aggregate weight, aggregate OM content, soil pH, and POXC attributed to fertilization or tree species were analyzed using nonparametric tests due to a lack of normality of all variables. When comparing two distinct groups (watershed comparison), the Wilcoxon two-sample test was applied using a normal approximation. When more than two groups were compared (tree species comparison), a pairwise Wilcoxon two-sample test was applied using a normal approximation followed by Kruskall–Wallis test to compare the effect of tree species within a watershed. For simplicity of interpretation, the data presented are calculated means and standard errors. All data were analyzed using SAS-JMP Statistical Software (Version 14.0, Cary, NC, USA) and a significance level of α = 0.05. The statistical design of this study is an example of simple pseudo-replication, a common characteristic of ecosystem studies at the watershed scale [53]; thus, our data should be interpreted with that in mind and may not be applicable to other locations. It is a reasonable contention, however, that the effects reported here are treatment effects rather than preexisting differences among watersheds as Adams and Angradi [54] showed that soil conditions were similar before fertilization treatment began.
3. Results
3.1. Clay Mineralogy
XRD analysis from soil samples across three watersheds and two soil horizons exhibited a similar mixed clay mineralogy, with the presence of both 1:1 and 2:1 clays. The results suggest the presence of chlorite (a weathered form of muscovite and vermiculite, which are 2:1 clays; with XRD reflection 6.2 2-θ), kaolinite (a 1:1 clay; 12.5 2-θ), and illite (a 2:1 clay; 8.9 2-θ).
3.2. Bulk Soil OM, pH, and POXC by Watershed and Species
Differences in bulk soil OM were evident between watersheds in the B-horizon but not in the A-horizon (Table 1). In the B-horizon, WS7-REF had greater mean bulk OM than WS3-FERT (p = 0.004). Within WS3-FERT, bulk soil OM also varied by tree species in the B-horizon but not in the A-horizon (Table 1). Bulk soil OM did not vary significantly by species in either the A- or B-horizons in WS7-REF. In WS3-FERT, B-horizon, the mean OM beneath black cherry was significantly greater than that beneath red oak and tulip poplar (p = 0.030 for both) but was not significantly different from black birch. In both watersheds and in both horizons, bulk soil OM did not significantly differ between the AM- and ECM-associated species here, though there was a trend that AM-associated species had more bulk soil OM than ECM-associated species in WS3-FERT, B-horizon (p = 0.066) (tulip poplar and black cherry are AM-associated species, and black birch and northern red oak are ECM-associated species).
Soil pH differed by watershed in the A-horizon but not in the B-horizon (Table 1). In WS3-FERT, A-horizon, soil pH was 3.57 and 3.97 in WS7-REF (p = 0.005). In WS7-REF, A-horizon, soil pH beneath tulip poplar was greater than all other species in pairwise comparisons (p = 0.030; 0.029; and 0.030, respectively). There were no statistically significant differences in soil pH among species in WS7-REF, B-horizon, or in either horizon in WS3-FERT. Soil beneath AM-associated species exhibited a significantly lower pH in WS3-FERT relative to WS7-REF in both the A- and B-horizons, while soil pH beneath ECM-associated species did not differ significantly between watersheds. In the A-horizon, soil beneath AM-associated species had pH of 3.51 in WS3-FERT and of 4.21 in WS7-REF (p = 0.003), and in the B-horizon, pH of 4.02 in WS3-FERT and of 4.3 in WS7-REF (p = 0.031).
Mean POXC values did not differ statistically between watersheds in either the A- or B-horizons, (p = 0.080 and 0.169, respectively), though there is a trend that POXC is greater in WS3-FERT (mean: 311 g kg−1 soil) than in WS7-REF (mean: 217 g kg−1 soil) in the A-horizon (Table 1). No significant differences occurred in POXC as a function of tree species or fungal association type.
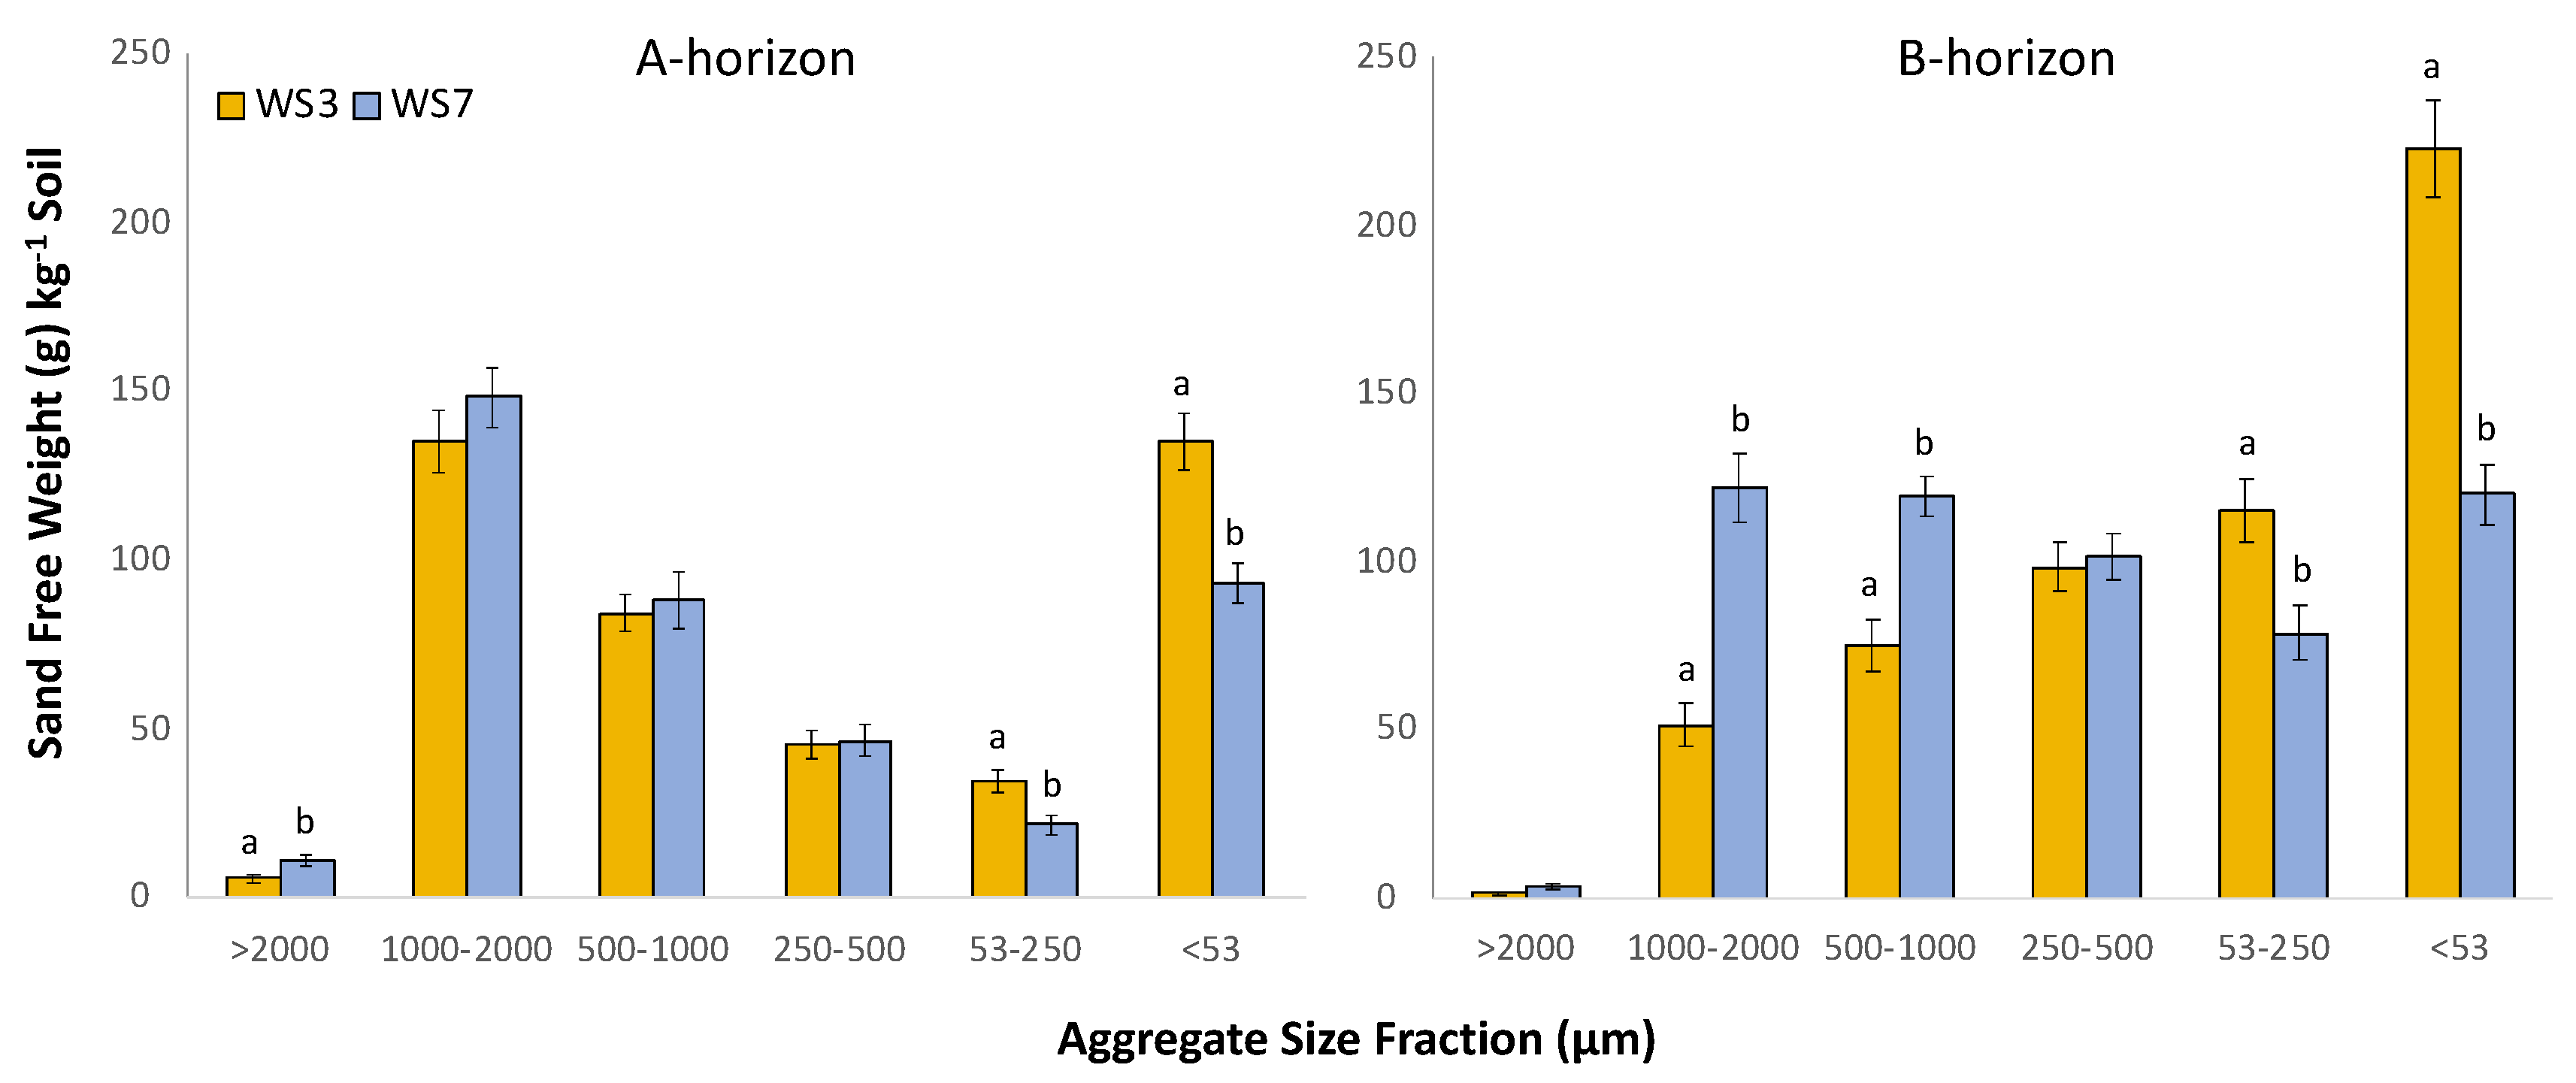
3.3. Total Sand-Free Aggregate Weight
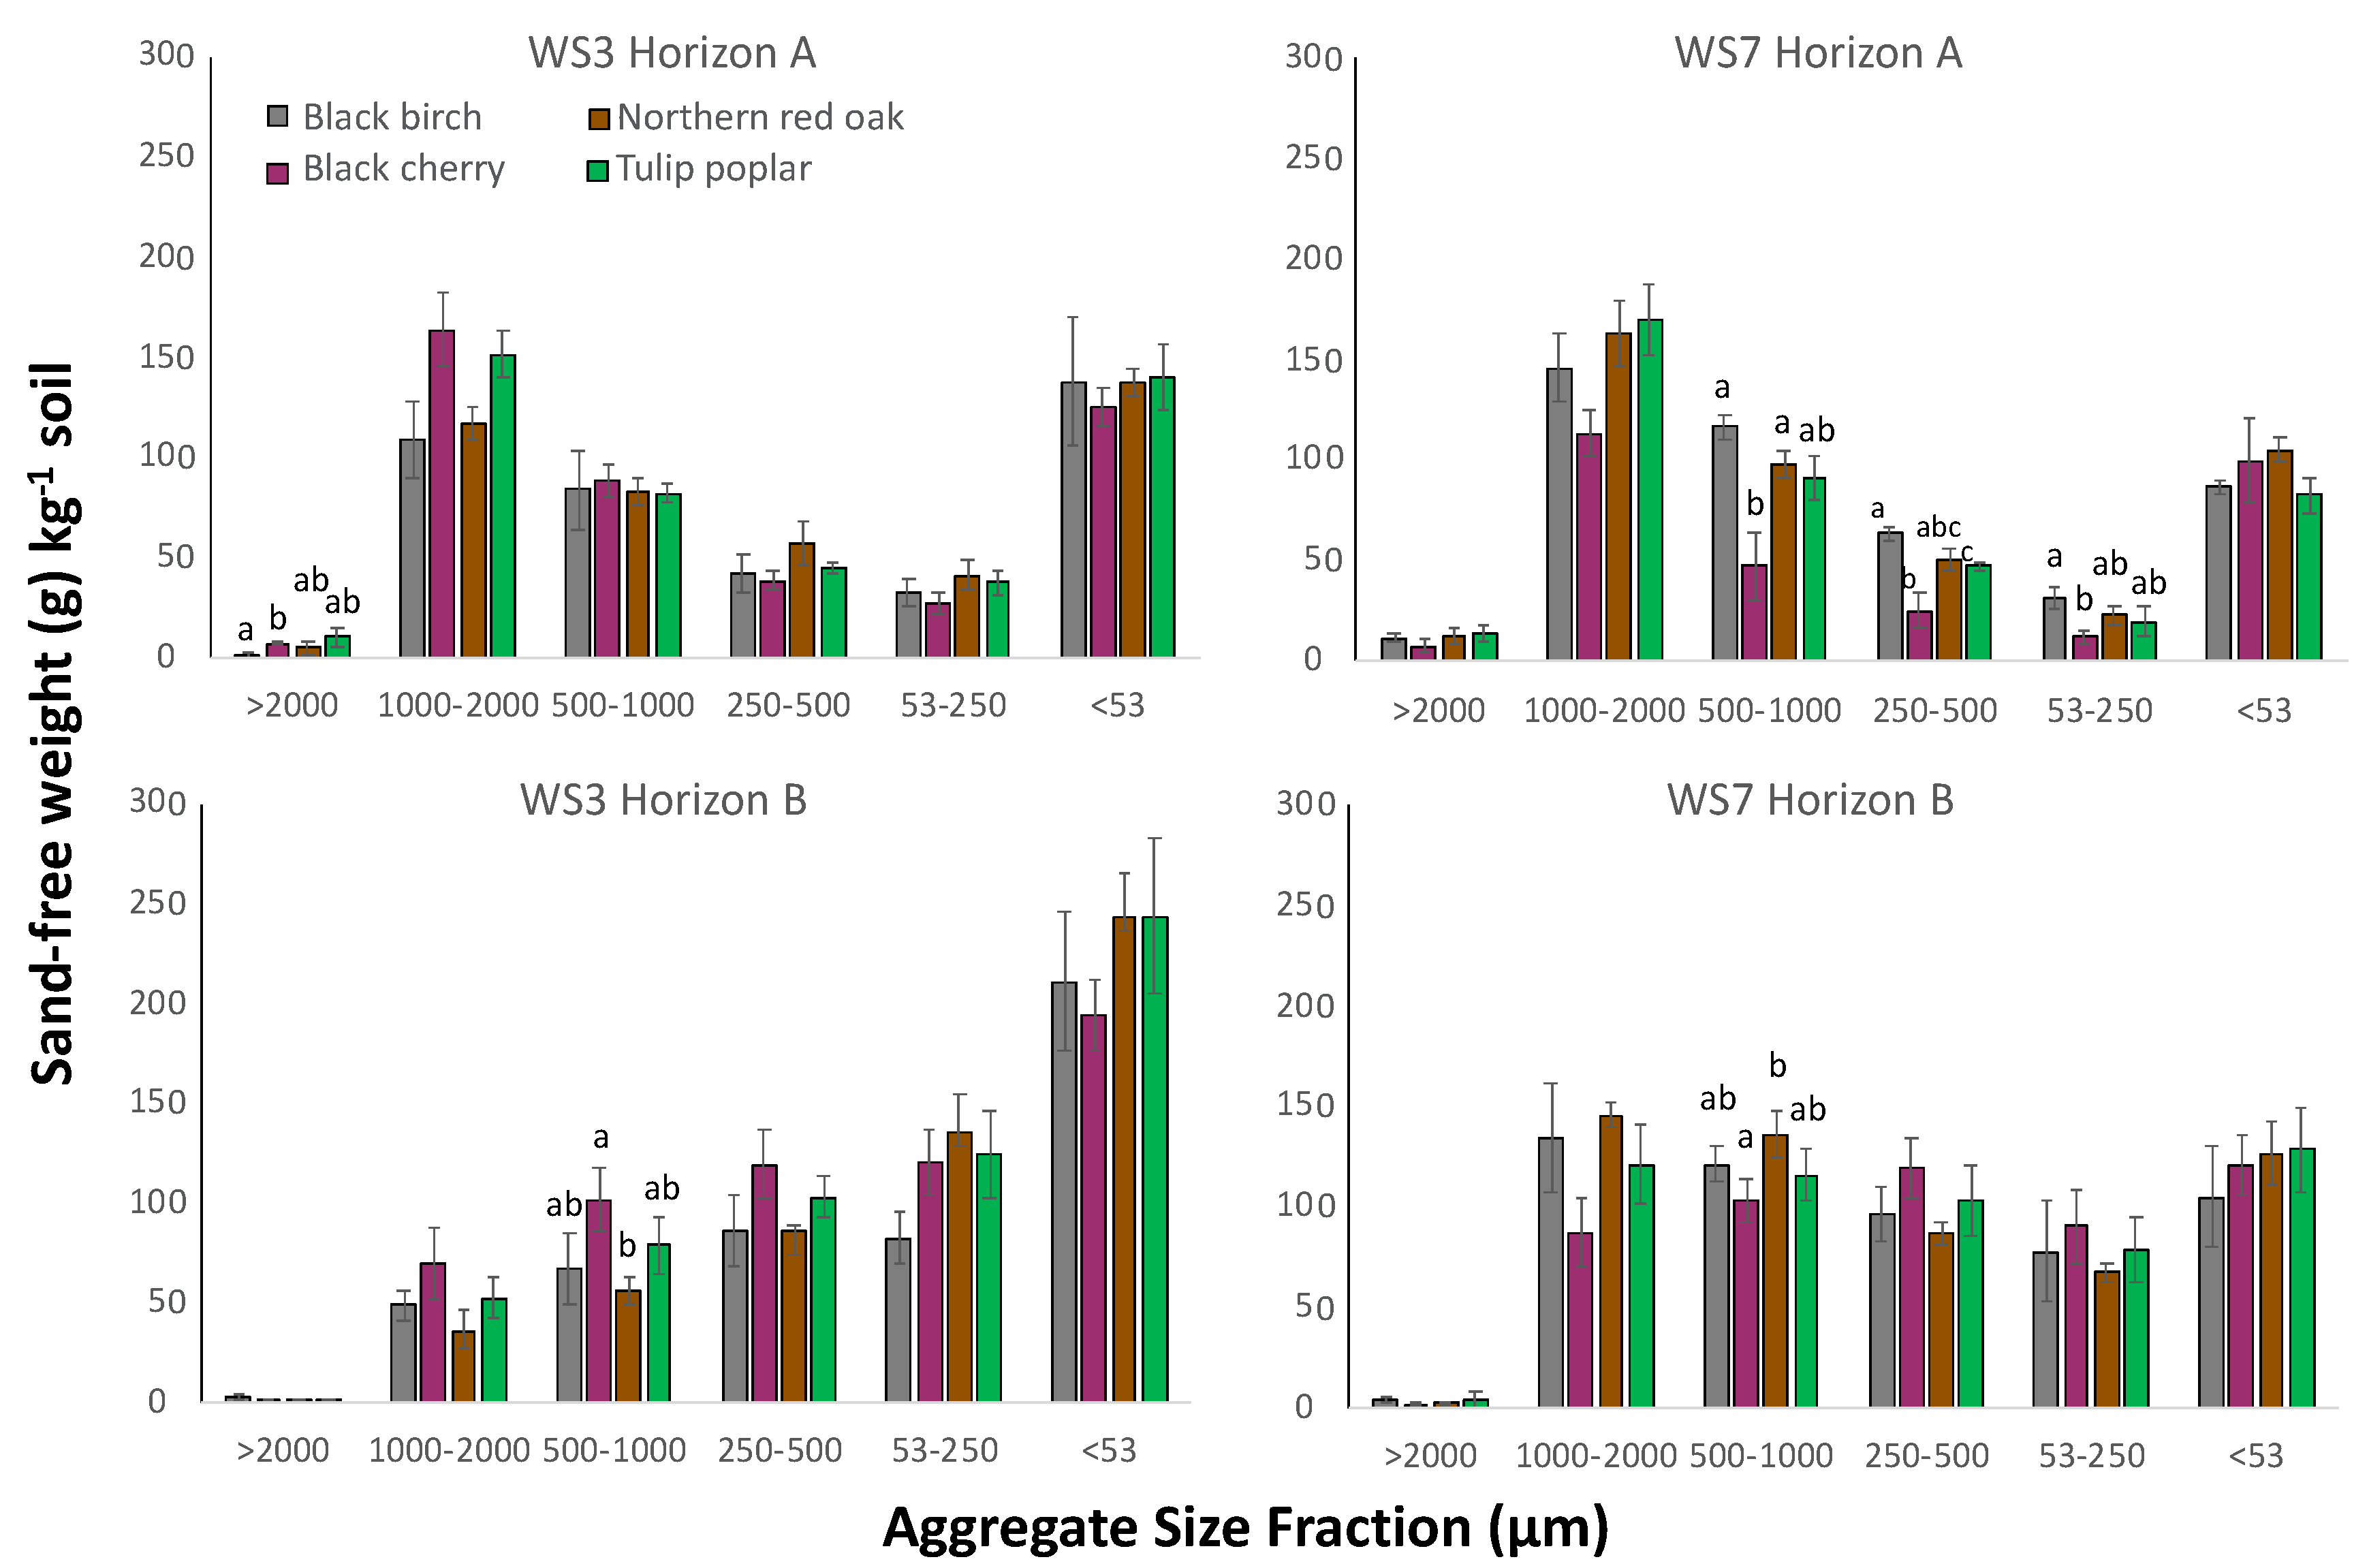
Total aggregate sand-free weight (contained within aggregates between 53 and 2000 µm) differed between watersheds, and greater total aggregate sand-free weight occurred in WS7-REF in the B-horizon (p = 0.005) relative to WS3-FERT, though no differences occurred in total aggregate weight between watersheds in the A-horizon (Figure 1). When analyzed by size fraction, aggregate sand-free weight differed between watersheds and horizons. Consistently, in both the A- and B-horizons, WS3-FERT soil contained greater aggregate sand-free weight in both the 53–250 and <53 µm size classes relative to WS7-REF (A-horizon p = 0.014 and <0.001, respectively; B-horizon p = 0.007 and <0.001, respectively) (Figure 1). Comparing among tree species, in both WS3-FERT and WS7-REF, soil beneath differing tree species varied in sand-free weight across aggregate size classes (Figure 2). In WS7-REF, A-horizon, significant differences among tree species occurred in the 500–1000, 250–500, and 53–250 µm size fractions and in the 500–1000 µm fraction in the B-horizon. Variation by tree species on aggregate weight in WS3-FERT occurred only in >2000 µm in the A-horizon and in 500–1000 in the B-horizon (Figure 2).
3.4. Aggregate-Associated Organic Matter
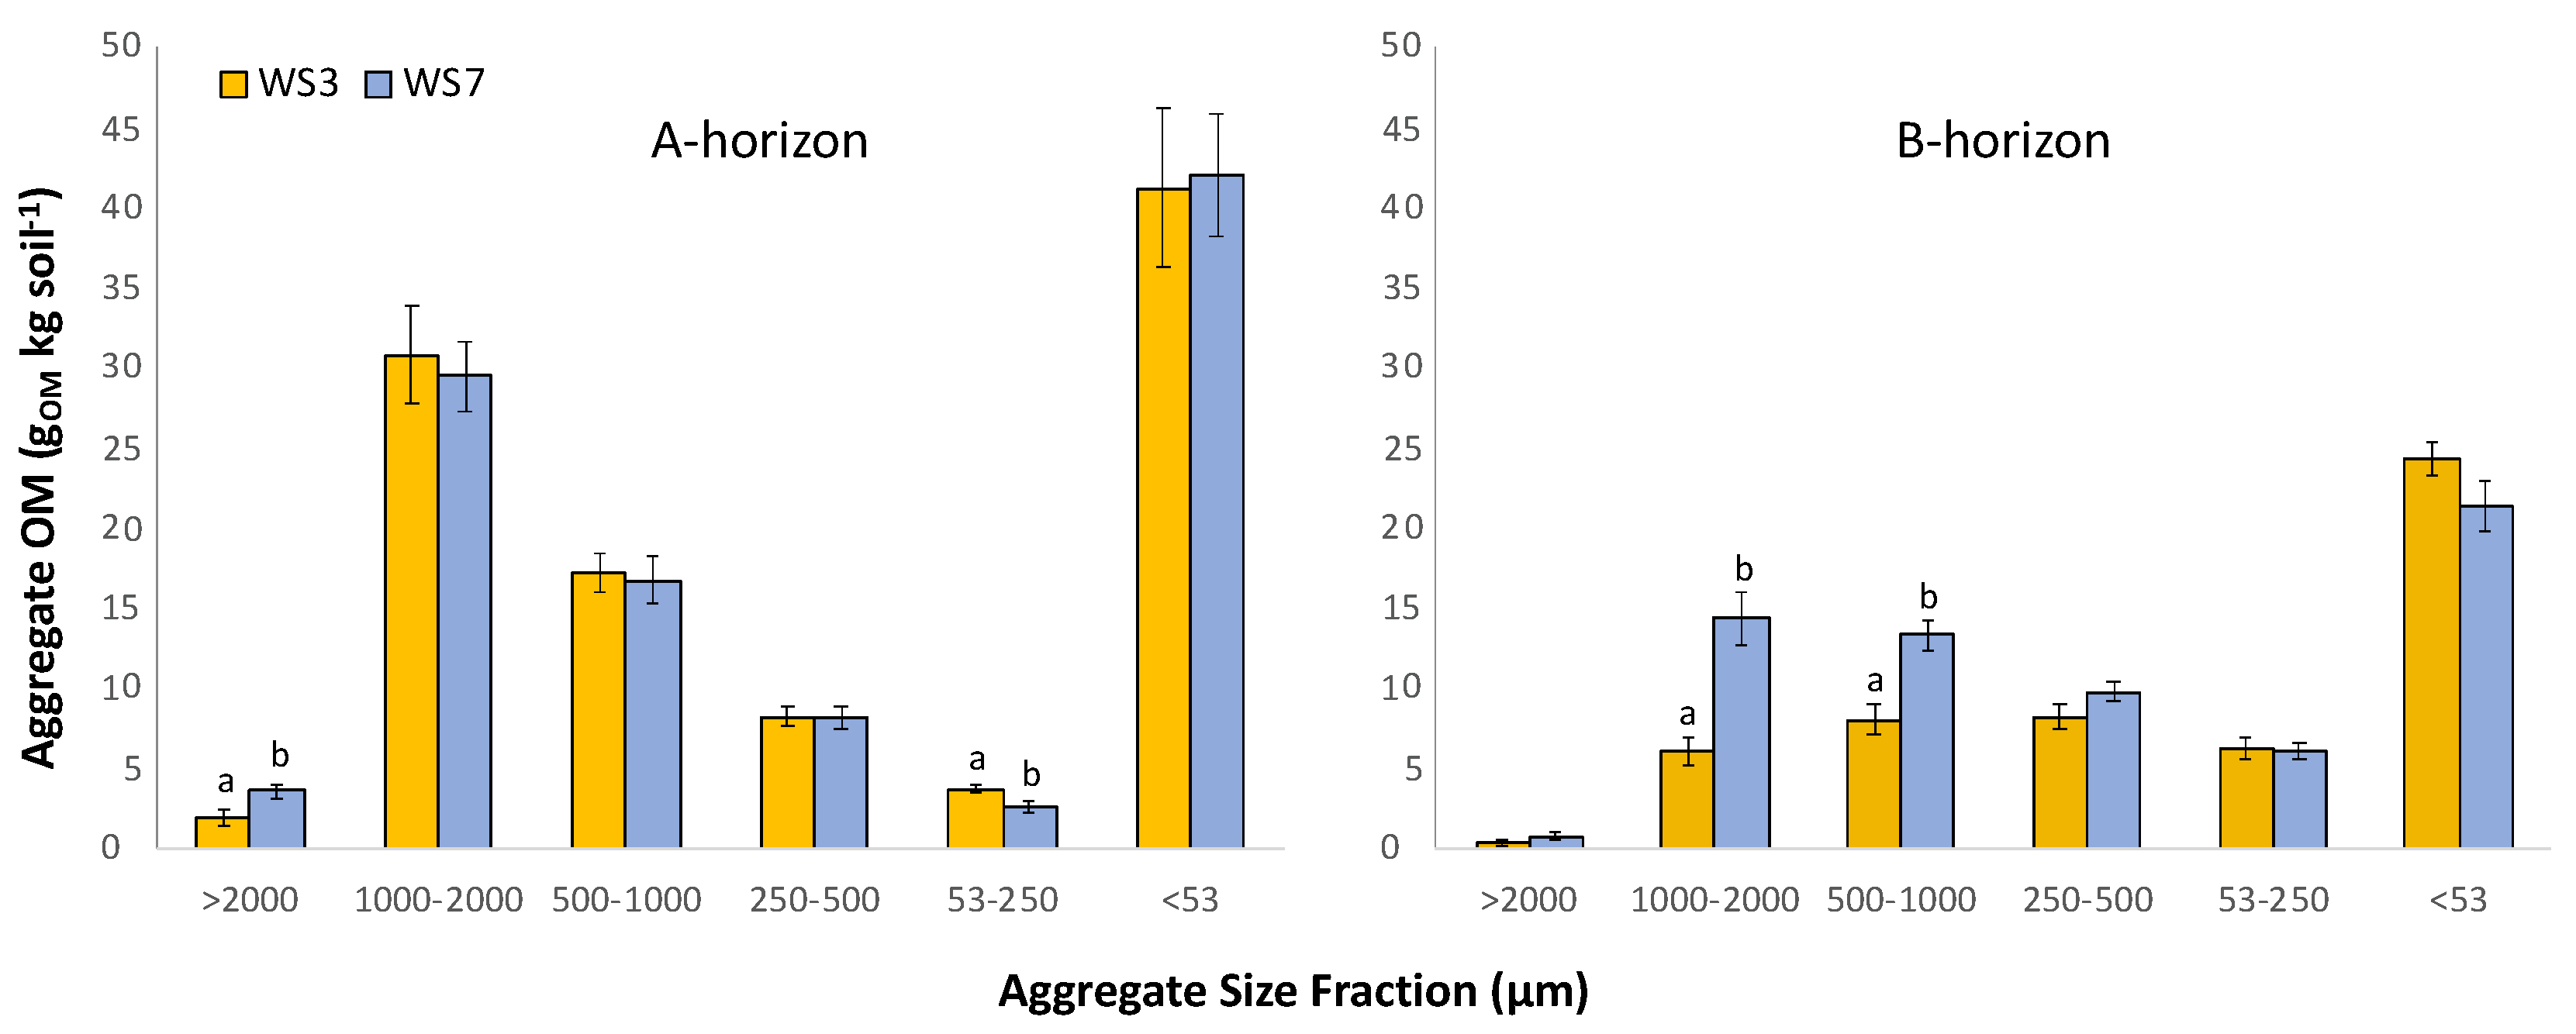
Total aggregate OM (contained within aggregates between 53 and 2000 µm) differed between watersheds only in the B-horizon, where 52% more aggregate-associated OM occurred in soil from WS7-REF relative to WS3-FERT (p = 0.001). However, total intra-aggregate OM content was similar in the A-horizon between watersheds. Specific to aggregate size class, aggregate-associated OM differed between watersheds in the >2000 µm and the 53–250 µm classes in the A-horizon and in the 1000–2000 µm and 500–1000 µm classes in the B-horizon (Figure 3). In the A-horizon, soil from WS3-FERT had 42% more OM in the 53–250 µm size class (p = 0.011) than soil from WS7-REF.
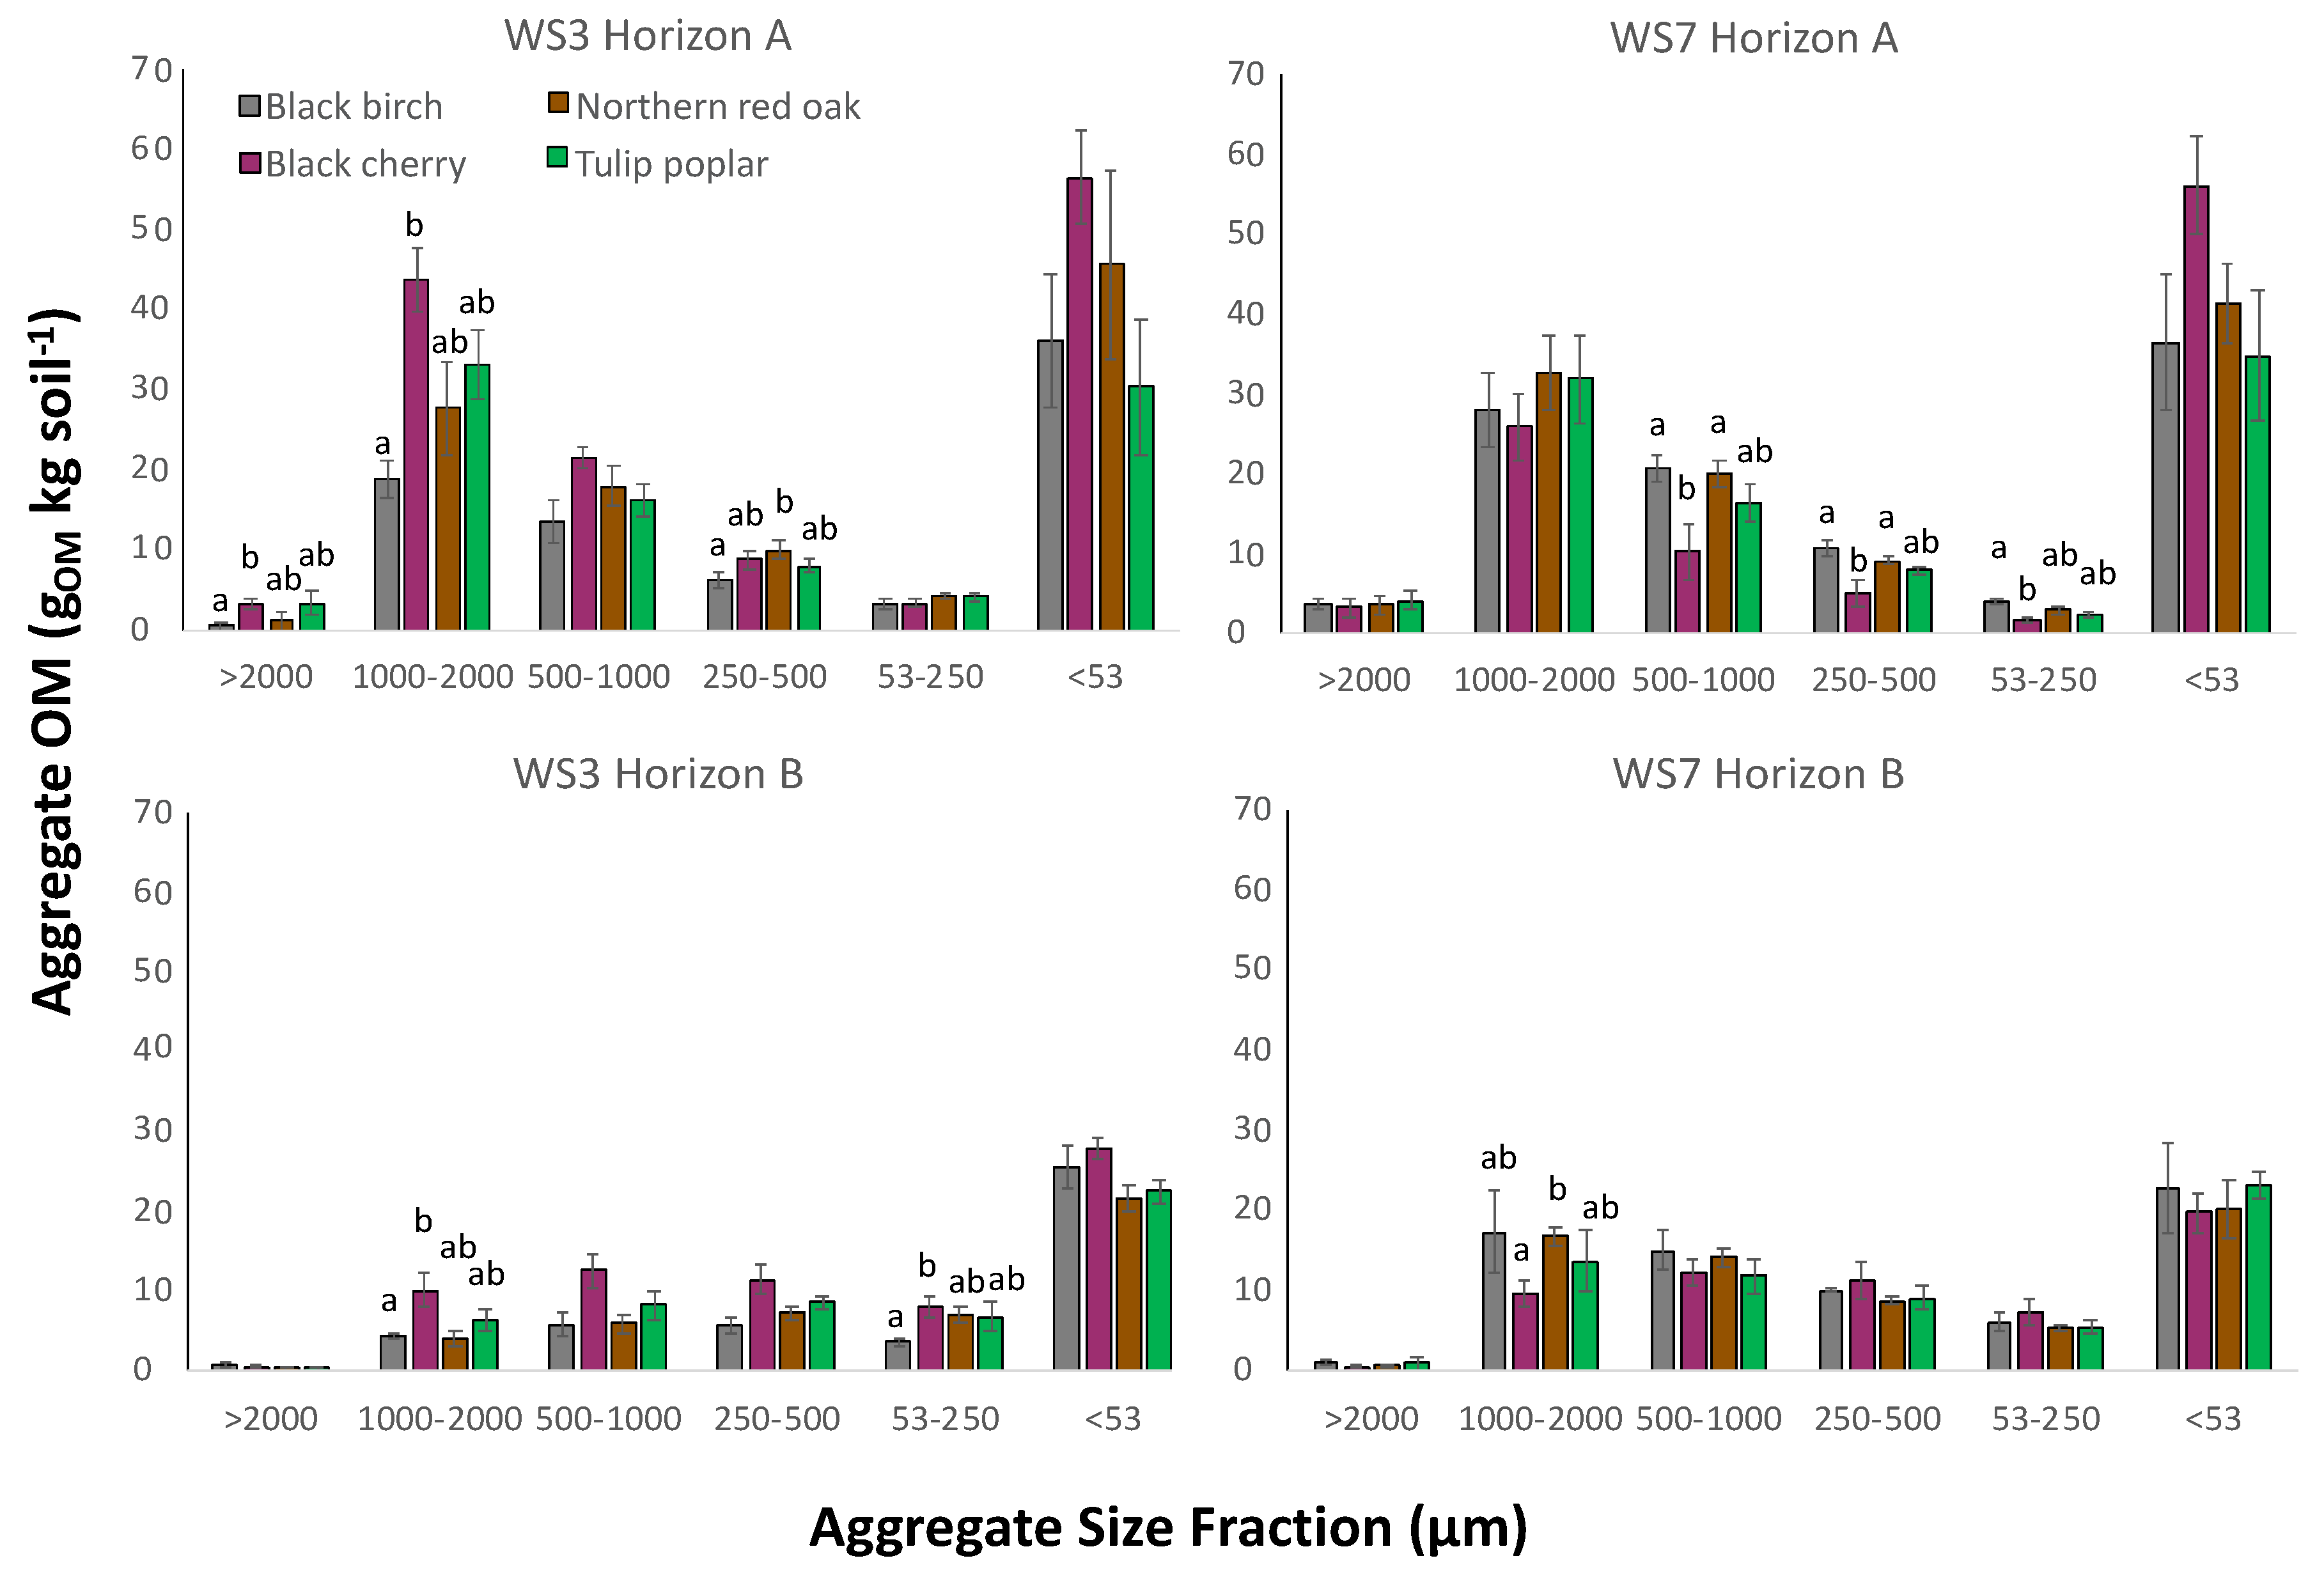
Within aggregate size classes, OM varied by tree species within watersheds and the influence of species on aggregate-associated OM was not consistent between watersheds (Figure 4). Most often, significant differences within a watershed among species were detected in the A-horizon between black cherry and the other species—this difference of black cherry relative to other species occurred in both watersheds, though the effect was reversed between the two watersheds. In WS7-REF A-horizon, in each of the 500–1000, 250–500, and <53 µm size fractions, soil aggregates beneath black cherry contained significantly less OM than soil aggregates beneath black birch and red oak. However, in WS3-FERT B-horizon, in the 1000–2000 and 53–250 µm size fractions, the soil beneath black cherry contained more aggregate OM than soil beneath black birch (p = 0.030), though other comparisons were not significantly different.
The influence of watershed on aggregate-associated OM varied by tree species (Table A1). For example, in soil beneath red oak in the A-horizon, WS3-FERT soil contained more OM in the 53–250 µm size fraction relative to WS7-REF (p = 0.030) and soil beneath black cherry in WS3-FERT contained more aggregate OM in the 1000–2000 and 500–1000 µm size class relative to WS7-REF (p = 0.030). In contrast, soil beneath tulip poplar exhibited similar aggregate OM content between WS3-FERT and WS7-REF in every size class (Figure 4).
3.5. Relationship between Micro-Aggregate Proportion and pH or POXC
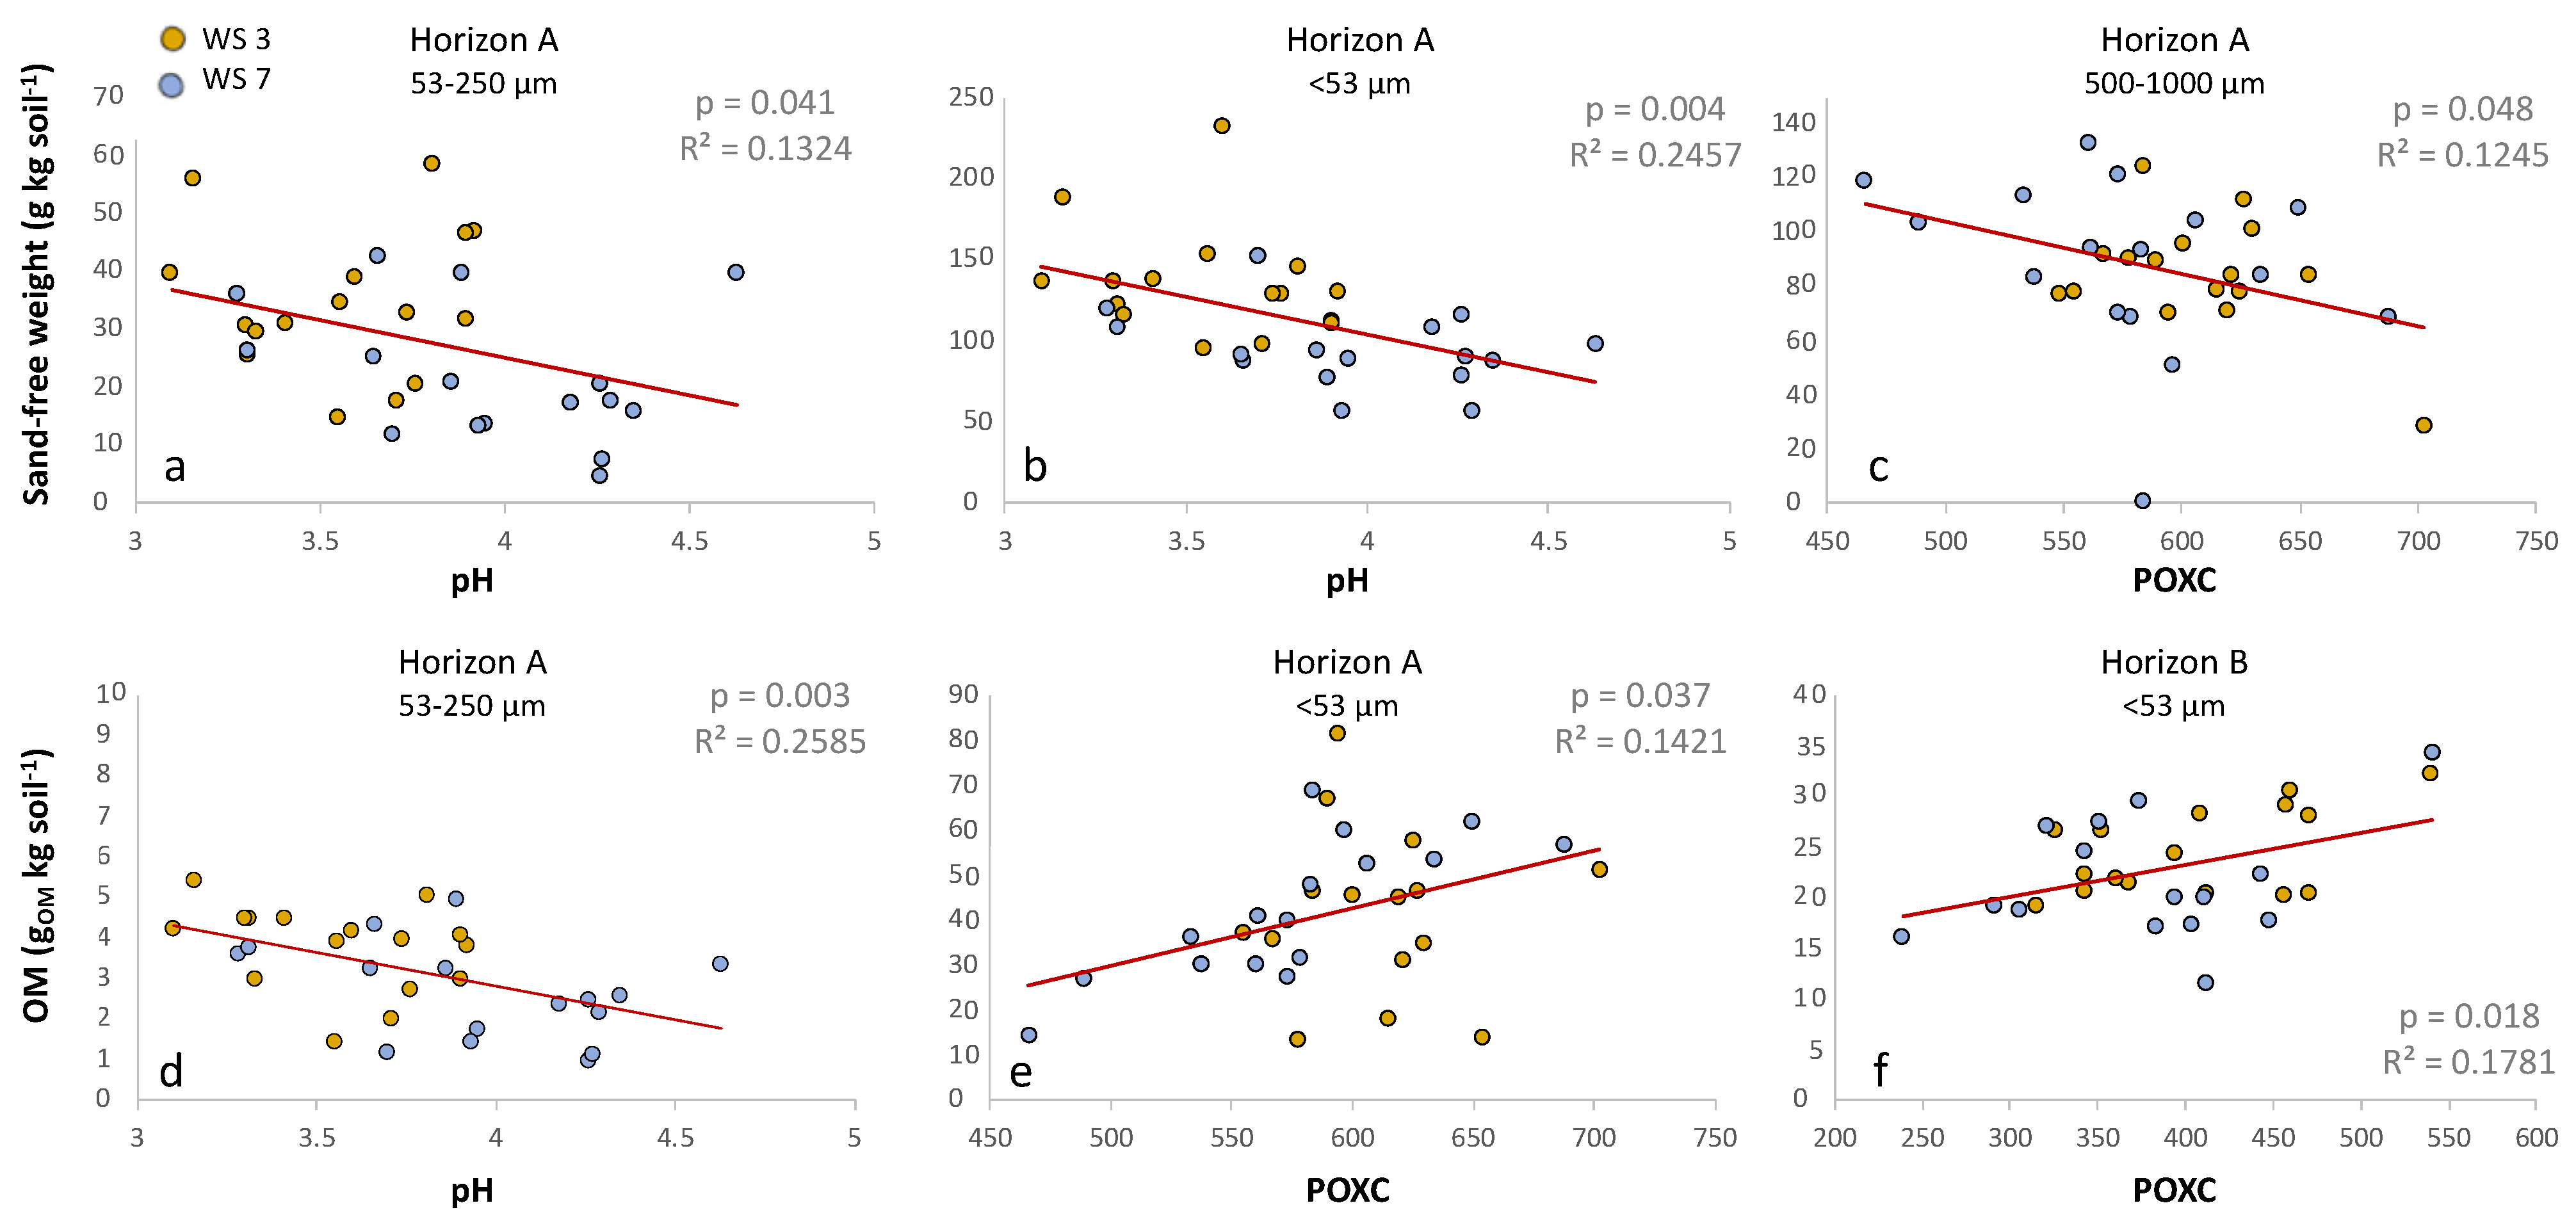
Generally, lower soil pH was associated with both greater sand-free aggregate weight and OM content in micro-aggregate fractions (<53 and 53–250 µm) (Figure 5). In the A-horizon, in both the <53 and the 53–250 µm size classes, higher soil pH is associated with lower sand-free weight (p = 0.004, R2 = 0.25 and p = 0.041, R2 = 0.13, respectively) and the 53–250 µm size class exhibits lower aggregate-associated OM at higher soil pH (p = 0.003, R2 = 0.26). It should be noted that all soils sampled in this study had a pH of 3.5–4.5, classified as extremely acid (Soil Science Division Staff 2017).
Greater POXC values are associated with both greater sand-free aggregate weight and OM content in the <53 µm fraction (Figure 5). In both the A- and B-horizons across watersheds, within the <53 µm size class, greater POXC values are associated with more OM content (p = 0.037, R2 = 0.142—panel e, and p = 0.018, R2 = 0.18—panel f). Higher POXC is also associated with greater sand-free weight in the <53 µm size class (p = 0.037, R2 = 0.14). Relatedly, in the larger 500–1000 µm size class, higher POXC values are associated with lower sand-free weight (p = 0.048, R2 = 0.12).
4. Discussion
This study builds on previous research at the FEF from this whole-watershed fertilization effort that has documented that the fertilized watershed exhibits altered N cycling [55,56,57,58]; slower litter decomposition rates [54]; and altered soil nutrient-acquiring enzyme activity, bacterial community composition, and below-ground allocation of C by vegetation [31] relative to reference watersheds. Here, we further document that fertilization of this forested watershed resulted in altered soil aggregation in soil beneath the four tree species selected here. Soil in the fertilized watershed exhibits less macro-aggregate formation and a greater proportion of smaller micro-aggregates or unassociated clay minerals, particularly in B-horizon soil. This shift in aggregation size distribution to soil more dominated by the smallest <53 µm fraction is associated with both acidification (soil pH) and increased microbially-processed C (oxidizable C) in fertilized soil. Macro-aggregate-associated OM was also reduced in the fertilized soil, most strongly in the B-horizon soil, suggesting less physical protection of C in forest soil receiving elevated deposition of N and S compounds. We contend that soil aggregation and aggregate-associated OM are important ecosystem parameters to monitor in assessment of forest soil quality because they are sensitive to fertilization via atmospheric deposition and are influenced by tree species. Both atmospheric deposition and dominant tree species may be altered as a function of human emissions and a changing climate.
4.1. Bulk Soil OM, pH, and POXC
Bulk soil OM was significantly greater in WS7-REF in the B-horizon relative to the fertilized WS3-FERT, and a similar, not statistically significant pattern occurred in the A-horizon between watersheds (Table 1). The greater OM in WS7-REF soil documented here differs from other studies reporting an increase in soil C following fertilization [59,60,61], which has been attributed to a decline in microbial extracellular enzymatic activity related to OM degradation and lower overall soil respiration [31,33]. Indeed, rates of soil respiration were approximately 13% lower in WS3-FERT relative to WS7-REF, as measured from June 2016 to May 2018 (Eastman and Peterjohn, unpublished data). However, the response of increased bulk soil C following N fertilization is not universal [60] and other studies reflect our results, as Fowler et al. [62] reported similar soil C content between fertilized and reference plots at the Long-Term Soil Productivity (LTSP) study at the FEF. Soil OM values may be highly spatially variable, which also may help account for the differences in results between studies of soil OM values following fertilization.
Bulk soil OM also varied beneath different tree species, to the largest extent in WS3-FERT B-horizon, where cherry exhibited the greatest bulk soil OM content, significantly different from soil beneath both oak and poplar but similar to soil beneath birch (Table 1). It was expected that soil OM would vary by tree species, as AM-associated species tend to have a more rapid, inorganic nutrient cycle and labile litter [16], which is supported by our measures of soil OM beneath cherry but not poplar. However, Adams and Angradi [54] reported tulip poplar litter decomposition rates to be more similar to black birch than black cherry litter, and the average bulk soil OM measured here for soil beneath black birch are less than from soil beneath black cherry, though these are not statistically distinct.
Bulk soil pH values were significantly higher in WS7-REF than WS3-FERT in the A-horizon, though B-horizon pH values did not differ between watersheds (Table 1). This is congruent with the findings by Adams et al. [45] of the fertilization regime resulting in acidification of soil and stream water in WS3-FERT. Soil pH also varied among tree species, but only in WS7-REF. Differences in pH due to species has also been reported by Binkley and Giardina [63] and by Shear and Stewart [64], who reported that soil beneath silver maple (an AM-associated species) was less acidic than soil beneath larch, pine, and oak (ECM-associated species). Soil pH has also been linked to mycorrhizal association, where, in Indiana, USA, ECM-dominated plots had lower soil pH relative to AM-dominated plots [65], and Yin et al. [66] reported that AM species have a neutralizing effect on rhizosphere soil while ECM species had acidifying effects via greater amounts of organic acid exudates for nutrient acquisition. In WS7-REF, we measured a similar effect where the ECM species (red oak and black birch) had significantly lower pH in both the A- and B-horizons compared to the AM species. Strickland and Rousk [67] stated that the homogeneity of broadcast fertilizer applications likely negates differences due to fungal association, and in our study, the differences in soil pH as influenced by tree species disappears in WS3-FERT, perhaps related to the soil homogenization effect of fertilization that was documented in measures of soil N processes by Gilliam et al. [68] in WS3-FERT at FEF.
We measured POXC to estimate soil microbial activity and the active pool of soil C. Our results suggest little difference between watersheds in this active soil C, with the exception of a trend toward more POXC in the WS3-FERT B-horizon relative to the WS7-REF B-horizon (Table 1), though POXC was significantly correlated to the <53 µm size class in both soil horizons. Due to the high variability of POXC values within a watershed measured here, our sample size may not be sufficient to statistically capture true differences in this parameter. Because POXC reflects a heavily processed, labile fraction of soil C [52], we hypothesized that POXC would be greater in WS7-REF, as microbial extra-cellular enzyme activity has been shown to be lower in WS3-FERT soil relative to WS7-REF [31]. The slightly greater amount of POXC in the WS3-FERT B-horizon may reflect processes linked to the altered bacterial community resulting from fertilization [31], increased AM fungal growth resulting from fertilization [69], and/or the effect of ECM-associated tree species reducing fungal C allocation under N fertilization regimes [70]. Cullings et al. [71] demonstrated that ECM fungi can utilize their saprotrophic capabilities to secrete OM-degrading enzymes when receiving limited C from host trees, which could result in the greater POXC values observed in soil from fertilized WS3-FERT. Overall, POXC may influence aggregate measures, though more studies with larger sample sizes are needed to confirm this.
4.2. Aggregate Weight
Total sand-free aggregate weight in the B-horizon of WS7-REF was consistently greater than that of WS3-FERT, but there were not significant differences in total aggregate weight between the watersheds for the A-horizon (Table 1). The greater aggregate weight documented in soil from WS7-REF provides support for the hypothesis that fertilization would result in reduced aggregation in fertilized soil. Aggregation in soil may be influenced by changes in soil chemistry via pH-dependent change in mineral surface charge or ionic composition, causing dispersal or flocculation of soil particles [72]. Other studies have documented changes in soil chemical parameters following fertilization in WS3-FERT. Among those parameters, decreases in extractable soil Ca2+ and increases in electrical conductivity (EC) of soil solution in lysimeters have been reported. Both a decrease in Ca2+ and an increase in EC will promote dispersion of soil aggregates, as noted here in soil from WS3-FERT. Another plausible mechanism by which fertilization would reduce aggregate weight in forest soils may be that bacterial enzymatic activity is reduced under N fertilization (shown by Carrara et al., 2018) and that reduced bacterial processes result in reduced soil aggregation [73]. Furthermore, Kallenbach et al. [74] demonstrated that bacterial processes increase stable SOM and promote aggregation. This contrasts however, with Plaza-Bonilla et al. [75], who reported no significant differences in aggregate weight following long-term fertilization in agricultural soil.
It was expected that lower soil pH in the fertilized soil would act to disperse soil aggregates as a result of altered surface charge and reduced flocculation [76]. Our results suggest that acidification processes resulted in a greater abundance of 53–250 µm aggregates and soil particles in the <53 μm (Figure 1). In WS7-REF, where soil pH is higher, larger macro-aggregates were most abundant. The alteration of aggregate size distribution to a greater abundance of the smallest fractions in fertilized forest soil may have important implications for water storage, plant-available water, hydraulic conductivity, and generation of runoff [77]. The size distribution of aggregates influences the size and continuity of pore space, whereby water is held or moves through preferential flow. In WS3-FERT, where soil has a greater abundance of aggregates < 250 µm and particles < 53 μm, hydraulic conductivity and infiltration of water may be lower and may potentially result in more runoff generation. Further study on the hydrologic implications of the altered aggregate size distribution in these watersheds is warranted.
The influence of tree species on soil aggregate weight is highlighted with black cherry, whereby soil beneath black cherry exhibited the largest difference in aggregate weight distribution between watersheds. Perplexingly, soil beneath black cherry consistently had more macro-aggregates than other species in WS3-FERT and consistently fewer macro-aggregates than other species in WS7-REF. In general, because AM-associated species (particularly black cherry) have more labile and easily decomposed litter [16,54], microbial activity and organic byproducts are greater under AM-associated species, presumably leading to greater aggregation capacity. Upon further analysis of the role of fungal association on aggregate weight distribution using the limited number of representatives here in this study, we see that the mycorrhizal fungal association significantly influenced aggregate sand-free weight distribution within each watershed, though the influence of fungal association was distinct by watershed (Figure 6). Most commonly, differences in aggregate weight between fungal association occurred in WS7-REF A-horizon soil, where ECM soil exhibited significantly greater aggregate sand-free weight in the 53–250, 250–500, and 500–1000 fractions. Statistical differences between fungal association were not evident in the WS7-REF B-horizon in any size class. This was distinct from soil within WS3-FERT, where AM soil exhibited greater aggregate sand-free weight in the 1000–2000 size fraction (A-horizon) and the 500–1000 size fraction (B-horizon). In WS3-FERT B-horizon, soil beneath ECM-associated species consistently had lower aggregate weight in the larger size classes, with a shift of aggregate sand-free weight to the <53 µm size class relative to AM soil.
However, the hypothesis that AM-associated tree species would lead to greater overall aggregation was not supported, as evidenced by the greater aggregation that occurred beneath ECM species in WS7-REF (Figure 6). The related hypothesis that acidification and the resultant reduced microbial processes would more significantly reduce stable aggregate formation beneath AM species was also not supported. We suggest that, while the effects of mycorrhizal fungi are a significant force on aggregate formation, the mechanisms are still not fully understood. Additionally, because we only included two of each AM and ECM species in our analysis here, we encourage further study on a larger set of AM and ECM species to provide further insight into the role of fungal association on aggregate measures.
4.3. Aggregate-Associated Organic Matter
Total aggregate-associated OM also differed to the greatest extent between watersheds in the B-horizon, where there was more total aggregate-associated OM in soil from WS7-REF, while aggregate-associated OM content was similar between watersheds in the A-horizon. This is as expected and supported by Carrara et al. [31], who reported that bacterial enzymatic activities were reduced in WS3-FERT compared to WS7-REF. Furthermore, Rousk et al. [78] showed that bacterial populations decrease at lower pH, as in soil from WS3-FERT. The more distinct differences in aggregate-associated OM that occur in the B-horizon are likely a function of the decreased decomposition of litter and soil above, leading to reductions of bulk soil and aggregate-associated OM in the B-horizon of WS3-FERT. In addition, OM interactions with the accumulated clay minerals in the subsurface soil may amplify the differences in aggregate-associated OM, which is supported by Craig et al. [19], who reported that AM-associated soil contains more OM than ECM-associated soil only in the subsoil to 1 m depth, where microbial byproducts from AM litter accumulated on clays in the subsoil. A greater intra-aggregate OM content in the B-horizon is also likely related to the greater sand-free aggregate weight in WS7-REF in the B-horizon due to processes related to pH-dependent dispersion and/or depressed bacterial aggregate-forming activity in the fertilized system.
When comparing the influence of tree species on aggregate OM, the data suggest a similar pattern to sand-free aggregate weight, where soil beneath black cherry contained more aggregate OM than other species in WS3-FERT and less aggregate OM than other species in WS7-REF (Figure 4). This lends support to the concept that litter decomposability plays a large role in the accumulation of intra-aggregate OM, which may be particularly enhanced under N fertilization. In the case of black cherry, AM-fungi experience increased growth under elevated N availability [69] and AM-associated species tend to have more easily decomposable litter [16], resulting in more aggregate OM in fertilized soil. At first, this theory may seem to be contradicted by the similarity of aggregate OM in soil beneath tulip poplar and the ECM-associated species. However, Adams and Angradi [54] examined the decay rates of litter from multiple tree species in WS3-FERT and WS7-REF—including black birch, black cherry, and tulip poplar—and found that tulip poplar litter decomposed at a rate more akin to black birch (an ECM-associated species) than to black cherry (AM-associated species) on both 1- and 2-year timescales. Previously, AM-associated fungi have been shown to positively correlate to development of soil aggregates [21,22] due to more hyphae biomass and production of glomalin-related soil protein; however, this effect may vary depending on plant or fungal species [23]. Because the relative rate of litter decomposition affects the amount of microbially derived OM available to be bound within aggregates, the different litter decomposition rates of tree species between watersheds likely influenced the differential response of aggregate OM beneath black cherry and the other tree species.
4.4. Relationship between pH, POXC, and Micro-Aggregate Size Fraction
Soil pH was inversely related to both micro-aggregate weight and micro-aggregate OM content in A-horizon soil across watersheds, where low soil pH resulted in greater micro-aggregate weight and micro-aggregate OM (Figure 5). While this does not support our initial hypothesis that lowered soil pH would induce dispersion forces and prevent aggregation, a similar effect was documented by Bethlenfalvay et al. [79], where AM growth was the primary influencer of stable aggregate formation. In that study, water-stable aggregate weight and AM fungal hyphae growth both increased with N addition as soil pH decreased. This provides further support for the idea that mycorrhizae may play a more fundamental role in aggregate formation than bacterial activity. Bethenfalvay et al. [79] also found that increased bacterial metabolic activity resulted in a temporary decrease in the amount of water stable aggregates [5,79]. Rousk et al. [78] reported that bacterial population size positively correlated with soil pH while fungal abundance was unaffected by pH in a wheat-producing agricultural system in the U.K. Further, Emerson and Dettmann [80] found that clay–clay attractive forces in predominantly illite soils are stronger in acidic systems due to positively charged clay edges, leading to more aggregation in acidified systems.
The relationship of aggregate sand-free weight and OM with POXC were contrary to what was expected, and soils with a larger POXC had more OM content and sand-free aggregate weight in the <53 µm size class. At the outset of this experiment, small particles were assumed to contain both unassociated clay particles and free micro-aggregates. Based on the POXC results reported here, we contend that this size class is predominantly made up of free micro-aggregates < 53 µm and not unassociated clay particles. Culman [52] stated that POXC is predominantly related to smaller sized (53–250 µm) particulate organic carbon (POC) and the pool of processed, labile soil C. We are still presented with the question of why there is more OM in the <53 µm size class in the acidified watershed than in the reference.
Carrara et al. [31] analyzed soil from the watershed receiving long-term N fertilization and found that, with increased N, belowground plant C allocation decreases, resulting in a cascading effect of decreased extracellular bacterial enzyme activity and arbuscular mycorrhizal colonization. The decrease in bacterial enzyme activity noted by [31] also supports the conclusions of Frey et al. [61], who reported that the increased SOC measured following N addition is due to reduced OM decomposition. Our finding that increased POXC is correlated to increased OM in the <53 µm size class indicates that, in the fertilized watershed, there may be increased, not decreased, microbial decomposition in contrast to findings by Carrara et al. [31].
Finally, it is also important to consider the influence of surrounding tree species’ fungal association on soil microbial activity. POXC increased under increasing influence of surrounding basal area ECM in WS3-FERT, especially in the B-horizon (p = 0.029). There were no significant trends between POXC and surrounding %ECM basal area in WS7-REF. This result further supports the conclusions by Vallack et al. [70] and Cullings et al. [71] that ECM-associated tree species may reduce belowground C allocation when under a fertilization regime, resulting in increased decomposition by ECM fungi.
5. Conclusions
Our data show that 30 years of forest fertilization with (NH4)2SO4 has altered soil aggregation, as fertilized soil exhibits decreased macro-aggregate formation and a greater proportion of smaller micro-aggregates or unassociated clay minerals, particularly in B-horizon soil. This shift in aggregation processes to soil more dominated by the smallest <53 µm fraction is associated with parameters measured in this study of both acidification (soil pH) and increased microbially processed C (oxidizable C) in fertilized soil, though the potential role of added N, S, and greater EC should also be considered. Macro-aggregate-associated OM was also significantly reduced in the fertilized soil, most strongly in subsurface soil. We also document that tree species can influence soil aggregation and suggest that this may be related to the decomposability of litter material, as tree species influence was further impacted by fertilization. On a larger scale, soil C beneath tree species with more readily decomposable litter—most often AM-associated tree species—increases under increased N conditions, and this has resulted in the soil of eastern U.S. forests to more strongly function as C sinks. Because of the decreased capacity for macro-aggregate formation induced by fertilization documented here, as the atmospheric deposition of N and S compounds continues to decline following implementation of the Clean Air Act of 1990 and amendments, there is potential for labile, unprotected C in the smallest <53 µm fractions to be further decomposed in the fungal and bacterial communities shifting in response to the changing environment. This has significant implications for our understanding of C cycling in the landscape as well as concerns relative to hydrologic alteration and nutrient movement in forested ecosystems.
Author Contributions
Conceptualization, M.B.A., W.T.P. and C.N.K.; data curation, J.E.K. and C.N.K.; formal analysis, J.E.K. and C.N.K.; funding acquisition, M.B.A., W.T.P. and C.N.K.; methodology, M.B.A., L.M.M. and C.N.K.; resources, M.B.A., L.M.M., W.T.P. and C.N.K.; supervision, C.N.K.; writing—original draft, J.E.K. and C.N.K.; writing—review and editing, M.B.A., L.M.M. and W.T.P. All authors have read and agreed to the published version of the manuscript.
Funding
This research was funded by USDA McIntire-Stennis, project number 1008506, and the long-term fertilization was funded by Long-Term Research in Environmental Biology (LTREB) program at the National Science Foundation (grant Nos. DEB-0417678 and DEB-1019522) and the USDA Forest Service.
Institutional Review Board Statement
Not applicable.
Informed Consent Statement
Not applicable.
Data Availability Statement
The data presented in this study are openly available in FigShare at DOI: 10.6084/m9.figshare.13499199.
Conflicts of Interest
The authors declare no conflict of interest.
Appendix A

Table A1.
Statistical test values for each factor by soil horizon: values represent z-scores for watershed and fungal association factors and chi-squared values for species factor. p-values are given in parenthesis. Significance is accepted at p < 0.05, and significant effects are bolded.
Table A1.
Statistical test values for each factor by soil horizon: values represent z-scores for watershed and fungal association factors and chi-squared values for species factor. p-values are given in parenthesis. Significance is accepted at p < 0.05, and significant effects are bolded.
| Aggregate Size Fraction | ||||||||
|---|---|---|---|---|---|---|---|---|
| Parameter | Soil Horizon | Factor | >2000 | 1000–2000 | 500–1000 | 250–500 | 53–250 | >53 |
| Aggregate sand-free weight (g kg−1 soil) | A | Watershed | 2.34 (0.019) | 0.89 (0.376) | 0.62 (0.534) | 0.58 (0.559) | −2.47 (0.014) | −3.75 (<0.001) |
| Species | 2.57 (0.462) | 3.19 (0.363) | 7.89 (0.048) | 11.26 (0.010) | 4.76 (0.190) | 2.21 (0.530) | ||
| Fungal Association | −0.89 (0.375) | −1.87 (0.235) | 2.24 (0.025) | 2.77 (0.006) | 1.68 (0.094) | 0 (1.000) | ||
| B | Watershed | 1.74 (0.082) | 4.28 (<0.001) | 3.49 (<0.001) | 0.24 (0.807) | −2.69 (0.007) | −4.35 (<0.001) | |
| Species | 3.08 (0.380) | 0.13 (0.988) | 0.43 (0.935) | 4.77 (0.189) | 1.56 (0.669) | 1.13 (0.771) | ||
| Fungal Association | 0.70 (0.485) | 0.32 (0.749) | −0.51 (0.611) | −1.94 (0.0523) | −0.89 (0.376) | 0.05 (0.955) | ||
| Aggregate OM (gOM kg−1 soil) | A | Watershed | 2.02 (0.043) | −0.17 (0.865) | −0.17 (0.865) | 0.09 (0.925) | −2.54 (0.011) | −0.18 (0.859) |
| Species | 2.57 (0.462) | 4.91 (0.178) | 1.21 (0.751) | 5.04 (0.168) | 3.41 (0.333) | 9.07 (0.028) | ||
| Fungal Association | −1.42 (0.157) | −1.79 (0.073) | 0.92 (0.356) | 1.94 (0.052) | 1.49 (0.137) | 1.01 (0.314) | ||
| B | Watershed | 1.49 (0.136) | 3.71 (<0.001) | 3.26 (0.001) | 1.87 (0.062) | −0.21 (0.836) | −1.88 (0.060) | |
| Species | 2.73 (0.435) | 0.42 (0.936) | 1.40 (0.705) | 4.53 (0.210) | 4.70 (0.195) | 1.55 (0.670) | ||
| Fungal Association | 0.59 (0.558) | −0.36 (0.720) | −0.58 (0.559) | −1.68 (0.094) | −1.11 (0.266) | −0.53 (0.594) | ||
References
- Elliot, E.T.; Coleman, D.C. Let the soil work for us. Ecol. Bull. 1988, 39, 23–32. [Google Scholar]
- Martin, J.P.; Martin, W.P.; Page, J.B.; Raney, W.A.; De Ment, J.D. Soil aggregation. In Advances in Agronomy; Norman, A.G., Ed.; Academic Press Inc.: New York, NY, USA, 1955; Volume 7, pp. 1–37. [Google Scholar]
- Tisdall, J.M.; Oades, J.M. Organic matter and water-stable aggregates in soils. Eur. J. Soil Sci. 1982, 33, 141–163. [Google Scholar] [CrossRef]
- Elliott, E.T. Aggregate Structure and carbon, nitrogen, and phosphorus in native and cultivated soils. Soil Sci. Soc. Am. J. 1986, 50, 627–633. [Google Scholar] [CrossRef]
- Jastrow, J.D. Soil aggregate formation and the accrual of particulate and mineral-associated organic matter. Soil Biol. Biochem. 1996, 28, 665–676. [Google Scholar] [CrossRef]
- Six, J.A.; Elliott, E.T.; Paustian, K. Soil macroaggregate turnover and microaggregate formation: A mechanism for C sequestration under no-tillage agriculture. Soil Biol. Biochem. 2000, 32, 2099–2103. [Google Scholar] [CrossRef]
- Miller, R.M.; Jastrow, J.D. Mycorrhizal fungi influence soil structure. In Arbuscular Mycorrhizas: Physiology and Function; Kapulnik, Y., Douds, D.D., Jr., Eds.; Springer: Dordrecht, The Netherlands, 2000; pp. 3–18. [Google Scholar] [CrossRef]
- Ranjard, L.; Poly, F.; Combrisson, J.; Richaume, A.; Gourbiere, F.; Thioulouse, J.; Nazaret, S. Heterogeneous cell density and genetic structure of bacterial pools associated with various soil microenvironments as determined by enumeration and DNA fingerprinting approach (RISA). Microb. Ecol. 2000, 39, 263–272. [Google Scholar] [CrossRef]
- Wilpiszeski, R.L.; Aufrecht, J.A.; Retterer, S.T.; Sullivan, M.B.; Graham, D.E.; Pierce, E.M.; Zablocki, O.D.; Palumbo, A.V.; Elias, D.A. Soil aggregate microbial communities: Towards understanding microbiome interactions at biologically relevant scales. Appl. Environ. Microbiol. 2019, 85, e00324-19. [Google Scholar] [CrossRef] [Green Version]
- Plante, A.F.; McGill, W.B. Soil aggregate dynamics and the retention of organic matter in laboratory-incubated soil with differing simulated tillage frequencies. Soil Tillage Res. 2002, 66, 79–92. [Google Scholar] [CrossRef]
- Mikha, M.M.; Rice, C.W. Tillage and manure effects on soil and aggregate-associated carbon and nitrogen. Soil Sci. Soc. Am. J. 2004, 68, 809–816. [Google Scholar] [CrossRef]
- Lynch, J.M.; Bragg, E. Microorganisms and soil aggregate stability. In Advances in Soil Science; Stewart, B.A., Ed.; Springer: New York, NY, USA, 1985; pp. 133–171. [Google Scholar] [CrossRef]
- Denef, K.; Six, J.A.; Merckx, R.; Paustian, K. Short-term effects of biological and physical forces on aggregate formation in soils with different clay minerology. Plant Soil 2002, 246, 185–200. [Google Scholar] [CrossRef]
- Tombácz, E.; Libor, Z.; Illes, E.; Majzik, A.; Klumpp, E. The role of reactive surface sites and complexation by humic acids in the interaction of clay mineral and iron oxide particles. Org. Geochem. 2004, 35, 257–267. [Google Scholar] [CrossRef]
- Hepper, E.N.; Buschiazzo, D.E.; Hevia, G.G.; Urioste, A.; Antón, L. Clay mineralogy, cation exchange capacity and specific surface area of loess soils with different volcanic ash contents. Geoderma 2006, 135, 216–223. [Google Scholar] [CrossRef]
- Chapman, S.K.; Langley, J.A.; Hart, S.C.; Koch, G.W. Plants actively control nitrogen cycling: Uncorking the microbial bottleneck. New Phytol. 2006, 169, 27–34. [Google Scholar] [CrossRef] [PubMed]
- Cotrufo, M.F.; Wallenstein, M.D.; Boot, C.M.; Denef, K.; Paul, E. The Microbial Efficiency-Matrix Stabilization (MEMS) framework integrates plant litter decomposition with soil organic matter stabilization: Do labile plant inputs form stable soil organic matter? Glob. Chang. Biol. 2013, 19, 988–995. [Google Scholar] [CrossRef] [Green Version]
- Midgley, M.G.; Brzostek, E.; Phillips, R.P. Decay rates of leaf litters from arbuscular mycorrhizal trees are more sensitive to soil effects than litters from ectomycorrhizal trees. J. Ecol. 2015, 103, 1454–1463. [Google Scholar] [CrossRef] [Green Version]
- Craig, M.E.; Turner, B.L.; Liang, C.; Clay, K.; Johnson, D.J.; Phillips, R.P. Tree mycorrhizal type predicts within-site variability in the storage and distribution of soil organic matter. Glob. Chang. Biol. 2018, 24, 3317–3330. [Google Scholar] [CrossRef]
- Pritsch, K.; Garbaye, J. Enzyme secretion by ECM fungi and exploitation of mineral nutrients from soil organic matter. Ann. For. Sci. 2011, 68, 25–32. [Google Scholar] [CrossRef] [Green Version]
- Rillig, M.C.; Wright, S.F.; Eviner, V.T. The role of arbuscular mycorrhizal fungi and glomalin in soil aggregation: Comparing effects of five plant species. Plant Soil 2002, 238, 325–333. [Google Scholar] [CrossRef]
- Leifheit, E.F.; Veresoglou, S.D.; Lehmann, A.; Morris, E.K.; Rillig, M.C. Multiple factors influence the role of arbuscular mycorrhizal fungi in soil aggregation—a meta-analysis. Plant Soil 2014, 374, 523–537. [Google Scholar] [CrossRef]
- Piotrowski, J.S.; Denich, T.; Klironomos, J.N.; Graham, J.M.; Rillig, M.C. The effects of arbuscular mycorrhizas on soil aggregation depend on the interaction between plant and fungal species. New Phytol. 2004, 164, 365–373. [Google Scholar] [CrossRef]
- Jastrow, J.D.; Miller, R.M. Soil aggregate stabilization and carbon sequestration: Feedbacks through organomineral associations. In Soil Processes and the Carbon Cycle; Lal, R., Kimble, J.M., Follett, R.F., Stewart, B.A., Eds.; CRC Press: Boca Raton, FL, USA, 1997; p. 207. [Google Scholar]
- Waksman, S.A.; Martin, J.P. The role of microorganisms in the conservation of the soil. Science 1939, 90, 304–305. [Google Scholar] [CrossRef] [PubMed]
- Harris, R.F.; Chesters, G.; Allen, O.N. Dynamics of soil aggregation. In Advances in Agronomy; Norman, A.G., Ed.; Academic Press Inc.: New York, NY, USA, 1966; Volume 18, pp. 107–169. [Google Scholar] [CrossRef]
- Zhang, Y.; Mathur, R.; Bash, J.O.; Hogrefe, C.; Xing, J.; Roselle, S.J. Long-term trends in total inorganic nitrogen and sulfur deposition in the US from 1990 to 2010. Atmos. Chem. Phys. 2018, 18, 9091. [Google Scholar] [CrossRef] [Green Version]
- Driscoll, C.T.; Lawrence, G.B.; Bulger, A.J.; Butler, T.J.; Cronan, C.S.; Eagar, C.; Lambert, K.F.; Likens, G.E.; Stoddard, J.L.; Weathers, K.C. Acidic Deposition in the Northeastern United States: Sources and Inputs, Ecosystem Effects, and Management Strategies: The effects of acidic deposition in the northeastern United States include the acidification of soil and water, which stresses terrestrial and aquatic biota. BioScience 2001, 51, 180–198. [Google Scholar] [CrossRef] [Green Version]
- Söderström, B.; Bååth, E.; Lundgren, B. Decrease in soil microbial activity and biomasses owing to nitrogen amendments. Can. J. Microbiol. 1983, 29, 1500–1506. [Google Scholar] [CrossRef]
- Treseder, K.K. Nitrogen additions and microbial biomass: A meta-analysis of ecosystem studies. Ecol. Lett. 2008, 11, 1111–1120. [Google Scholar] [CrossRef] [Green Version]
- Carrara, J.E.; Walter, C.A.; Hawkins, J.S.; Peterjohn, W.T.; Averill, C.; Brzostek, E.R. Interactions among plants, bacteria, and fungi reduce extracellular enzyme activities under long-term N fertilization. Glob. Chang. Biol. 2018, 24, 2721–2734. [Google Scholar] [CrossRef]
- Zak, D.R.; Argiroff, W.A.; Freedman, Z.B.; Upchurch, R.A.; Entwistle, E.M.; Romanowicz, K.J. Anthropogenic N deposition, fungal gene expression, and an increasing soil carbon sink in the Northern Hemisphere. Ecology 2019, 100, e02804. [Google Scholar] [CrossRef]
- DeForest, J.L.; Zak, D.R.; Pregitzer, K.S.; Burton, A.J. Atmospheric Nitrate Deposition, Microbial Community Composition, and Enzyme Activity in Northern Hardwood Forests. Soil Sci. Soc. Am. J. 2004, 68, 132–138. [Google Scholar] [CrossRef] [Green Version]
- Stătescu, F.; Zaucă, D.C.; Pavel, L.V. Soil structure and water-stable aggregates. Environ. Eng. Manag. J. 2013, 12, 741–746. [Google Scholar] [CrossRef]
- Haynes, R.; Naidu, R. Influence of lime, fertilizer and manure applications on soil organic matter content and soil physical conditions: A review. Nutr. Cycl. Agroecosys. 1998, 51, 123–137. [Google Scholar] [CrossRef]
- Boix-Fayos, C.; Calvo-Cases, A.; Imeson, A.C.; Soriano-Soto, M.D. Influence of soil properties on the aggregation of some Mediterranean soils and the use of aggregate size and stability as land degradation indicators. Catena 2001, 44, 47–67. [Google Scholar] [CrossRef]
- Bronick, C.J.; Lal, R. Soil structure and management: A review. Geoderma 2005, 124, 3–22. [Google Scholar] [CrossRef]
- Heil, D.; Sposito, G. Organic matter role in illitic soil colloids flocculation: I. Counter ions and pH. Soil Sci. Soc. Am. J. 1993, 57, 1241–1246. [Google Scholar] [CrossRef]
- Emerson, W.W.; Greenland, D.J. Soil aggregates—formation and stability. In Soil Colloids and Their Associations in Aggregates; De Boodt, M.F., Hayes, M.H.B., Herbillon, A., de Strooper, E.B.A., Tuck, J.J., Eds.; Springer: Boston, MA, USA, 1990; pp. 485–511. [Google Scholar] [CrossRef]
- Groffman, P.M.; Driscoll, C.T.; Durán, J.; Campbell, J.L.; Christenson, L.M.; Fahey, T.J.; Fisk, M.C.; Fuss, C.; Likens, G.E.; Lovett, G.; et al. Nitrogen oligotrophication in northern hardwood forests. Biogeochemistry 2018, 141, 523–539. [Google Scholar] [CrossRef]
- Kochenderfer, J.N. Fernow and the Appalachian hardwood region. In The Fernow Watershed Acidification Study; Adams, M.B., DeWalle, D.R., Hom, J.L., Eds.; Springer: Dordrecht, The Netherlands, 2007; pp. 17–39. [Google Scholar] [CrossRef]
- Web Soil Survey. Available online: http://websoilsurvey.sc.egov.usda.gov/ (accessed on 30 April 2020).
- Ditzler, C.; Scheffe, K.; Monger, H.C. Soil Science Division Staff. Soil survey manual. In USDA Handbook 18; Government Printing Office: Washington, DC, USA, 2017. [Google Scholar]
- Lusk, M.G. Sulfate Dynamics and Base Cation Release in a High Elevation Appalachian Forest Soil. Ph.D. Thesis, Virginia Polytechnic Institute and State University, Blacksburg, VA, USA, 1998. [Google Scholar]
- Adams, M.B.; DeWalle, D.R.; Hom, J.L. The Fernow Watershed Acidification Study; Springer: Dordrecht, The Netherlands, 2007. [Google Scholar] [CrossRef]
- Adams, M.B.; DeWalle, D.R.; Peterjohn, W.T.; Gilliam, F.S.; Sharpe, W.E.; Williard, K.W. Soil chemical response to experimental acidification treatments. In The Fernow Watershed Acidification Study; Adams, M.B., DeWalle, D.R., Hom, J.L., Eds.; Springer: Dordrecht, The Netherlands, 2007; pp. 41–69. [Google Scholar] [CrossRef]
- Yoder, R.E. A direct method of aggregate analysis of soils and a study of the physical nature of erosion losses 1. Agron. J. 1936, 28, 337–351. [Google Scholar] [CrossRef]
- Ekwuea, E.I.; Anya, T.D.; Chakansinghc, A. A Wet Sieving Apparatus for Determining Aggregate Stability of Soils. Assoc. Prof. 2018, 46, 35–40. [Google Scholar]
- Kelly, C.N.; Benjamin, J.; Calderon, F.C.; Mikha, M.M.; Rutherford, D.W.; Rostad, C.E. Incorporation of biochar carbon into stable soil aggregates: The role of clay mineralogy and other soil characteristics. Pedosphere 2017, 27, 694–704. [Google Scholar] [CrossRef]
- Demolon, A.; Hénin, S. The structure of loams and the synthesis of aggregates. Soil Res. 1932, 3, 1–9. [Google Scholar]
- Qian, B.; Liu, L.; Xiao, X. Comparative tests on different methods for content of soil organic matter. J. Hohai Univ. Nat. Sci. 2011, 39, 34–38. [Google Scholar]
- Culman, S.W.; Snapp, S.S.; Freeman, M.A.; Schipanski, M.E.; Beniston, J.; Lal, R.; Drinkwater, L.E.; Franzluebbers, A.J.; Glover, J.D.; Grandy, A.S.; et al. Permanganate oxidizable carbon reflects a processed soil fraction that is sensitive to management. Soil Sci. Soc. Am. J. 2012, 76, 494–504. [Google Scholar] [CrossRef] [Green Version]
- Hurlburt, S.H. Pseudoreplication and the Design of Ecological Field Experiments. Ecol. Monogr. 1984, 54, 187–211. [Google Scholar] [CrossRef] [Green Version]
- Adams, M.B.; Angradi, T.R. Decomposition and nutrient dynamics of hardwood leaf litter in the Fernow whole-watershed acidification experiment. For. Ecol. Manag. 1996, 83, 61–69. [Google Scholar] [CrossRef]
- Adams, M.B.; Edwards, P.J.; Wood, F.; Kochenderfer, J.N. Artificial watershed acidification on the Fernow Experimental Forest, USA. J. Hydrol. 1993, 150, 505–519. [Google Scholar] [CrossRef]
- Gilliam, F.S.; Yurish, B.M.; Adams, M.B. Ecosystem nutrient responses to chronic nitrogen inputs at Fernow Experimental Forest, West Virginia. Can. J. For. Res. 1996, 26, 196–205. [Google Scholar] [CrossRef]
- Gilliam, F.S.; Welch, N.T.; Phillips, A.H.; Billmyer, J.H.; Peterjohn, W.T.; Fowler, Z.K.; Walter, C.A.; Burnham, M.B.; May, J.D.; Adams, M.B. Twenty-five-year response of the herbaceous layer of a temperate hardwood forest to elevated nitrogen deposition. Ecosphere 2016, 7, 1–16. [Google Scholar] [CrossRef] [Green Version]
- Burnham, M.B.; Cumming, J.R.; Adams, M.B.; Peterjohn, W.T. Soluble soil aluminum alters the relative uptake of mineral nitrogen forms by six mature temperate broadleaf tree species: Possible implications for watershed nitrate retention. Oecologia 2017, 185, 327–337. [Google Scholar] [CrossRef]
- Nave, L.E.; Vance, E.D.; Swanston, C.W.; Curtis, P.S. Impacts of elevated N inputs on north temperate forest soil C storage, C/N, and net N-mineralization. Geoderma 2009, 153, 231–240. [Google Scholar] [CrossRef]
- Janssens, I.A.; Dieleman, W.; Luyssaert, S.; Subke, J.A.; Reichstein, M.; Ceulemans, R.; Ciais, P.; Dolman, A.J.; Grace, J.; Matteucci, G.; et al. Reduction of forest soil respiration in response to nitrogen deposition. Nat. Geosci. 2010, 3, 315–322. [Google Scholar] [CrossRef]
- Frey, S.D.; Ollinger, S.; Nadelhoffer, K.E.; Bowden, R.; Brzostek, E.; Burton, A.; Caldwell, B.A.; Crow, S.; Goodale, C.L.; Grandy, A.S.; et al. Chronic nitrogen additions suppress decomposition and sequester soil carbon in temperate forests. Biogeochemistry 2014, 121, 305–316. [Google Scholar] [CrossRef]
- Fowler, Z.K. The Effects of Accelerated Soil Acidification on Aggrading Temperate Deciduous Forests: The Fernow Experimental Forest Long Term Soil Productivity (LTSP) Study at 13 Years. Ph.D. Thesis, West Virginia University, Morgantown, WV, USA, 2014. [Google Scholar] [CrossRef]
- Binkley, D.; Giardina, C. Why do tree species affect soils? The Warp and Woof of tree-soil interactions. In Plant-Induced Soil Changes: Processes and Feedbacks; Van Breemen, N., Ed.; Springer: Dordrecht, The Netherlands, 1998; pp. 89–106. [Google Scholar] [CrossRef]
- Shear, G.M.; Stewart, W.D. Moisture and pH studies of the soil under forest trees. Ecology 1934, 15, 145–153. [Google Scholar] [CrossRef]
- Brzostek, E.R.; Dragoni, D.; Brown, Z.A.; Phillips, R.P. Mycorrhizal type determines the magnitude and direction of root-induced changes in decomposition in a temperate forest. New Phytol. 2015, 206, 1274–1282. [Google Scholar] [CrossRef] [PubMed]
- Yin, H.; Wheeler, E.; Phillips, R.P. Root-induced changes in nutrient cycling in forests depend on exudation rates. Soil Biol. Biochem. 2014, 78, 213–221. [Google Scholar] [CrossRef] [Green Version]
- Strickland, M.S.; Rousk, J. Considering fungal: Bacterial dominance in soils–methods, controls, and ecosystem implications. Soil Biol. Biochem. 2010, 42, 1385–1395. [Google Scholar] [CrossRef]
- Gilliam, F.S.; Yurish, B.M.; Adams, M.B. Temporal and spatial variation of nitrogen transformations in nitrogen-saturated soils of a central Appalachian hardwood forest. Can. J. For. Res. 2001, 31, 1768–1785. [Google Scholar] [CrossRef]
- Dai, J.; Hu, J.; Lin, X.; Yang, A.; Wang, R.; Zhang, J.; Wong, M.H. Arbuscular mycorrhizal fungal diversity, external mycelium length, and glomalin-related soil protein content in response to long-term fertilizer management. J. Soils Sediments 2012, 13, 1–11. [Google Scholar] [CrossRef]
- Vallack, H.W.; Leronni, V.; Metcalfe, D.B.; Högberg, P.; Ineson, P.; Subke, J.A. Application of nitrogen fertilizer to a boreal pine forest has a negative impact on the respiration of ectomycorrhizal hyphae. Plant Soil 2012, 352, 405–417. [Google Scholar] [CrossRef]
- Cullings, K.; Ishkhanova, G.; Henson, J. Defoliation effects on enzyme activities of the ectomycorrhizal fungus Suillus granulatus in a Pinus contorta (lodgepole pine) stand in Yellowstone National Park. Oecologia 2008, 158, 77. [Google Scholar] [CrossRef]
- Chorom, M.; Rengasamy, P.; Murray, R.S. Clay dispersion as influenced by pH and net particle charge of sodic soils. Soil Res. 1994, 32, 1243–1252. [Google Scholar] [CrossRef]
- Lynch, J.M. Promotion and inhibition of soil aggregate stabilization by micro-organisms. Microbiology 1981, 126, 371–375. [Google Scholar] [CrossRef] [Green Version]
- Kallenbach, C.M.; Frey, S.D.; Grandy, A.S. Direct evidence for microbial-derived soil organic matter formation and its ecophysiological controls. Nat. Commun. 2016, 7, 13630. [Google Scholar] [CrossRef]
- Plaza-Bonilla, D.; Álvaro-Fuentes, J.; Cantero-Martínez, C. Soil aggregate stability as affected by fertilization type under semiarid no-tillage conditions. Soil Sci. Soc. Am. J. 2013, 77, 284–292. [Google Scholar] [CrossRef] [Green Version]
- Nguetnkam, J.P.; Dultz, S. Clay dispersion in typical soils of north Cameroon as a function of pH and electrolyte concentration. Land Degrad. Dev. 2014, 25, 153–162. [Google Scholar] [CrossRef]
- Slawinski, C.; Nosalewicz, A.; Witkowska-Walczak, B. Effect of aggregate size on water movement in soils. Int. Agrophysics 2011, 25, 53–58. [Google Scholar]
- Rousk, J.; Bååth, E.; Brookes, P.C.; Lauber, C.L.; Lozupone, C.; Caporaso, J.G.; Knight, R.; Fierer, N. Soil bacterial and fungal communities across a pH gradient in an arable soil. ISME J. 2010, 4, 1340–1351. [Google Scholar] [CrossRef] [PubMed]
- Bethlenfalvay, G.J.; Cantrell, I.C.; Mihara, K.L.; Schreiner, R.P. Relationships between soil aggregation and mycorrhizae as influenced by soil biota and nitrogen nutrition. Biol. Fertil. Soils 1999, 28, 356–363. [Google Scholar] [CrossRef]
- Emerson, W.W.; Dettmann, M.G. The effect of ph on the wet strength of soil crumrs. J. Soil Sci. 1960, 11, 149–158. [Google Scholar] [CrossRef]
Figure 1.
Sand-free weight within each aggregate size class by watershed (WS3-FERT and WS7-REF) in A-horizon and B-horizon: for each horizon, bars with different letters within each aggregate size fraction are significantly different according to Kruskal–Wallis means comparison (p < 0.05).
Figure 1.
Sand-free weight within each aggregate size class by watershed (WS3-FERT and WS7-REF) in A-horizon and B-horizon: for each horizon, bars with different letters within each aggregate size fraction are significantly different according to Kruskal–Wallis means comparison (p < 0.05).

Figure 2.
Sand-free weight within each aggregate size class by tree species in A-horizon and B-horizon by watershed (WS3-FERT and WS7-REF): for each horizon within each watershed, bars with different letters within each aggregate size fraction are significantly different according to Kruskal–Wallis pairwise means comparison (p < 0.05).

Figure 3.
Organic matter within each aggregate size class by watershed (WS3-FERT and WS7-REF) in A-horizon and B-horizon: for each horizon, bars with different lowercase letters within each aggregate size fraction are significantly different according to Kruskal–Wallis means comparison (p < 0.05).
Figure 3.
Organic matter within each aggregate size class by watershed (WS3-FERT and WS7-REF) in A-horizon and B-horizon: for each horizon, bars with different lowercase letters within each aggregate size fraction are significantly different according to Kruskal–Wallis means comparison (p < 0.05).

Figure 4.
Organic matter within each aggregate size class by tree species in A-horizon and B-horizon (WS3-FERT and WS7-REF): for each horizon within each watershed, bars with different letters within each aggregate size fraction are significantly different according to Kruskal–Wallis pairwise means comparison (p < 0.05).

Figure 5.
Significant relationships between (a,b,d) soil pHCaCl2 with micro-aggregate size fractions weight and OM, and (c,e,f) POXC (gPOXC kg soil−1) with aggregate size fractions weight and OM: colored dots refer to data within a watershed. R2 and p–values are denoted for each panel for all data across watersheds.

Figure 6.
Sand-free weight within each aggregate size class by watershed (WS3-FERT and WS7-REF) in A-horizon and B-horizon: for each horizon, bars with different letters within each aggregate size fraction and watershed are significantly different according to Kruskal–Wallis means comparison (p < 0.05).

Table 1.
Mean bulk soil organic matter (OM), soil pHCaCl2, permanganate oxidizable carbon (POXC), and total aggregate weight and OM from each watershed and beneath four tree species: values indicate mean (± standard error). Values with different letters indicate statistically significant differences according to Wilcoxon pairwise means separation (p < 0.05). Significance is denoted between watersheds within the respective horizons and among species within the respective watershed and horizon. * Values represent sum of aggregate weight and OM in size classes between 53 and 2000 μm, respectively.
| Watershed and Horizon | Bulk Soil OM (g kg−1) n = 16 | Soil pHCaCl2 n = 16 | POXC (mg kg−1) n = 16 | Total Aggregate Sand-Free Weight (g kg−1) * n = 16 | Total Aggregate OM (g kg−1) * n = 16 | Tree Species | Bulk Soil OM (g kg−1) n = 4 | Soil pHCaCl2 n = 4 | POXC (mg kg−1) n = 4 |
|---|---|---|---|---|---|---|---|---|---|
| 3A-FERT | 198.65 | 3.57 a | 606.70 | 305.57 | 62.15 | Birch | 170.14 (17.62) | 3.60 (0.12) | 607.58 (31.80) |
| (13.29) | (0.07) | (9.72) | (61.52) | (19.02) | Cherry | 221.08 (36.18) | 3.50 (0.14) | 597.22 (14.98) | |
| Oak | 212.07 (32.34) | 3.65 (0.14) | 599.92 (16.80) | ||||||
| Poplar | 191.29 (18.77) | 3.53 (0.18) | 622.10 (16.07) | ||||||
| 7A-REF | 209.89 | 3.97 b | 575.61 | 316.48 | 60.73 | Birch | 195.44 (18.83) | 3.77 (0.06) b | 567.79 (32.82) |
| (9.52) | (0.10) | (13.85) | (80.28) | (16.09) | Cherry | 240.78 (21.04) | 4.04 (0.14) b | 610.14 (26.25) | |
| Oak | 208.36 (2.32) | 3.68 (0.23) b | 564.73 (17.71) | ||||||
| Poplar | 195.00 (23.39) | 4.39 (0.08) a | 559.77 (34.83) | ||||||
| 3B-FERT | 86.68 a | 4.09 | 404.70 | 342.30 a | 29.23 a | Birch | 78.74 (8.70) ab | 4.07 (0.09) | 424.11 (49.05) |
| (4.12) | (0.06) | (16.27) | (75.54) | (11.18) | Cherry | 107.04 (3.23) a | 3.98 (0.09) | 429.90 (24.52) | |
| Oak | 79.08 (3.58) b | 4.25 (0.09) | 387.23 (34.11) | ||||||
| Poplar | 81.85 (7.36) b | 4.07 (0.14) | 377.56 (30.53) | ||||||
| 7B-REF | 106.91 b | 4.16 | 371.23 | 425.18 b | 44.47 b | Birch | 107.25 (15.14) | 4.04 (0.08) | 341.98 (67.56) |
| (4.44) | (0.06) | (18.74) | (53.51) | (10.48) | Cherry | 107.04 (6.75) | 4.23 (0.11) | 396.03 (20.23) | |
| Oak | 109.31 (5.28) | 4.01 (0.15) | 397.67 (8.90) | ||||||
| Poplar | 104.04 (9.32) | 4.38 (0.08) | 349.23 (32.92) |
Publisher’s Note: MDPI stays neutral with regard to jurisdictional claims in published maps and institutional affiliations. |
© 2020 by the authors. Licensee MDPI, Basel, Switzerland. This article is an open access article distributed under the terms and conditions of the Creative Commons Attribution (CC BY) license (http://creativecommons.org/licenses/by/4.0/).
Share and Cite
MDPI and ACS Style
Kemner, J.E.; Adams, M.B.; McDonald, L.M.; Peterjohn, W.T.; Kelly, C.N. Fertilization and Tree Species Influence on Stable Aggregates in Forest Soil. Forests 2021, 12, 39. https://doi.org/10.3390/f12010039
AMA Style
Kemner JE, Adams MB, McDonald LM, Peterjohn WT, Kelly CN. Fertilization and Tree Species Influence on Stable Aggregates in Forest Soil. Forests. 2021; 12(1):39. https://doi.org/10.3390/f12010039
Chicago/Turabian StyleKemner, Jacob E., Mary Beth Adams, Louis M. McDonald, William T. Peterjohn, and Charlene N. Kelly. 2021. "Fertilization and Tree Species Influence on Stable Aggregates in Forest Soil" Forests 12, no. 1: 39. https://doi.org/10.3390/f12010039
Note that from the first issue of 2016, this journal uses article numbers instead of page numbers. See further details here.