
Measurement Method and Influencing Mechanism of Urban Subdistrict Vitality in Shanghai Based on Multisource Data


1
College of Surveying and Geo-Informatics, Tongji University, Shanghai 200092, China
2
China Architecture Northwest Design and Research Institute Co., Ltd., Xi’an 710018, China
*
Author to whom correspondence should be addressed.
Remote Sens. 2023, 15(4), 932; https://doi.org/10.3390/rs15040932
Submission received: 2 November 2022
/
Revised: 4 February 2023
/
Accepted: 6 February 2023
/
Published: 8 February 2023
(This article belongs to the Special Issue Remote Sensing Imagery for Mapping Economic Activities)
Abstract
:Most previous studies on urban vitality focused on the analysis and evaluation of the overall vitality of urban agglomerations or single cities, while there are few related studies at the micro scale, such as subdistricts and even blocks. Based on multisource data and using the kernel density analysis and entropy methods, the economic vitality, social vitality, cultural vitality, ecological vitality and comprehensive vitality of each subdistrict in Shanghai were measured. Additionally, correlation analysis, the ordinary least squares (OLS) regression model, the spatial lag model (SLM) and the spatial error model (SEM) were used for fitting analysis to reveal the influencing mechanism of urban subdistrict vitality. The results showed that (1) the spatial distribution of economic vitality and social vitality in Shanghai showed the spatial characteristics of radiating outward from the center, and the types of social activity location corresponding to different levels of hotspot areas are different. Cultural vitality showed the spatial distribution characteristics of “gathering in the centre and dispersing around, with Puxi higher than Pudong”, but the cultural vitality values of different subdistricts vary greatly. Ecological vitality showed an increasing trend from the center to the surrounding areas. (2) The overall urban vitality of Shanghai also showed a decreasing circular structure from the center to the periphery. (3) Among the three regression models, i.e., the OLS regression model, SLM and SEM, the model with the best explanation of urban vitality is the SLM, which had an R2 of 0.6984, indicating that it can explain 69.84% of the spatial distribution pattern of urban vitality. (4) The factors that have significant effects on urban vitality are functional mix, metro station accessibility, metro station density, bus station density and intersection density, and all of them are positively correlated. The order of the strength of the effects is bus station density > metro station density > intersection density > metro station accessibility > functional mix.

1. Introduction
Vitality is a comprehensive reflection of a city’s operation. A vibrant city should bring comfort and happiness to its residents. Rapid urbanization has led to rapid development of the urban economy, but the sloppy development model has caused a series of urban diseases, such as traffic congestion, imbalance of jobs and housing, environmental pollution and ecological degradation, resulting in a low efficiency of urban operation, deterioration of urban space quality and lack of vitality of cities [1,2,3,4,5,6,7,8,9].
With the deepening of urbanization, increasing attention has been given to urban vitality, and research contents and methods have been continuously expanded. The research themes focus on the definition of the connotation of urban vitality, evaluation indicators and methods and influence mechanisms.
(1) The source and connotation of urban vitality. Researchers usually agree that urban vitality is generated by the interaction between human activities and the living environment within the city [10]; it comes from the crowd and shows the characteristics of aggregation in space [11]. The connotation of urban vitality can be understood from two perspectives: first, it refers to the vitality of the city, emphasizing the ability of the city to provide the conditions for human survival and to maintain healthy and stable development [12]; second, it refers to the dynamic activities generated by the interaction between people and the environment, emphasizing the diversity generated by the interaction between people and space [13,14,15].
(2) Measurement and evaluation of urban vitality. Most researchers believe that urban vitality is the result of the interaction of the built environment and residents’ activities, so urban vitality can be examined in terms of the built environment (physical dimension) and residents’ activities (human dimension) and their synergistic relationships [14,15,16,17]. Previous studies have focused more on the relationship between the built environment (including street morphology, width and density; building morphology, density and diversity; traffic organization, function and structure; etc.) and urban vitality [8,13,18]; in recent years, the relationship between human activities (including the frequency, diversity and intensity of human activities) and urban vitality has been favored [10,18].
(3) Influencing factors of urban vitality. Urban vitality is the result of multiple factors, both direct and indirect; both objective and subjective; and both positive and negative. They mainly include the level of economic development, human capital, built environment, traffic accessibility, road network density and structure, land use diversity, number of block facilities, floor area ratio, building density, floor area, location and average building height [19,20,21,22]. However, the impact of ecological environmental quality on urban vitality has been disregarded.
In general, the main progress can be summarized as follows: (1) The expansion from single vitality (economic vitality, pedestrian flow, etc.) to comprehensive urban capacity, such as economic, social, environmental and cultural, is another leap in the perception of urban vitality [23,24,25,26]. Thus, it is inevitable to expand from single-factor analysis to multifactor analysis. (2) The gradual shift from focusing on material space forms to attaching importance to human feelings and activities is the embodiment of a human-centered view of urban vitality. Therefore, it has become an important development trend to measure urban vitality based on the diversity of human activities (economic activities, cultural activities, celebrations, etc.) and the frequency of holding, the density of occurrence and the flow of people [10,18]. (3) The evolution from qualitative analysis to combined qualitative and quantitative analysis and evaluation has become increasingly evident in the external characterization of urban vitality, the selection and quantification of indicators and the revelation of influence mechanisms.
Of course, the research on urban vitality still has the following shortcomings: (1) It focuses on the analysis and evaluation of the overall vitality of a city cluster at the macro scale or a single city at the meso level [27,28,29,30]. However, there are relatively few studies on the vitality of different areas within the city at the micro scale [21,31]. (2) It focuses on the static study of urban vitality in a single period, while the dynamic study of urban vitality in multiple periods has not received enough attention. (3) Due to the limitation of data, traditional research mainly focuses on statistical data and collects residents’ subjective will and feelings by means of questionnaire surveys, field surveys, face-to-face interviews, etc. Generally, the research scope is limited, and the time span is short. In today’s digital and big data era, POI data, remote sensing image data, microblog check-in data, mobile phone signaling data and other rich data sources provide the data basis for large-scale, fine-scale and multiperiod urban vitality research and provide a new path for solving urban problems and building urban vitality [32,33,34,35,36].
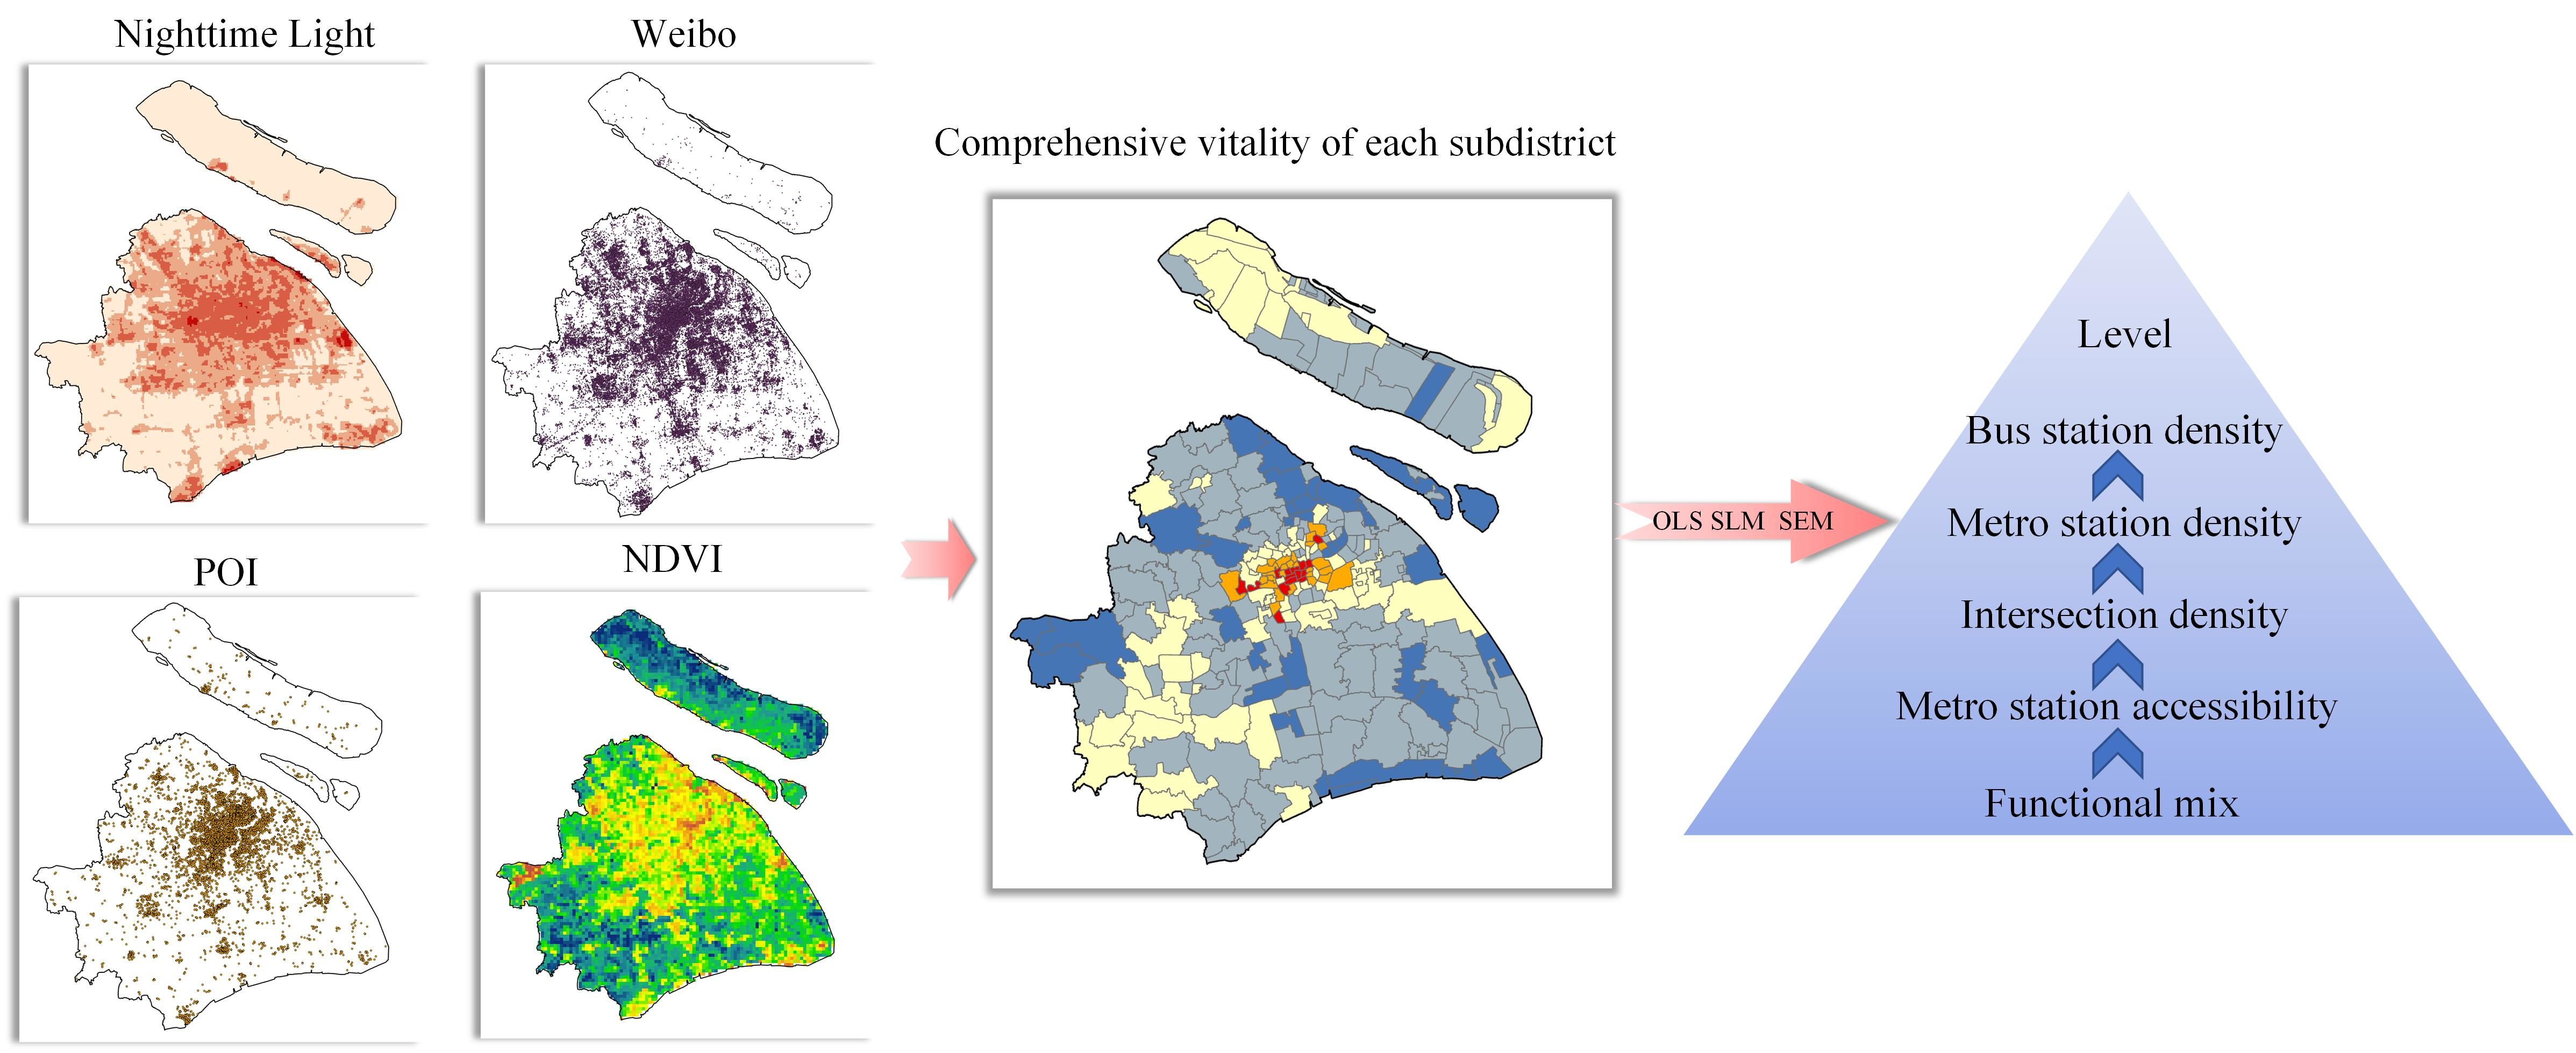
In this study, urban vitality is defined as the ability of a city to have a prosperous economy, rich functions, diverse activities, maintain its own economic, social, cultural and ecological stability, sustainable and healthy development, and radiate and attract surrounding cities. The research objectives of this study are as follows: (1) to measure and analyze the spatial and temporal distribution characteristics of urban vitality from the micro scale (urban subdistrict) based on multisource data; to determine the “cold spot” of vitality and analyze its causes; and (2) to select the factors that have a potential impact on urban vitality and use global regression, local regression and other methods to carry out quantitative fitting and model optimization to reveal the influencing mechanism of urban vitality.
The main contributions of this study are as follows: (1) To study the characteristics of urban vitality and its influencing mechanism from the microscopic scale of urban subdistricts, which makes up for the deficiency of traditional studies that mostly focus on the overall level of cities or regions but ignore their internal heterogeneity. (2) It constructs a comprehensive urban vitality measurement index system from four aspects—economic, social, cultural and ecological—which enriches the connotation and perception dimension of urban vitality. (3) The multisource big data based on location service makes up for the deficiency that traditional statistics cannot be quantified at the microscopic scale.
2. Materials and Methods
2.1. Study Area
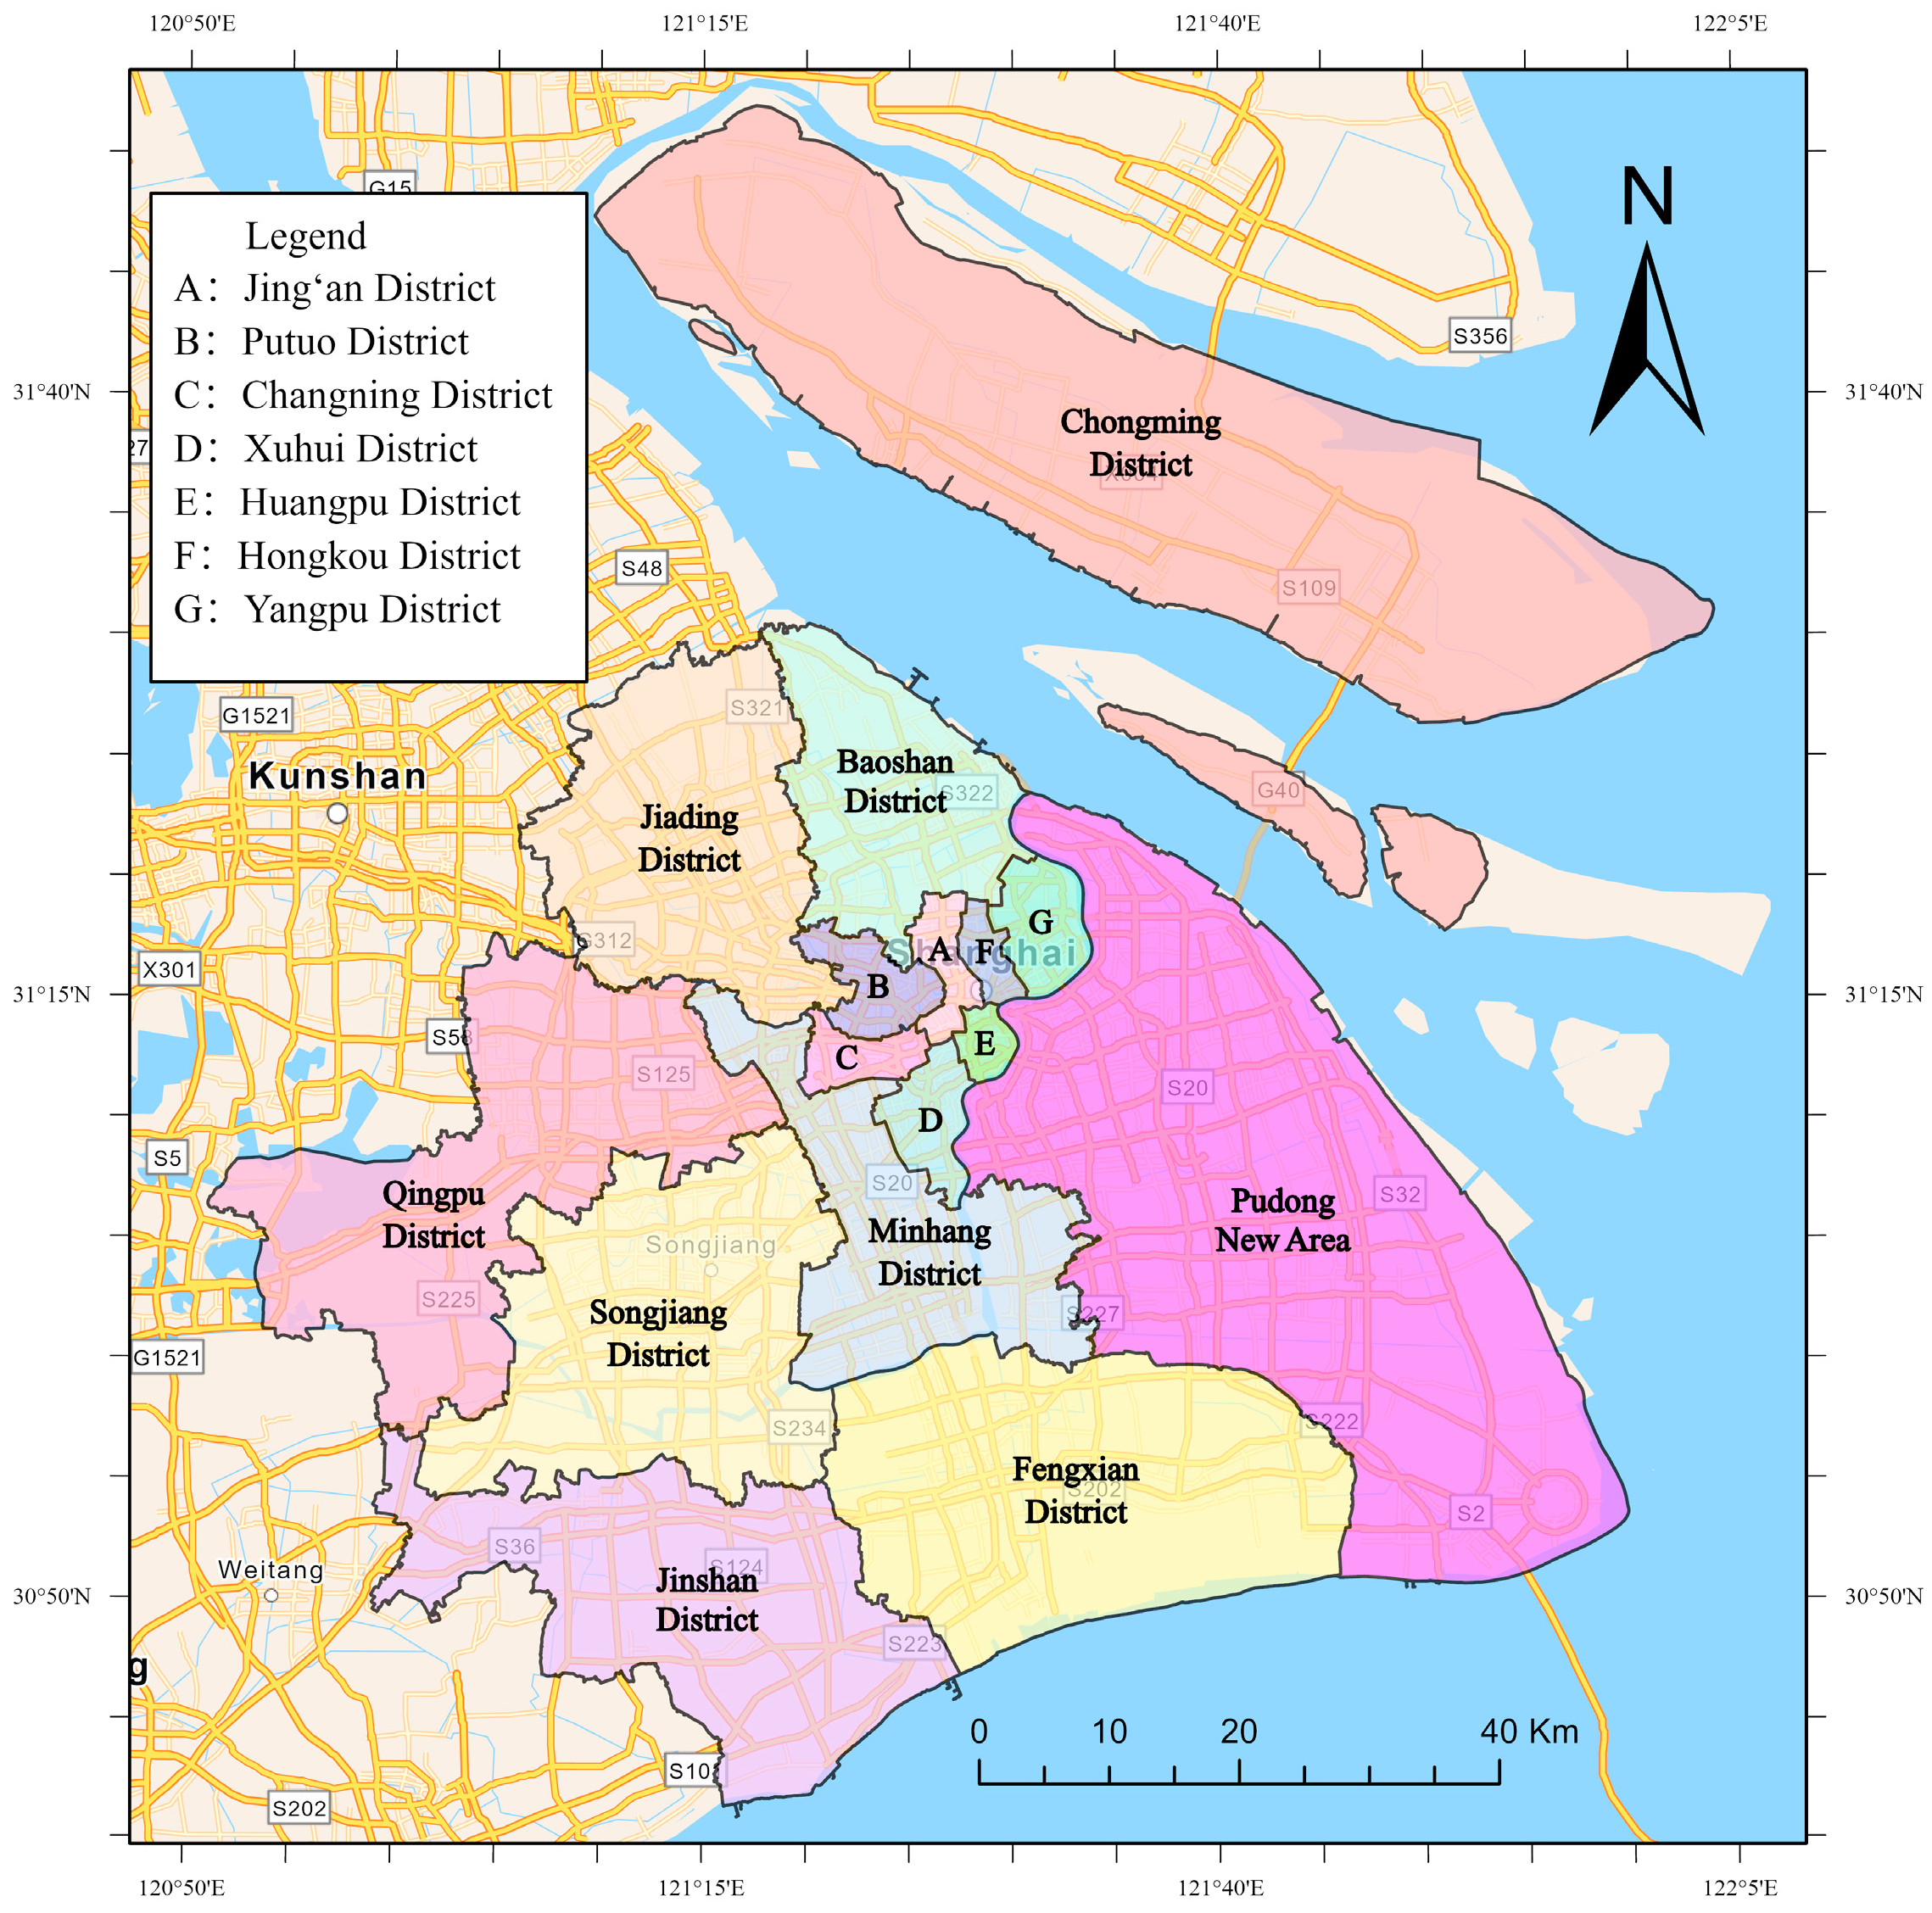
In this study, Shanghai is taken as the study area and subdistrict (Jiedao, town or township) as the space unit to explore its urban vitality and influencing factors. Here, subdistricts refer to the administrative management units, including towns and townships, and their administrative bodies are the subdistrict offices. The reason why they are called subdistricts is mainly to distinguish them from streets that undertake traffic functions. Shanghai is located in eastern China, close to the Yangtze River estuary, the eastern China Sea, southern Hangzhou Bay, convenient transportation and the vast hinterland. Superior geographical conditions and historical reforms have made Shanghai the largest economic center in China, as well as an important national center of science and technology, trade, finance and information. There are 16 districts, 107 subdistricts, 106 towns and 2 townships under the jurisdiction of Pudong New Area, Huangpu, Xuhui, Jing ‘an, Changning, Putuo, Yangpu, Hongkou, Baoshan, Qingpu, Minhang, Jiading, Jinshan, Songjiang, Fengxian and Chongming Districts. The total number of permanent residents in Shanghai is 24.8709 million, among which the number of permanent residents from other provinces and cities is 10.4797 million, accounting for 42.1% in 2020 (Figure 1).
2.2. Data Source and Processing
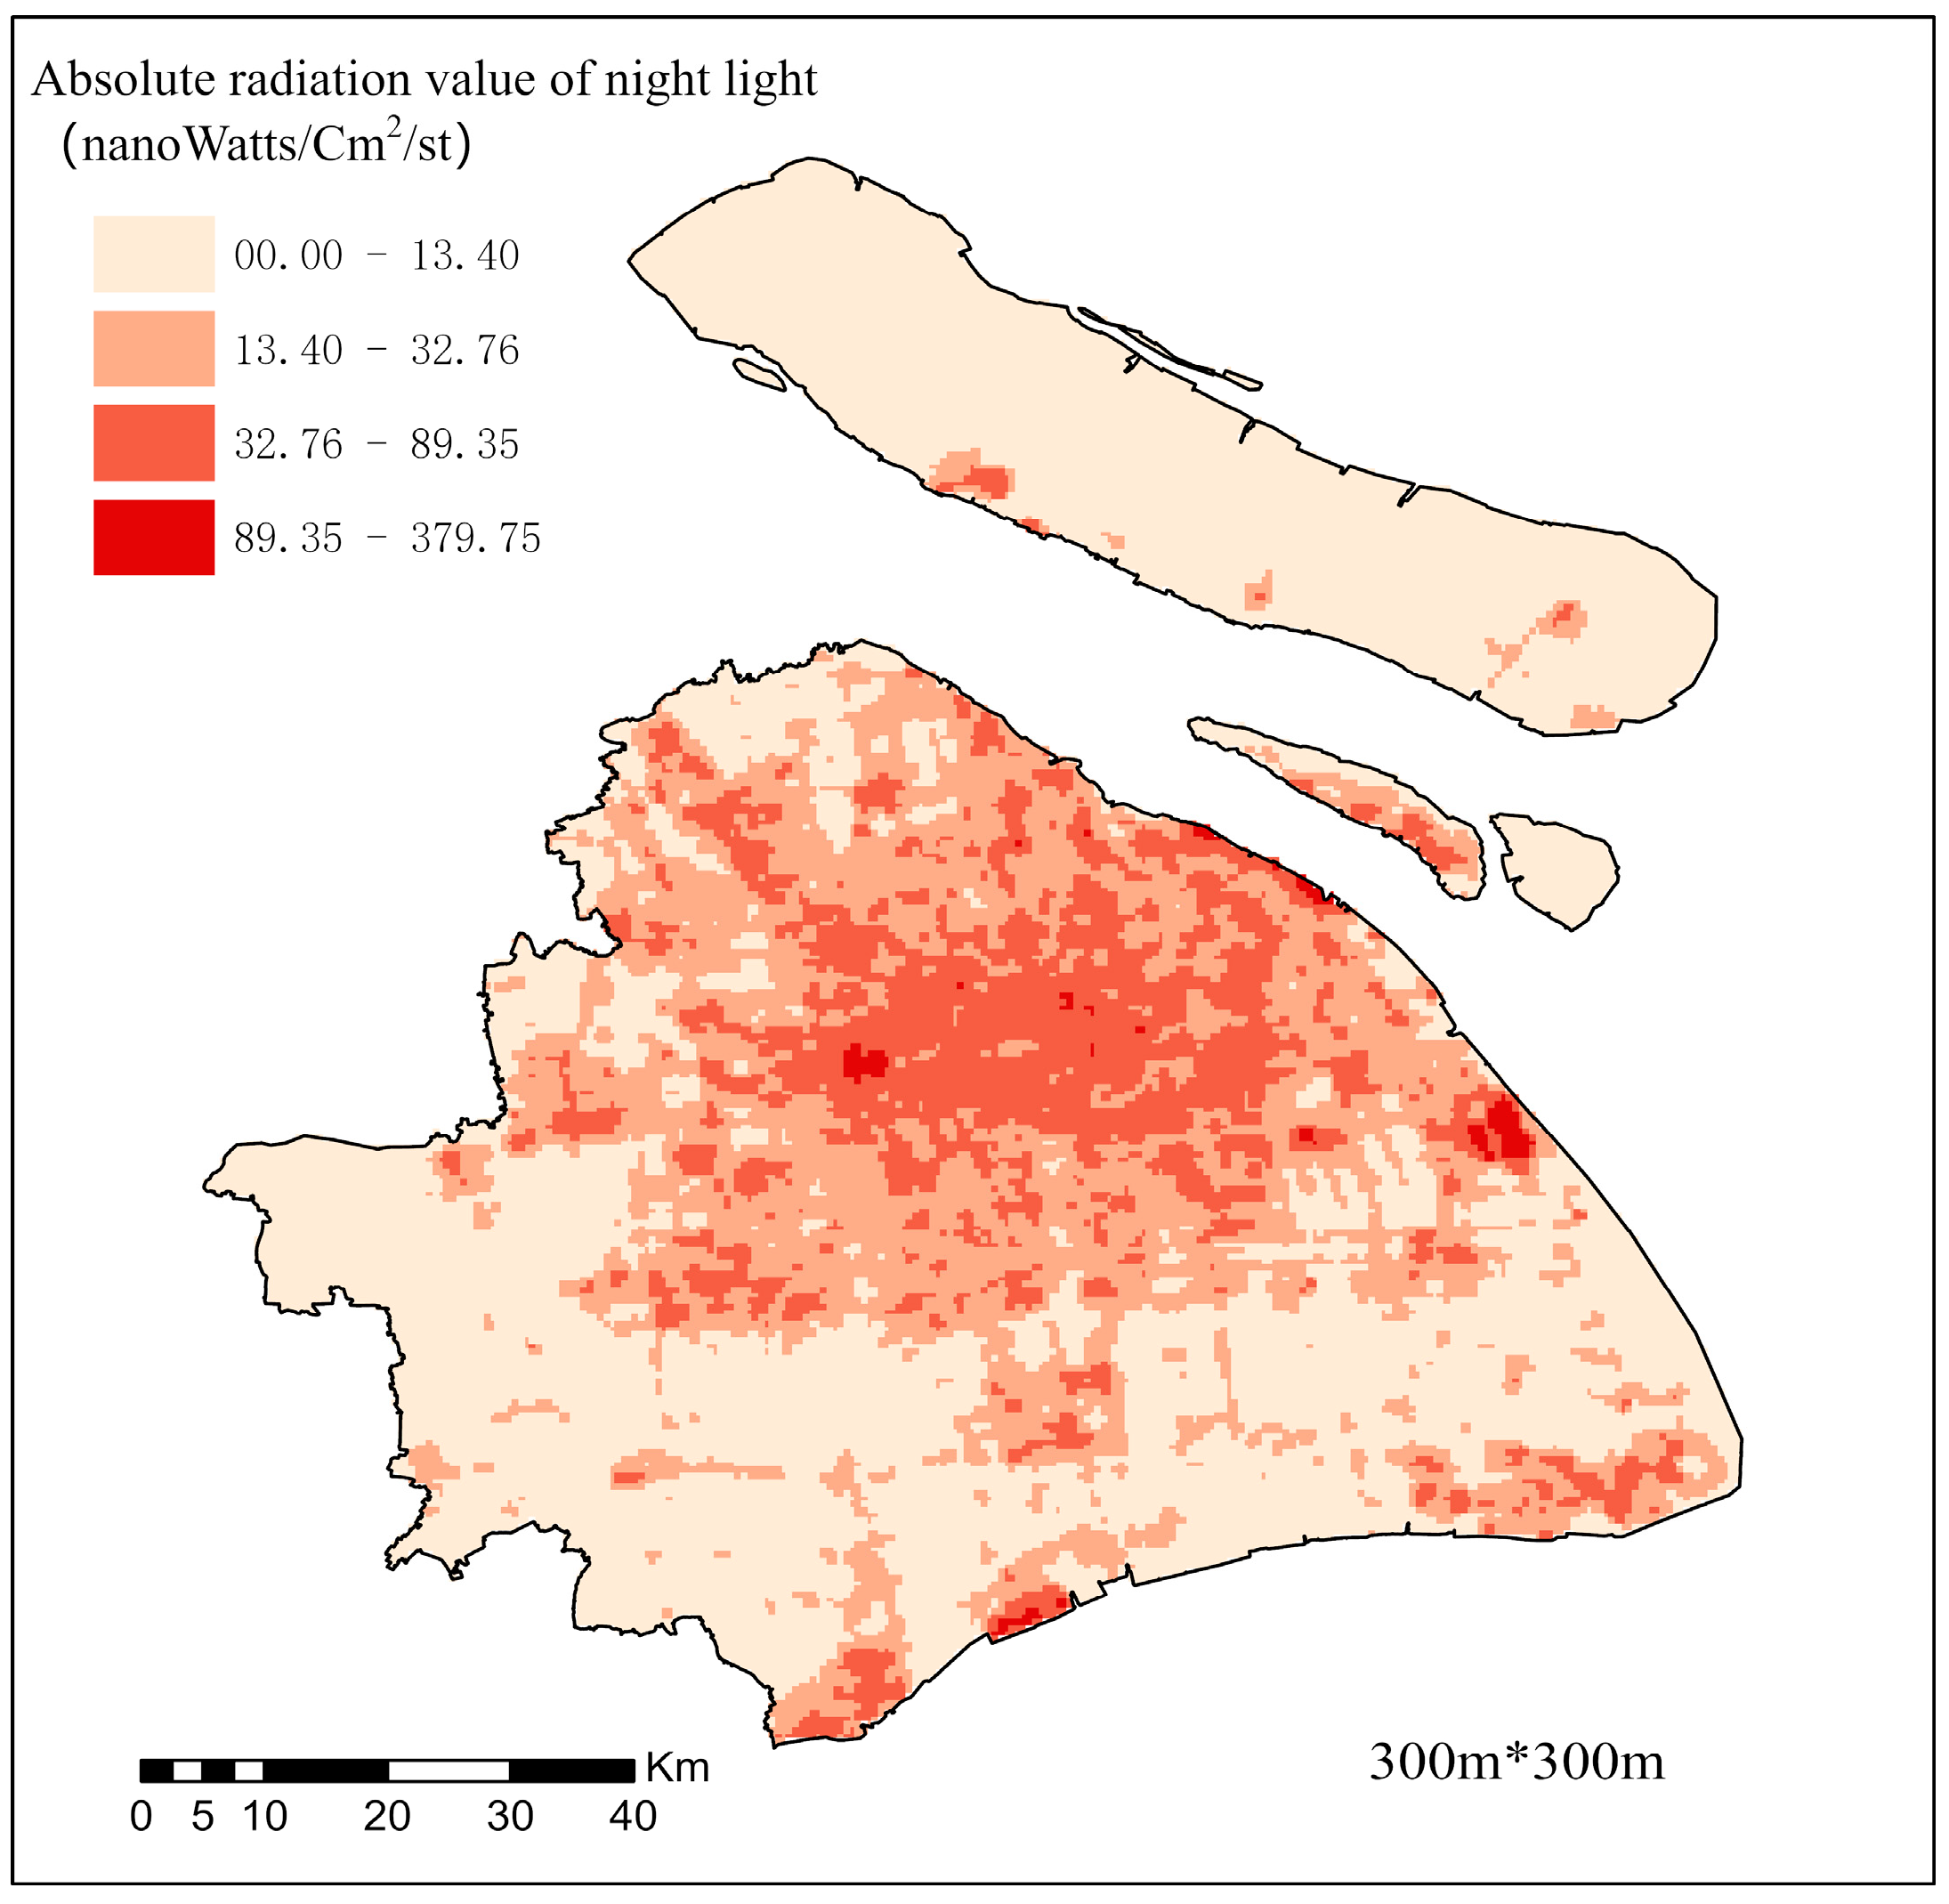
2.2.1. Nighttime Light Remote Sensing Data
Remote sensing data of nighttime light are the data reflecting the distribution of the earth’s nighttime light by using remote sensing images. They are closely related to the economic situation, and have been used to dynamically monitor regional population, GDP and human activity intensity. The average nighttime light index (ANLI) of each subdistrict is calculated according to Formula 1 in this paper, which is used to represent the economic vitality of the subdistrict. The higher the ANLI is, the stronger economic vitality is; the lower the ANLI is, the weaker economic vitality is.
Based on the higher spatial resolution and stronger optical radiation detection capability of NPP-VIIRS data and effectively avoiding the image oversaturation problem [37,38,39,40], this study selected the National Oceanic and Atmospheric Administration annual NPP-VIIRS data as the experimental data (https://payneinstitute.mines.edu/eog/nighttime-lights/, accessed on 15 April 2022) to measure the economic vitality of Shanghai. After comparative analysis, 300 m × 300 m nighttime light images were selected (Figure 2). The study area consisted of 101,778 pixels, which were classified into weak, medium and strong levels by using the natural interruption method (Table 1).
2.2.2. Weibo Check-in Data
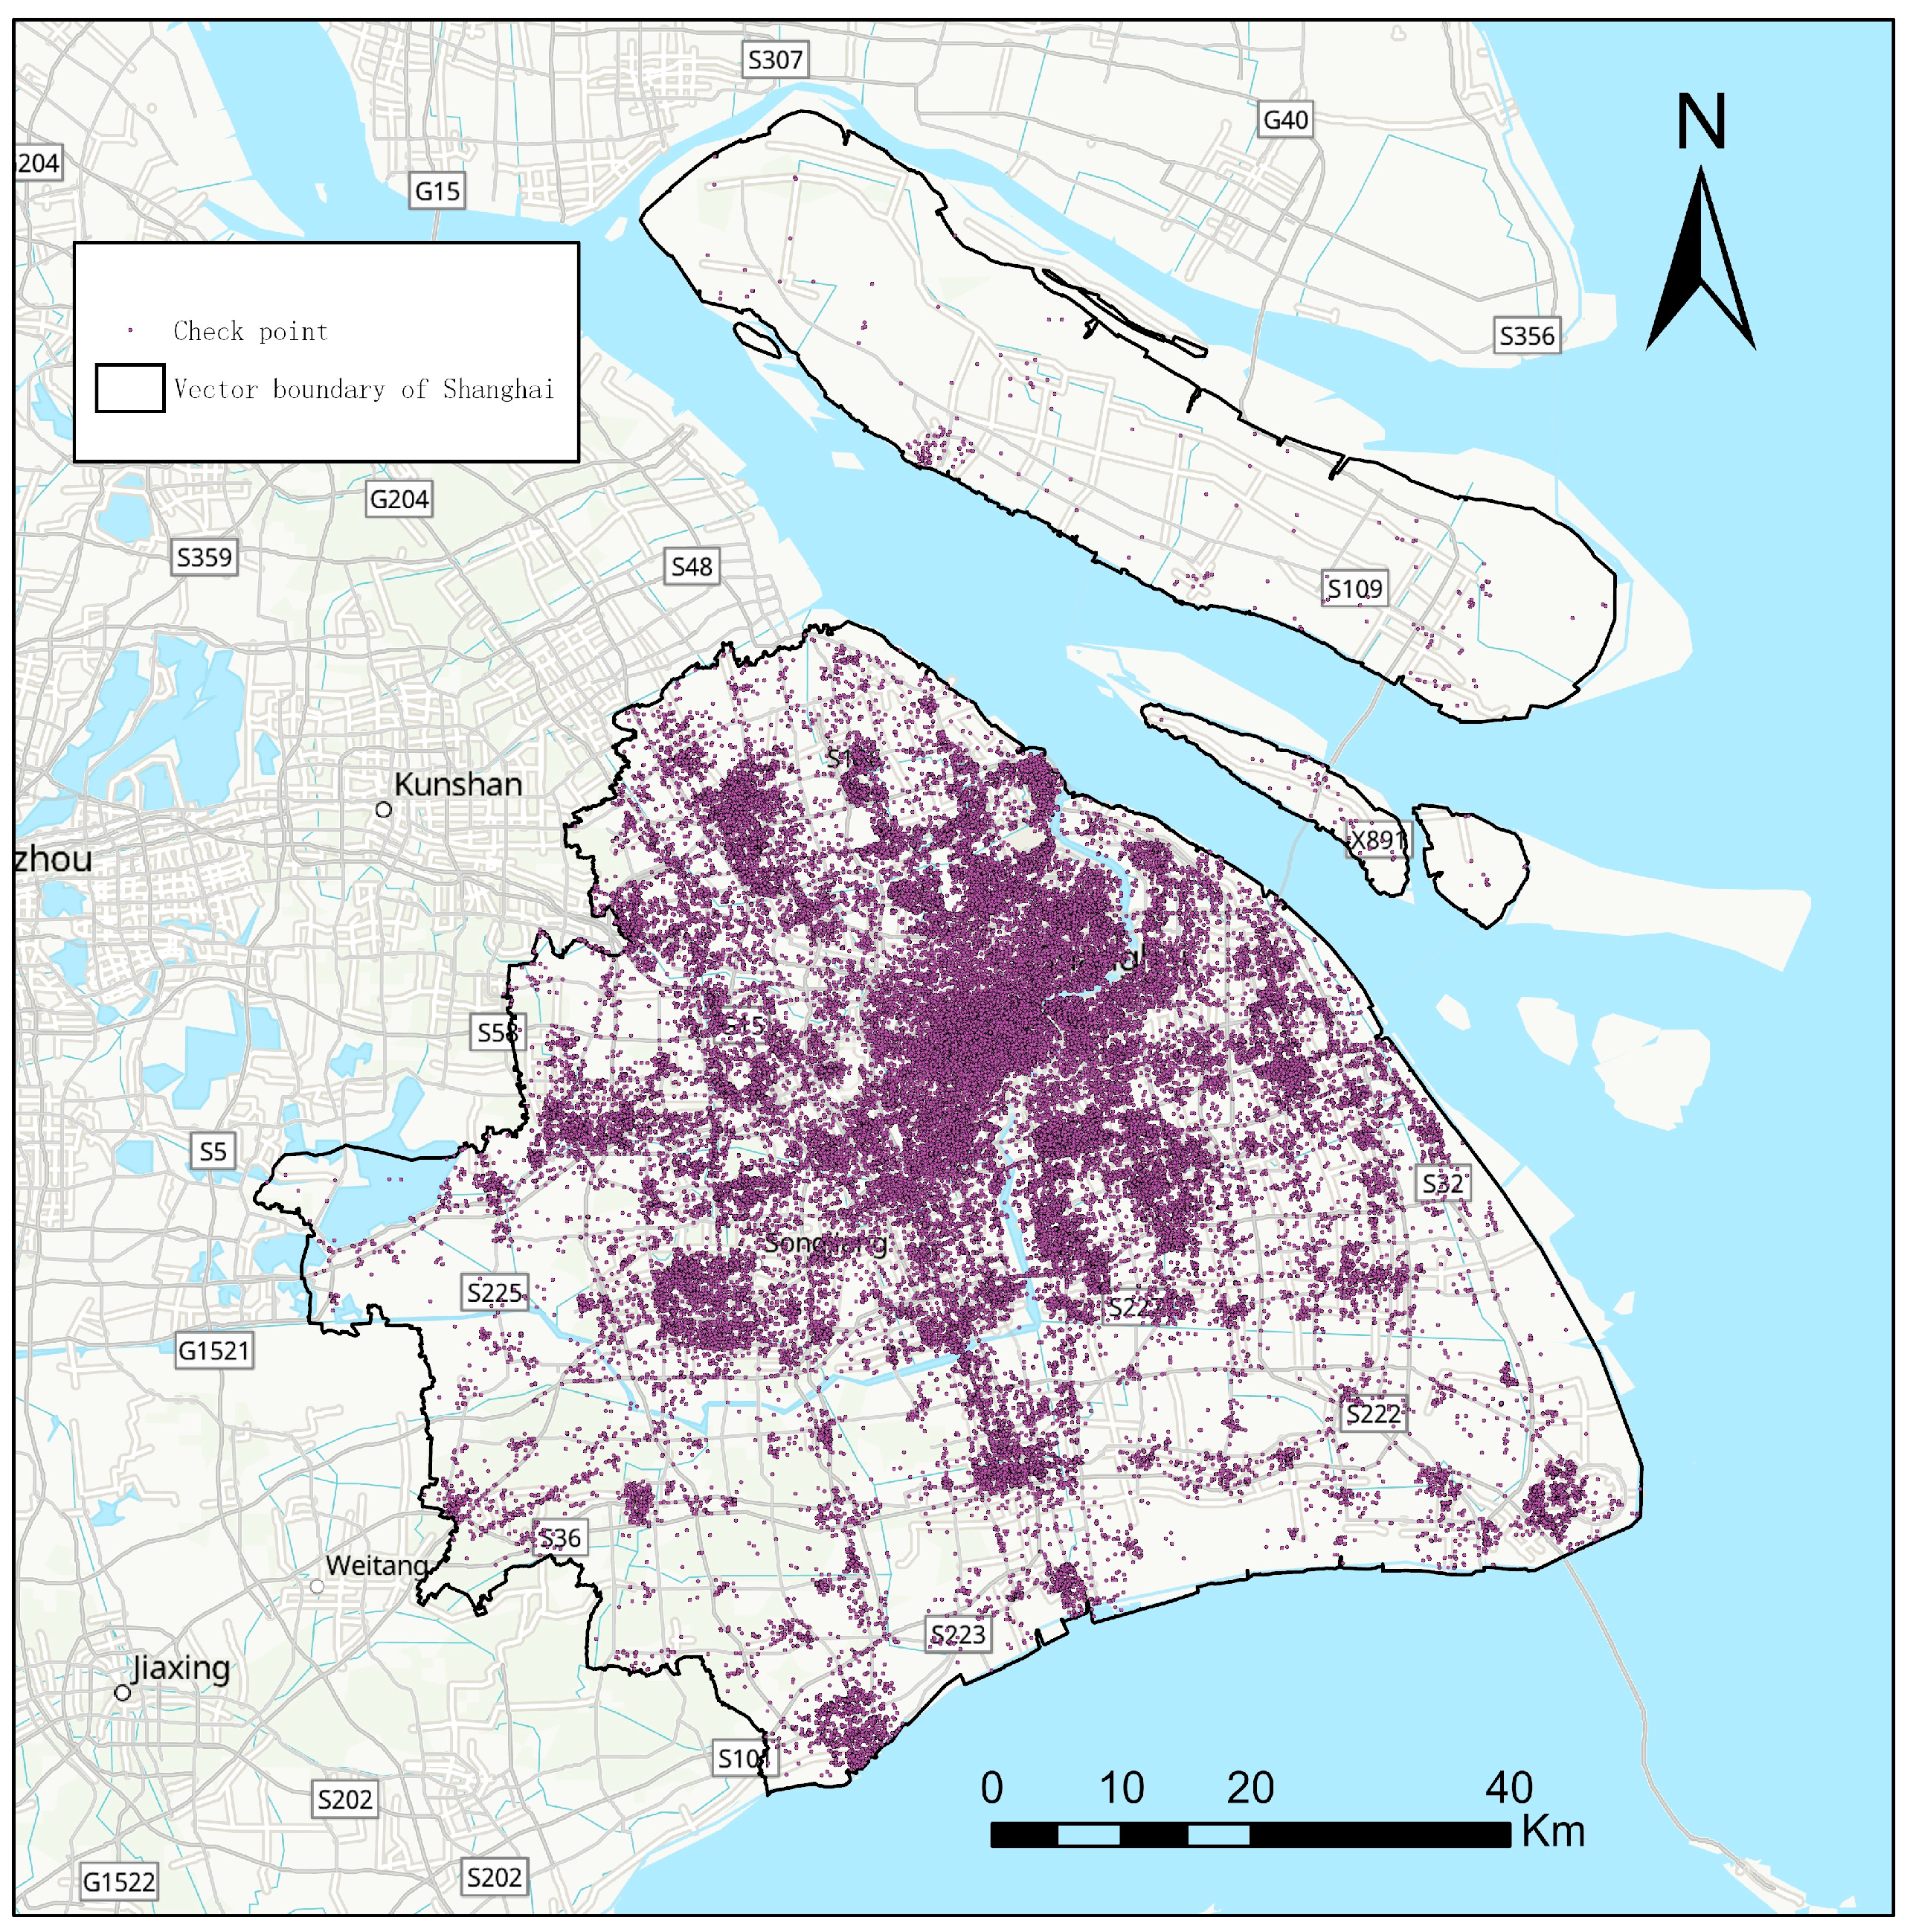
Micro-blog check-in refers to the behavior of recording users’ attendance or participation in activities by punching in. Users can post their location through mobile devices such as mobile phones, laptops, tablets and smartwatches, so that friends and other netizens can see their updates. Check-ins are not restricted by fixed network ports and can reflect residents’ real-time activities in geographical space. Residents’ activities are an important part of social vitality. Therefore, this paper chose Weibo check-ins data as the data source of social vitality. Additionally, Weibo check-in data have certain advantages in terms of accessibility compared with other data forms of social vitality attributes. The feasibility and accuracy of the experiment can be ensured to a certain extent by data cleaning a large number of Weibo check-in data for the experiment. This experiment mainly selected user ID, time, longitude and latitude as the key fields of the crawler [27,41]. According to the latitude and longitude range of Shanghai, 48 points were selected as the center point of the crawler, and the search radius was set as 10,000 m to ensure the full coverage of Shanghai. Considering that people’s travel was limited due to the COVID-19 pandemic in 2020, data before 2020 were used in the study. In addition, due to the different periods of local residents’ and tourists’ travel status differences, this study collected all the data of Shanghai in October 2019 as the research data, which included the activity space of different characteristic days, such as legal holidays (National Day holiday), working days and rest days. Due to the problems of nonstandard format, duplication and redundancy, the check-in data needed to be preprocessed, including transforming the coordinate system (the GCJ02 coordinate system needed to be transformed into the WGS-84 coordinate system); eliminating duplicate records; and excluding data from outside the study area. Finally, a total of 385,902 effective microblog check-in data were obtained (Figure 3, Table 2).
2.2.3. Points of Interest (POI) Data
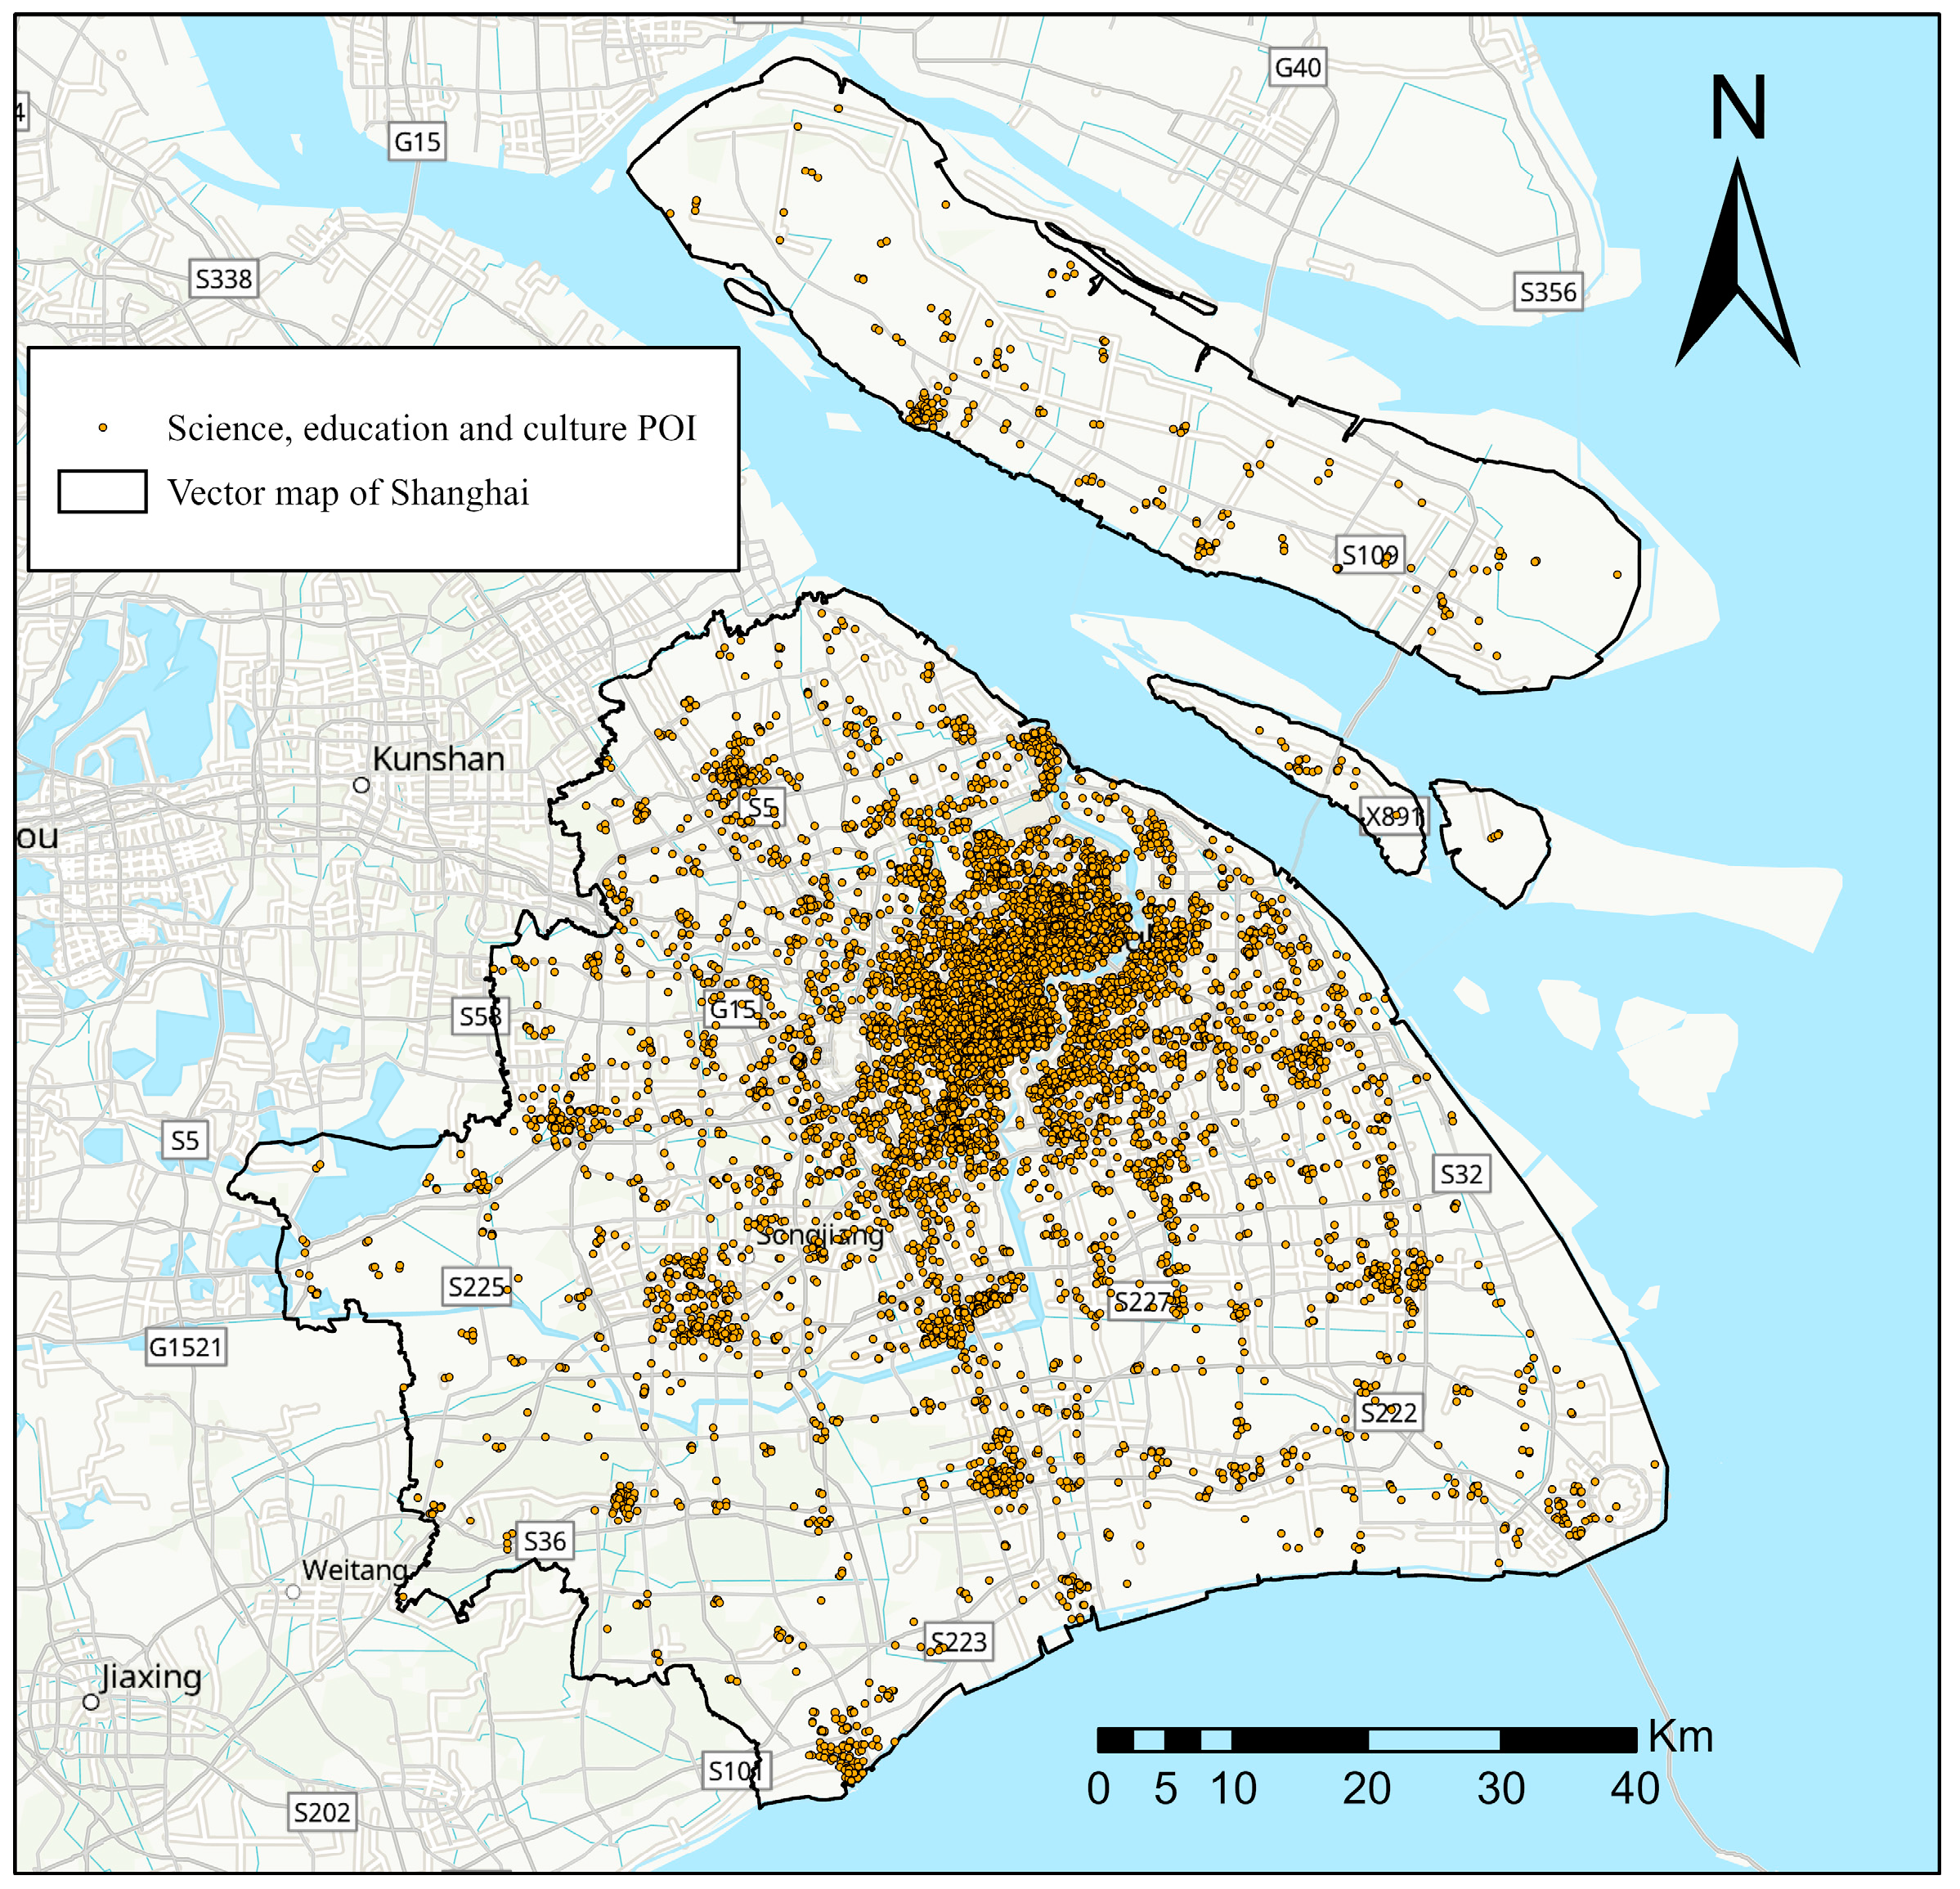
In this study, the POI data of Shanghai in 2019 were retrieved through the API interface of Baidu Map. The POI points were divided into 19 first-level categories and 139 second-level categories by Baidu Map [42,43,44]. The experiment mainly used 14 kinds of POI data. Preprocessing the crawling source data included transforming the coordinate system (the POI points were converted from the BD-09 coordinate system to the WGS-84 coordinate system); converting point data into Shapefile format; excluding the points outside the administrative boundary of Shanghai; deleting duplicate and incomplete information points; and classifying the POI data. Finally, a total of 604,105 effective interest points were obtained. Among them, there were 9872 interest points of science, education and cultural services in Shanghai, including schools, educational institutions, libraries, science and technology museums, art galleries, exhibition halls, etc. The spatial distribution is shown in Figure 4.
2.2.4. Normalized Difference Vegetation Index (NDVI) Data
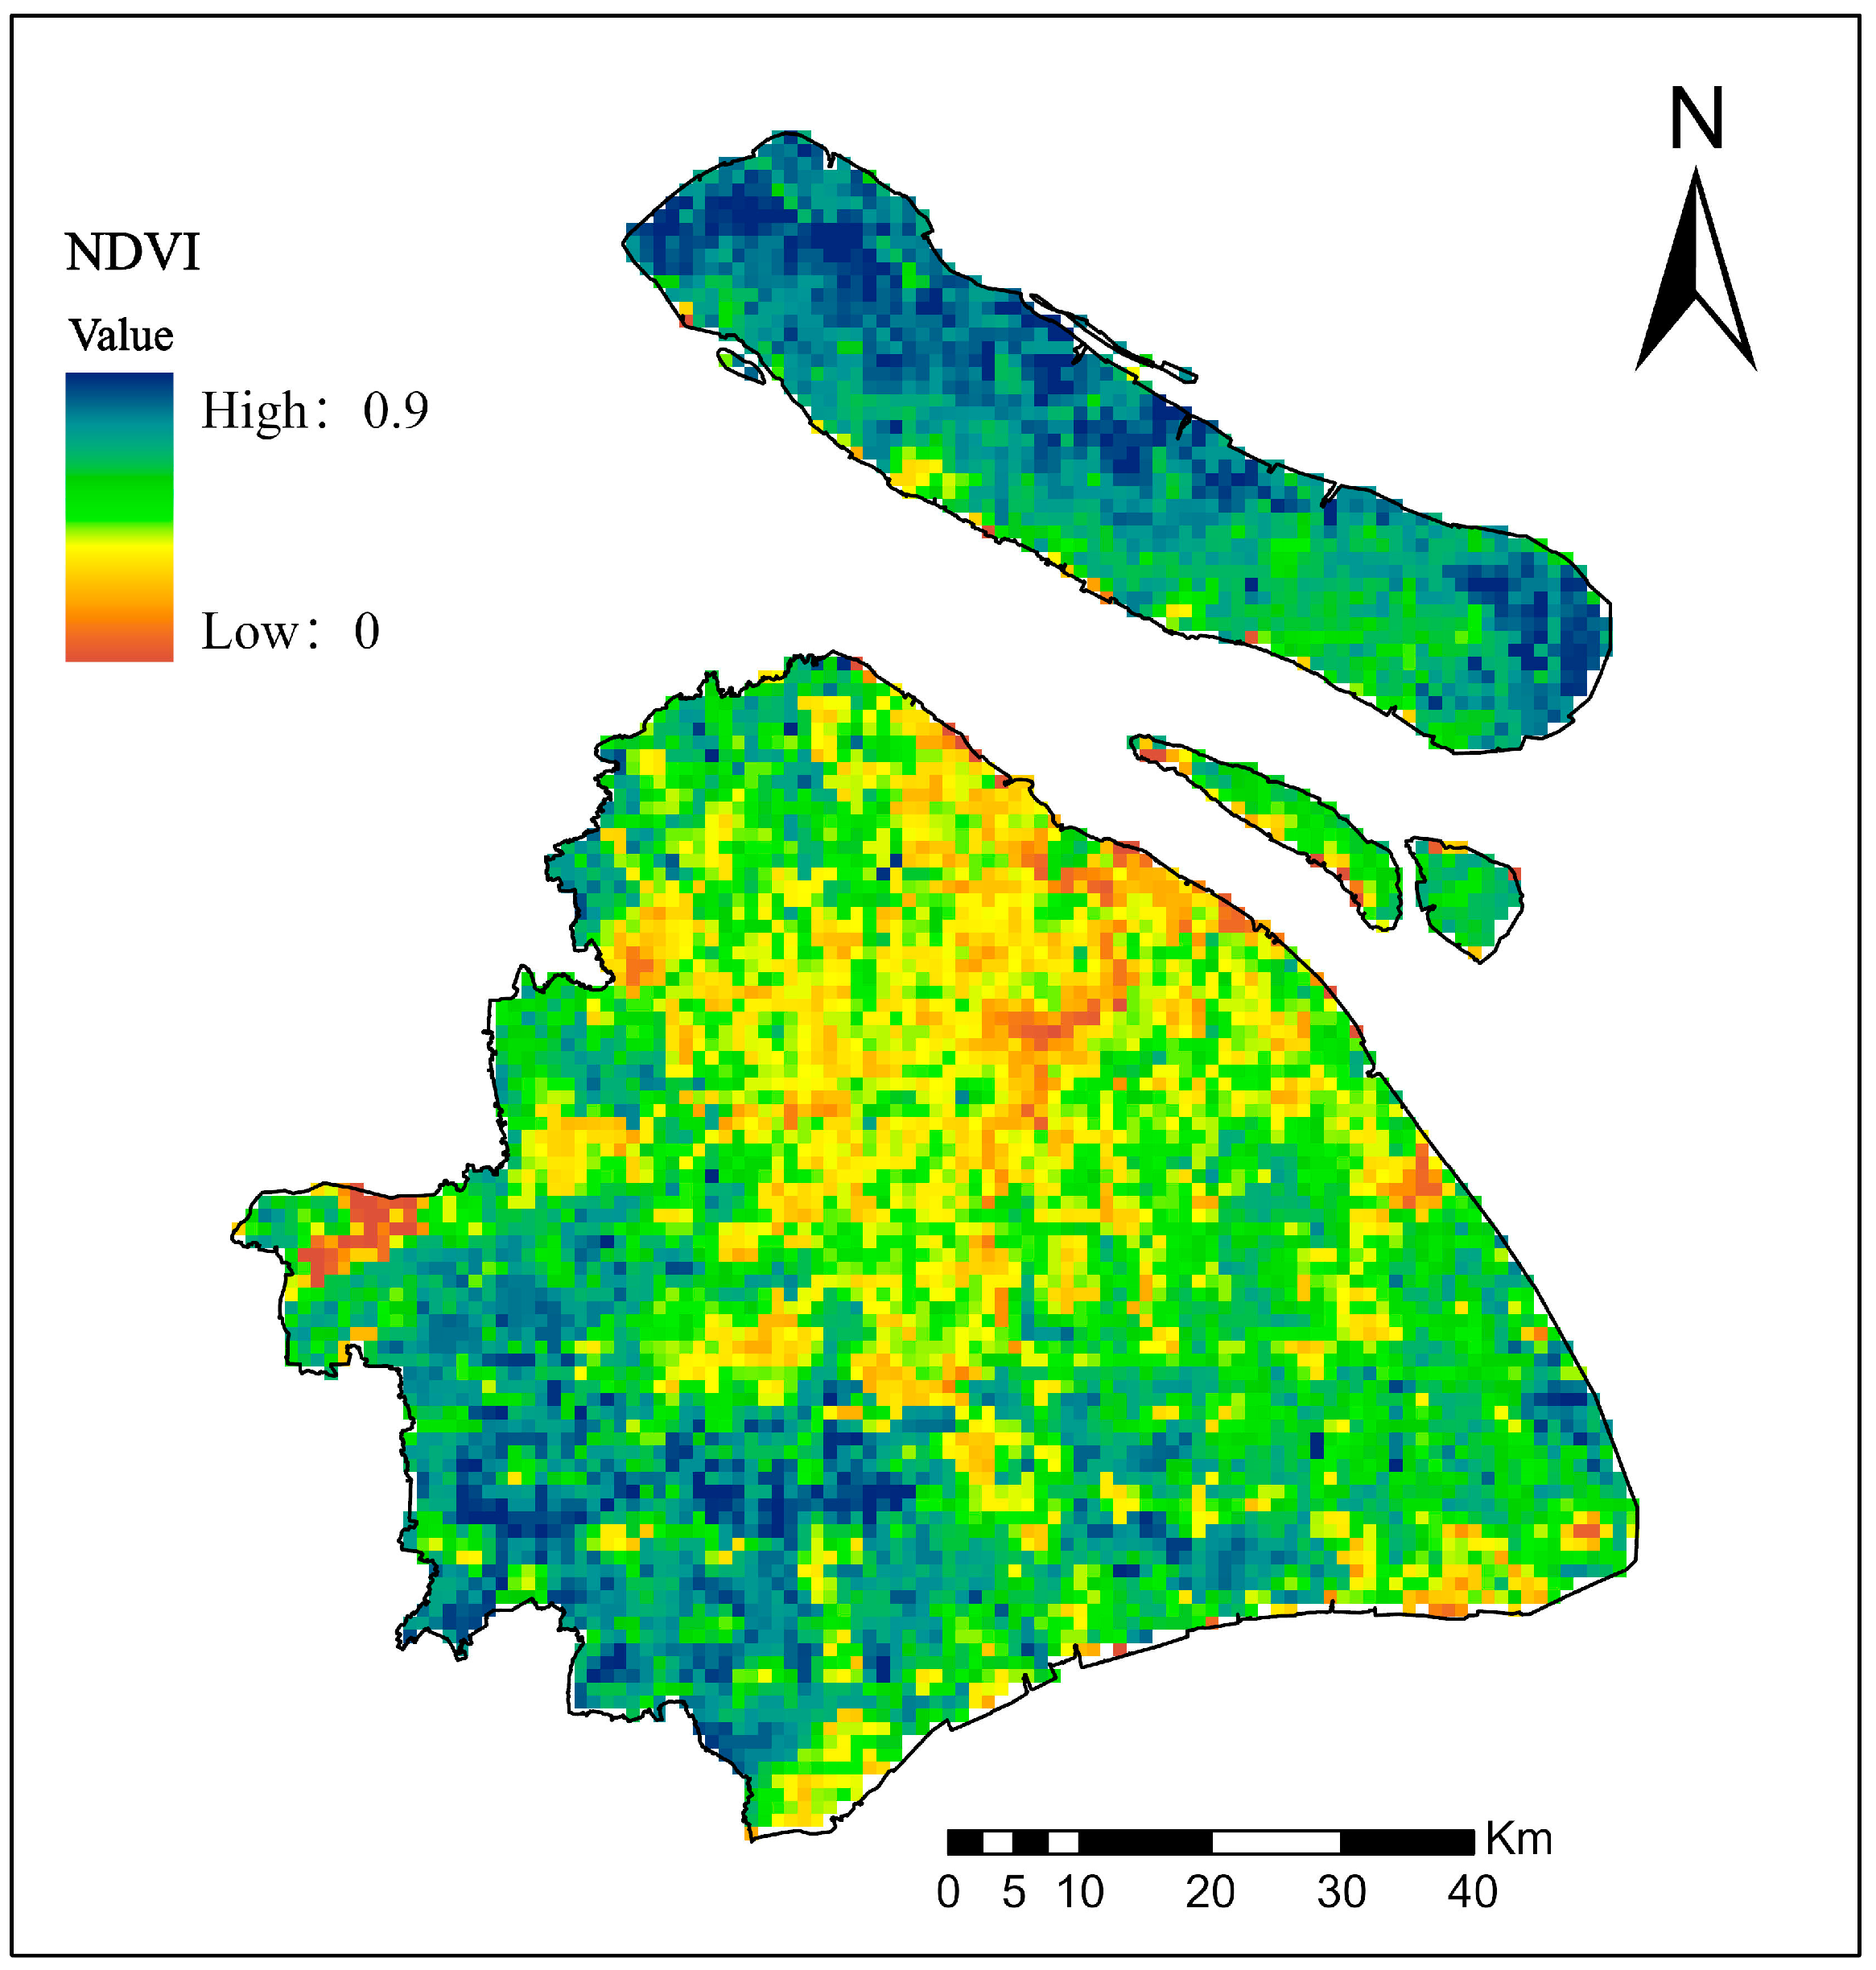
NDVI is an important index representing vegetation cover and its growth vigor. It is a data set based on remote sensing images through which vegetation growth can be judged. In order to measure the urban ecological environment at the micro level, NDVI was selected as the representation of urban ecological vitality. According to Formula 4, the average standardized vegetation index EV of each subdistrict was calculated to represent the ecological vitality of the subdistrict. The higher the EV value was, the stronger the ecological vitality was; the lower EV value was, the weaker the ecological vitality was. The NDVI data used in this study were obtained from the Resource Environment and Data Center, Institute of Geographical Sciences and Natural Resources, Chinese Academy of Sciences (URL: https://www.resdc.cn/Default.aspx, accessed on 8 May 2022). The 2019 annual 1 km vegetation index spatial distribution dataset in China was selected as the data source for describing urban ecological vitality in this study, which was generated using the maximum value synthesis method based on monthly data. The dataset was first loaded into ArcGIS software and cropped using the NDVI remote sensing image within Shanghai according to the administrative boundary vector layer of Shanghai (Figure 5). Since there is no snow and ice area in Shanghai, there was no negative value for NDVI, and the value range was [0, 0.9].
2.3. Methodology
2.3.1. Measures of Economic Vitality
In this study, the average nighttime light index (ANLI) was used to indicate the strength of economic vitality. The calculation formula is as follows:
where ANLI is the average nighttime light index in the subdistrict, is the nighttime light radiation value of the ith image element in each subdistrict and n is the number of image elements in the subdistrict. Using the zoning statistics tool in ArcGIS software, the ANLI of each subdistrict was calculated, with a higher ANLI representing stronger economic vitality and a lower ANLI representing weaker economic vitality.
2.3.2. Measures of Social Vitality
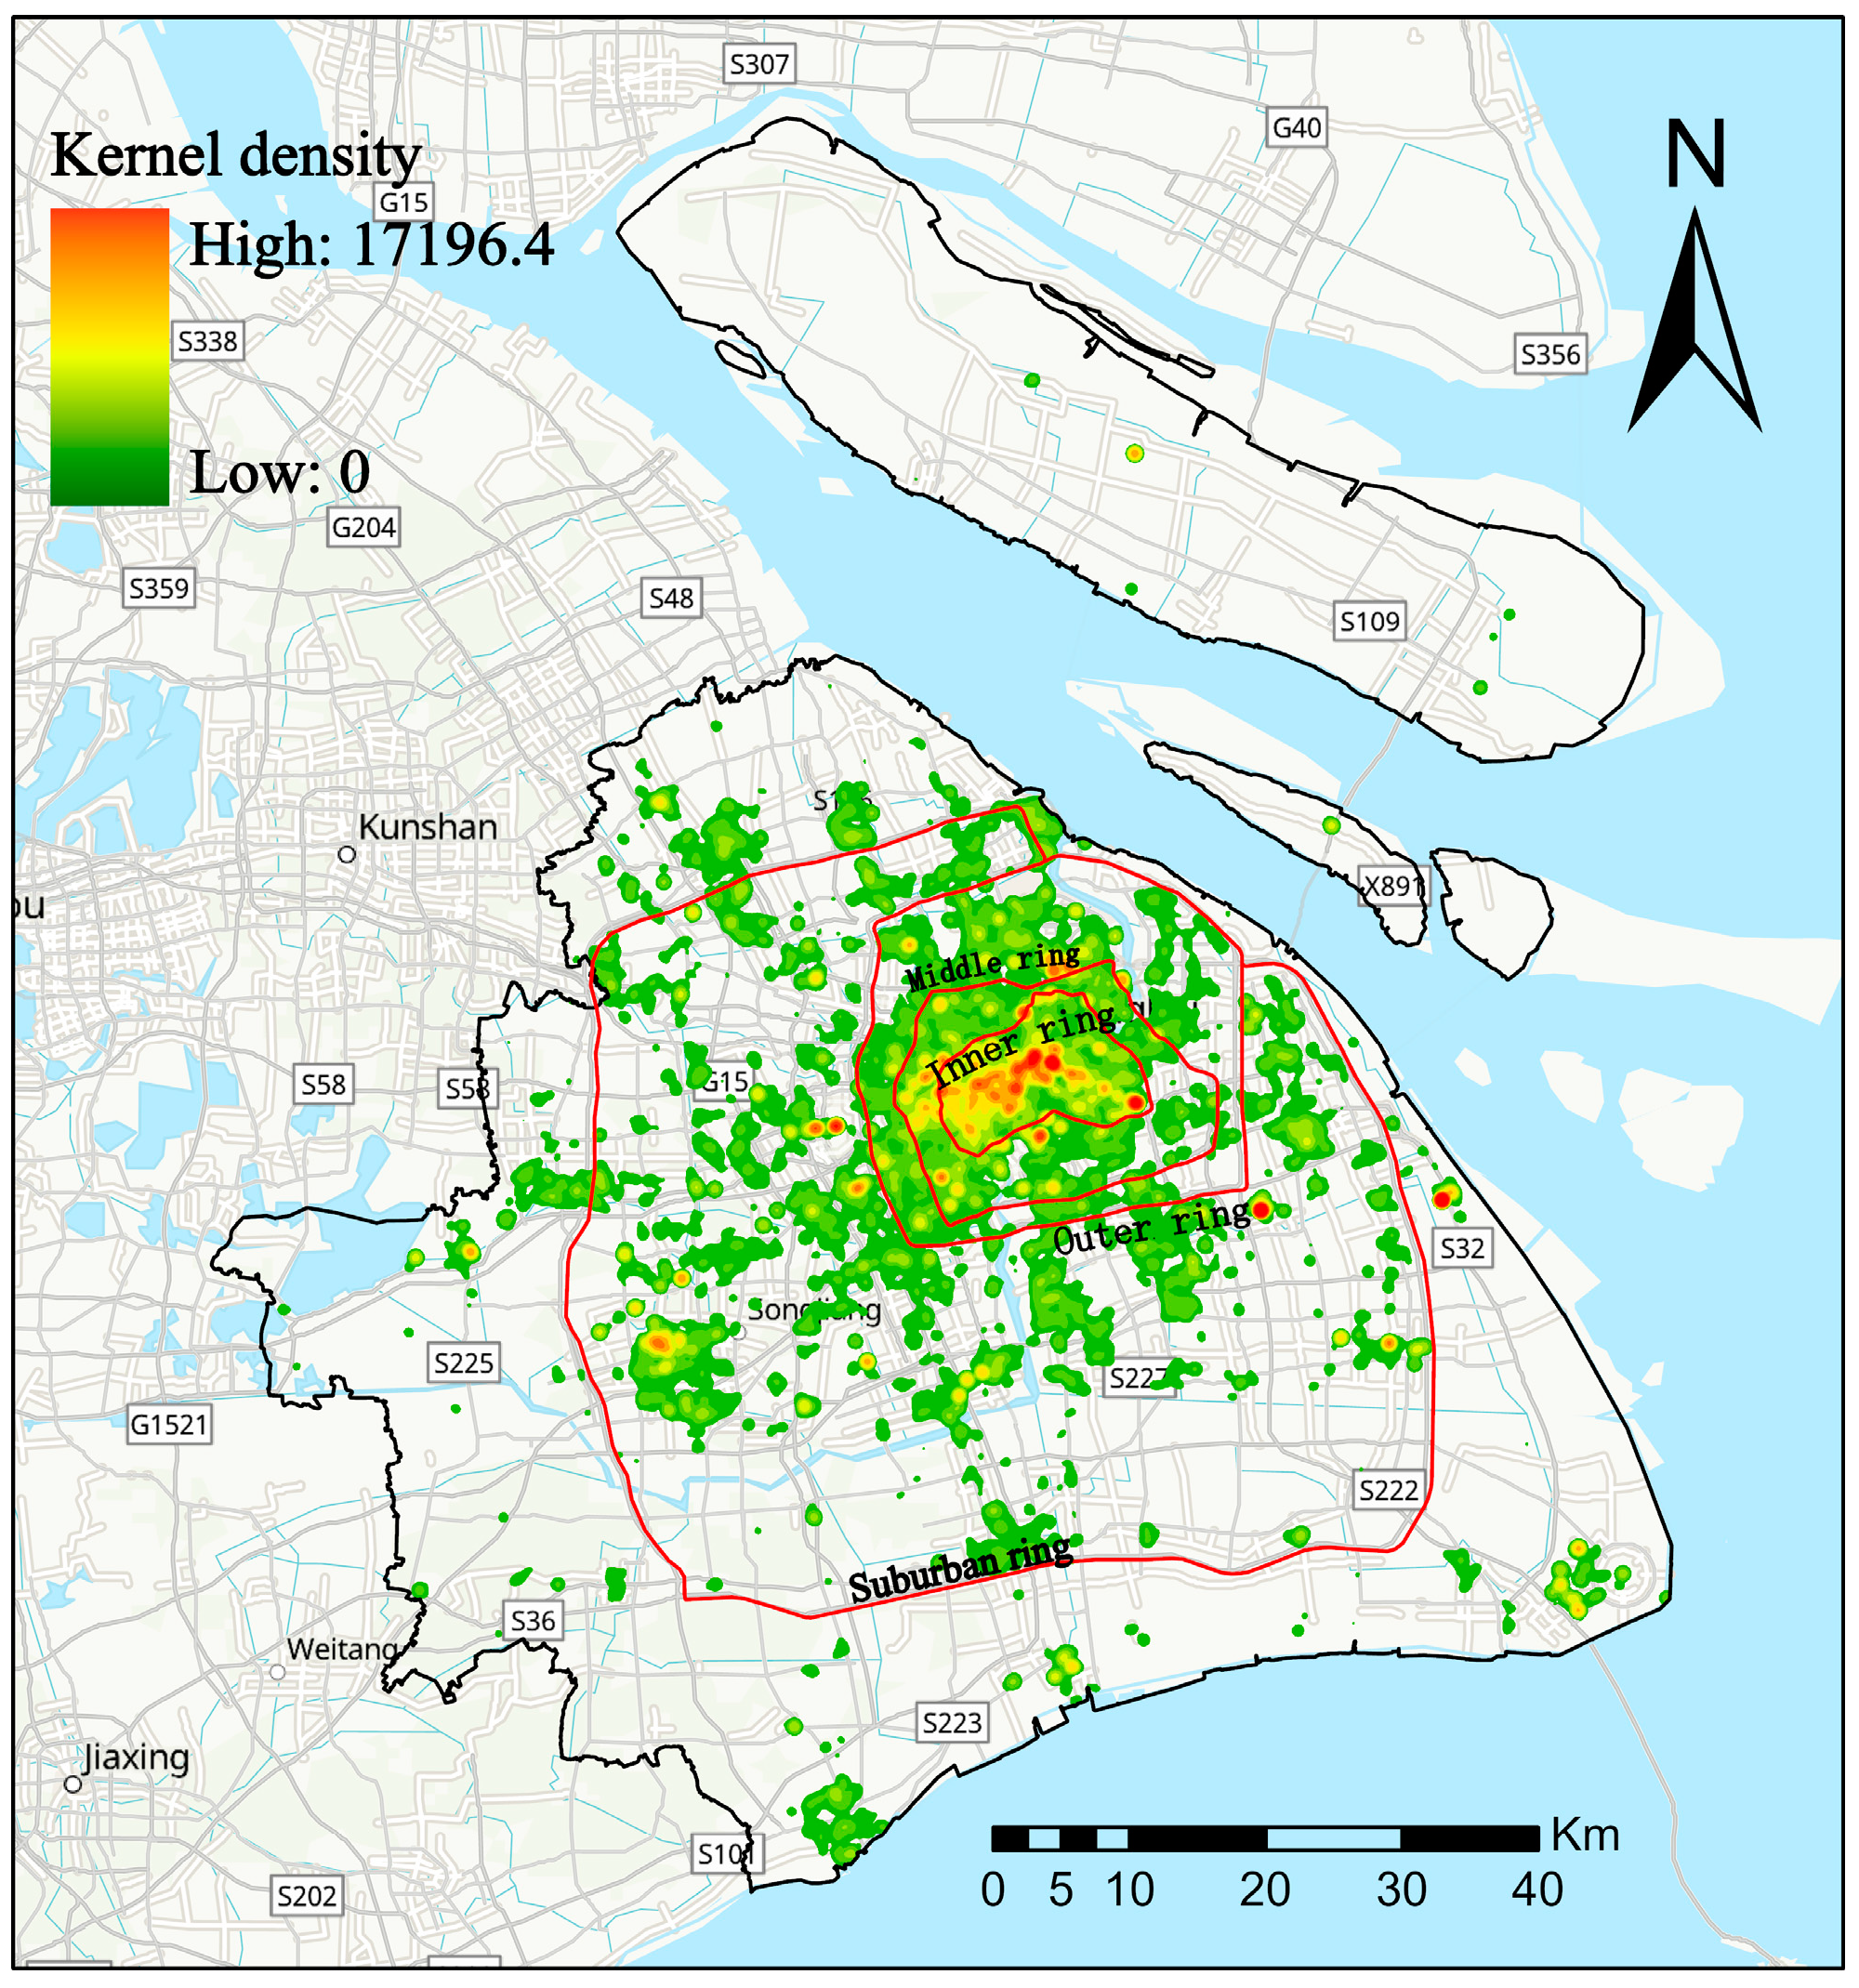
Check-in refers to the act of recording one’s attendance or participation in an event by punching a clock. With the popularity of location-based services (LBS) applications, online check-ins have become popular. Check-in is not restricted by fixed network ports and can reflect the real-time activities of residents in geographic space. Resident activities are an important part of social vitality [45,46,47]. This study selected Weibo check-in data as the data source to measure urban social vitality. In view of the obvious differences between the absolute number of Weibo check-in points and the density of Weibo check-in points in different regions, to measure the social vitality of Shanghai at a more microscopic scale, kernel density analysis was carried out on the check-in point data to calculate the density of the crowd check-in points in their neighborhoods. The calculation formula of kernel density is:
where f(x) is the kernel density at , is the bandwidth, n is the number of known elements in the bandwidth, k is the weighting factor and is the ith element in the bandwidth. The higher the average kernel density value was, the stronger the social dynamics, and the lower the average kernel density value was, the weaker the social dynamics.
According to relevant studies and data characteristics of this study, 750 m was chosen as the search radius of this experiment. The smaller the grid is, the smoother the surface of the obtained kernel density map. However, too many grids will affect the analysis efficiency. Therefore, 30 m × 30 m was selected as the size of raster pixels to generate the thermal map of check-in data (Figure 6).
2.3.3. Measures of Cultural Vitality
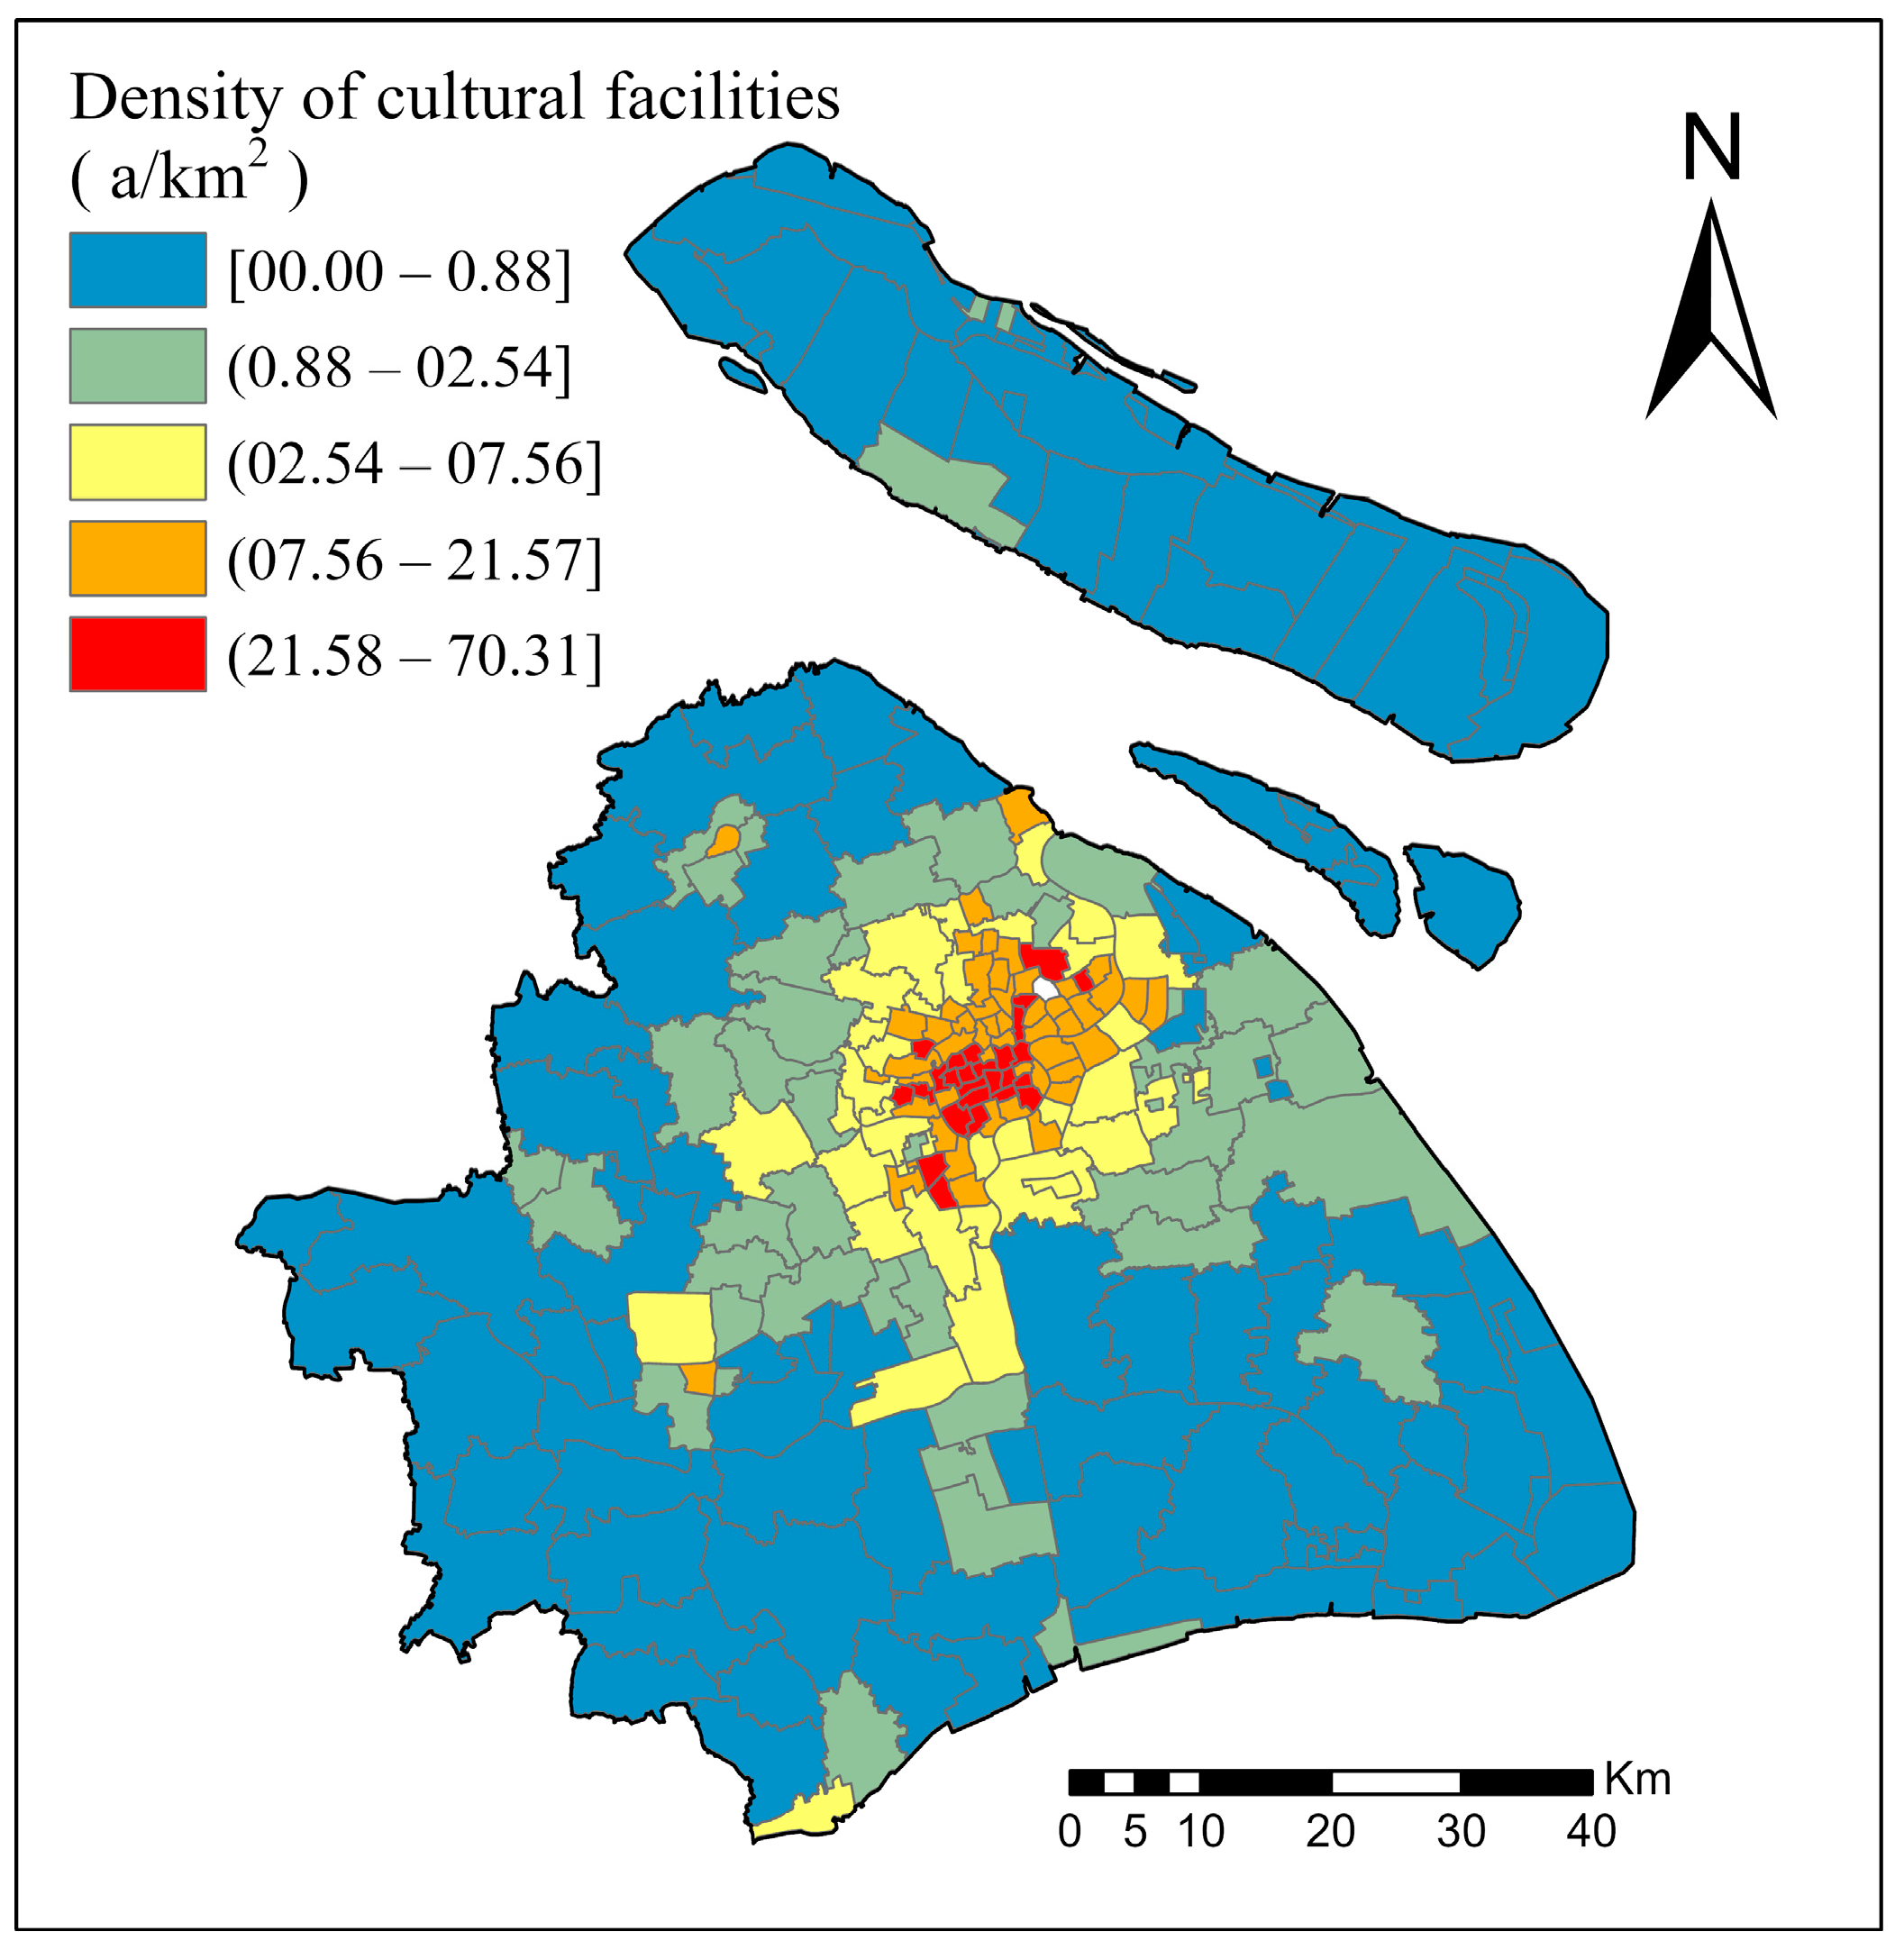
To further explore the cultural vitality of different subdistricts, the number of cultural facilities per unit area of each subdistrict was calculated, namely, the density of cultural facilities (DCF), to represent the cultural vitality of the subdistrict. The calculation formula is:
where DCF is the density of cultural facilities; is the number of cultural facilities in the ith subdistrict; and is the area of the ith subdistrict. According to the natural interruption method, cultural vitality can be divided into five levels: weak, subweak, medium, substrong and strong (Figure 7).
2.3.4. Measures of Ecological Vitality
The normalized difference vegetation index (NDVI) is an important index representing vegetation cover and growth vitality [48,49]. To measure the status of the urban ecological environment at the micro level, the NDVI was chosen as the representation of urban ecological vitality. The calculation formula is as follows:
where is the standardized difference vegetation index of the ith pixel in each subdistrict and n is the number of pixels in the subdistrict. The average standardized vegetation index (EV) of each subdistrict, which represents ecological vitality, was calculated using the zoning statistical tool in ArcGIS software. The higher the EV value was, the stronger the ecological vitality, and the lower the EV value was, the weaker the ecological vitality.
2.3.5. Measurement Method of Urban Comprehensive Vitality
Based on the measurement of the city’s economic, social, cultural and ecological vitalities, the comprehensive vitality at the subdistrict level of Shanghai was calculated. To ensure the objectivity of the experiment, the entropy weight method was chosen to measure the comprehensive vitality of each subdistrict in Shanghai. The entropy weight method was used to determine the weight according to the degree of index variation, which is a common method of objective weighting [50,51]. The calculation steps of the entropy weight method are as follows:
(1) The range method is used to standardize the index data, and the calculation formula is:
where i represents each subdistrict in Shanghai, j represents the measurement index, and represent the original and normalized vitality values, respectively, and max ) and min ( represent the maximum and minimum values in the original dataset, respectively.
(2) Calculate the information entropy of each measurement index ;
where
(3) Calculate the weight of each measurement index
where m is the number of evaluation indicators.
(4) Calculate the comprehensive vitality of each subdistrict. Using the standardized index data and the comprehensive weight , the comprehensive vitality value of each subdistrict was calculated using the multiobjective linear weighted summation method. The calculation formula is as follows:
2.3.6. Analysis Method of Influencing Factors
Selection of Influencing Factors
Considering the internal characteristics and external environment of urban subdistricts in Shanghai from seven dimensions, including location, spatial form, functional form, population character, traffic accessibility, infrastructure construction intensity and commercial services, a total of 14 influencing factors were selected (Table 3).
Analysis Method of Influencing Factors
(1) Correlation analysis
The range method was selected to normalize the original data of each index. The Pearson correlation coefficient was used to explore the correlation between urban comprehensive vitality and influencing factors. The calculation formula of the Pearson correlation coefficient is , where 0 < |r| ≤ 0.1 or less indicates a weak correlation; 0.1 < |r| ≤ 0.3 or less indicates a low-grade relationship; 0.3 < |r| ≤ 0.5 or less indicates a moderate correlation; 0.5 < |r| ≤ 0.8 or less indicates a highly relevant correlation; 0.8 < |r| < 1 indicates a significant correlation; and |r| = 1 indicates a completely relevant correlation [52,53].
(2) Regression analysis
(i) OLS regression analysis
To further explore the quantitative relationship between independent variables and dependent variables, regression analysis was conducted on urban vitality and influencing factors. Ordinary least squares (OLS) is a linear regression method whose basic principle is to find the best functional match of data by minimizing the sum of squares of errors [54,55,56]. When there are multiple potential explanatory variables, it is difficult to find a correctly specified OLS model, and exploratory regression simplifies the process. Exploratory regression analyses diagnose and evaluate all possible combinations of independent variables, increasing the chance of finding the best model. Therefore, before OLS regression analysis, exploratory regression analysis was conducted on independent variables and dependent variables, and a multicollinearity test was conducted on the data. In the above correlation analysis, it was found that there is no linear correlation between urban vitality and fractal dimension, so this factor is first eliminated. The variance inflation factor (VIF) value was eliminated in order from high to low (Table 4). When the three factors of functional density, commercial facility density and road network density were removed, it was found that collinearity no longer existed, so the remaining 10 factors were taken as the influencing factors of urban vitality.
(ii) Spatial lag model
Since the OLS model is a global regression analysis, it does not take into account the spatial variability of urban vitality, which easily leads to analysis results with high accuracy in some regions and large bias in others. To incorporate spatial correlation into the regression model, this study adopted the spatial lag model (SLM) and spatial error model (SEM) in the spatial autoregressive model to further analyze the influencing factors of urban vitality.
The SLM is a regression model that considers spatial correlation, in which the dependent variable in space is related not only to the independent variable on the same object but also to the dependent variable on neighboring objects [57,58,59]. The expression of the model is:
where is the dependent variable, is the matrix of exogenous explanatory variables, is the spatial effect coefficient, is the error term, is the regression coefficient to be estimated, W is the spatial matrix and denotes the spatial correlation between individual i and individual j.
(iii) Spatial error model
SEM is a regression model that considers the spatial correlation of random disturbance terms (error terms). It describes the spatial disturbance correlation and spatial overall correlation; that is, the dependent variable on a spatial object is related to the independent variable on the same object and to the independent variable and dependent variable of adjacent objects [60,61,62]. The expression of the SEM is:
where λ is the spatial error correlation coefficient, is the spatial weight matrix and represents the correlation between the jth and ith cross-section individual error terms.
3. Results
3.1. Economic Vitality
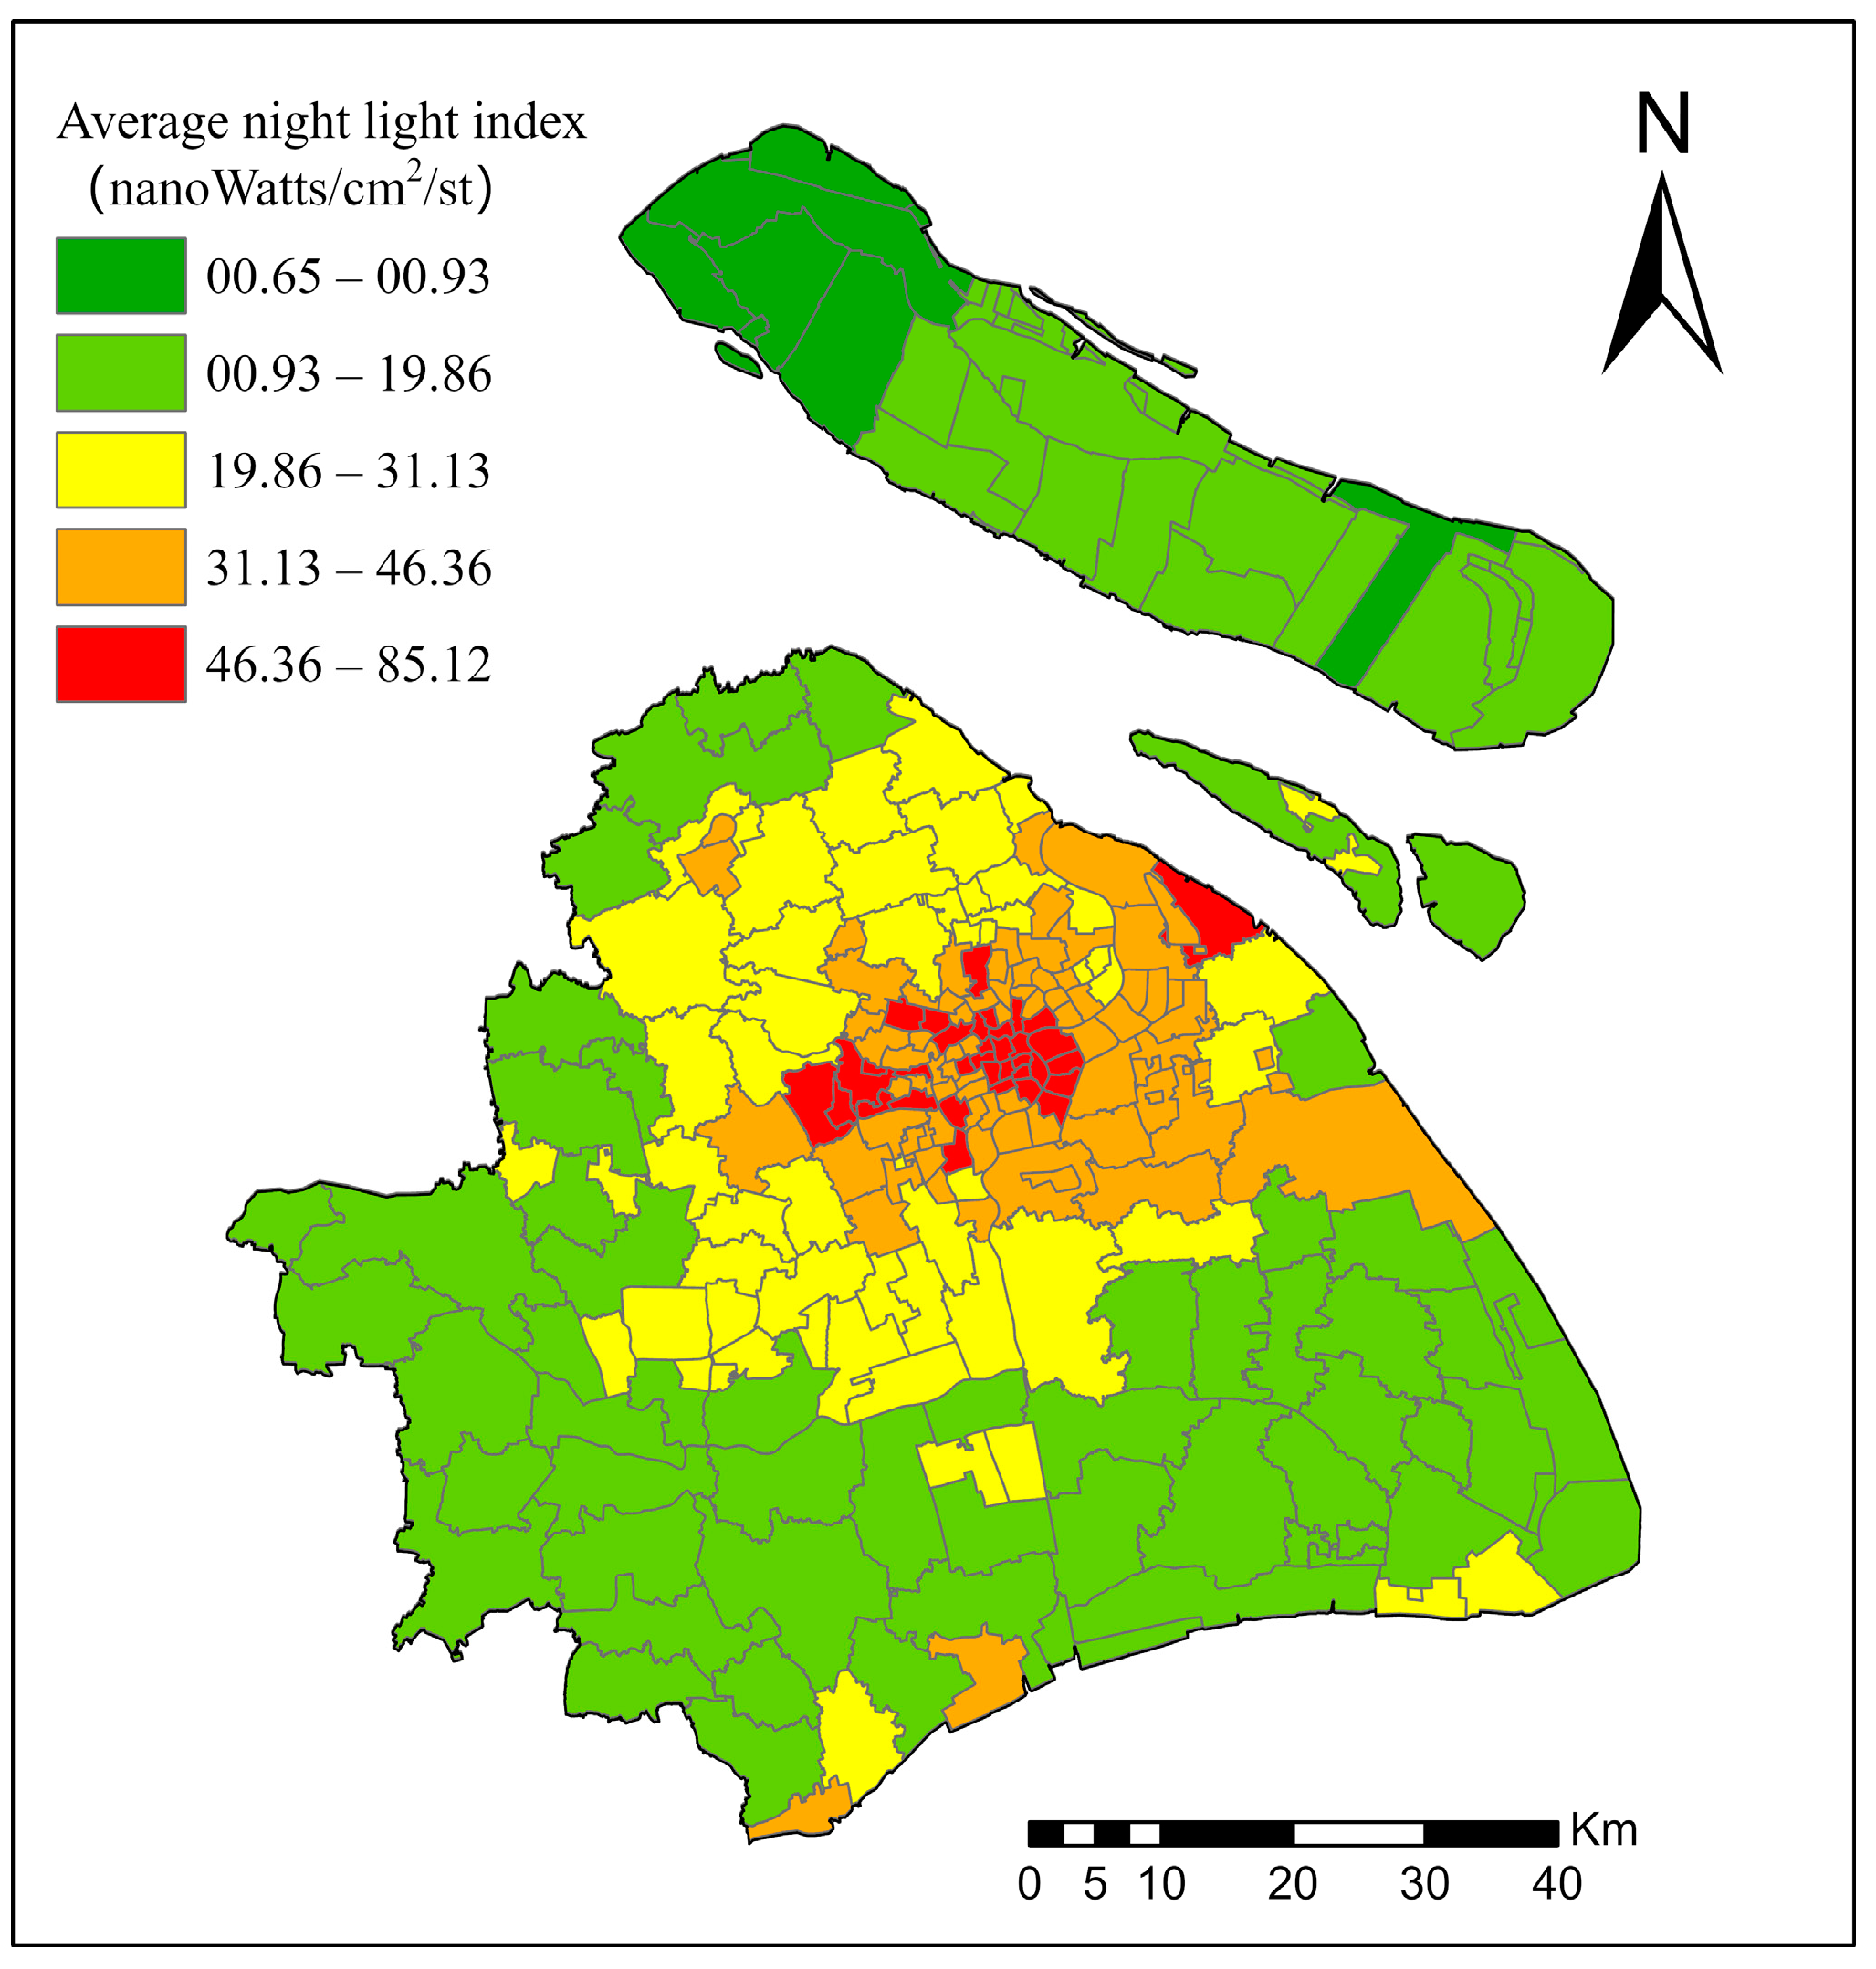
It was found that the economic vitality of Shanghai’s subdistricts differed significantly, with the lowest value of ANLI being 0.65 and the highest value reaching 85.12. According to the natural interruption method, 9.93, 19.86, 31.13 and 46.36 were selected as interruption values, and the economic vitality was divided into five levels (Figure 8). The economic vitality of each subdistrict in Shanghai was characterized by strong central subdistricts and weak peripheral subdistricts. Among all the subdistricts in the city, the number of strong, substrong, medium, subweak and weak economic vitality subdistricts accounted for 14.78%, 31.74%, 22.17%, 11.74% and 19.57%, respectively (Table 5).
It can be seen from Figure 9 that: (1) most of the subdistricts outside the suburban ring of Shanghai belong to the two classes of weak and subweak economic vitality areas; only eight subdistricts and towns, such as Shanyang town, Yingpu subdistrict and Luchaogang town, belong to the medium economic vitality areas; and a total of five subdistricts and towns, such as Petrochemical subdistrict, Linhai community, Jiading town, Jiading Industrial Park and Chuansha new town, belong to the substrong economic vitality areas. (2) Areas with strong economic vitality and substrong economic vitality are mainly located in the central city. Among them, 62.5% of all the subdistricts within the inner ring are strong economic vitality areas, and 37.5% are substrong economic vitality subdistricts. (3) Among all the subdistricts between the inner ring and middle ring, 34.37% are strong economic vitality subdistricts, 62.5% are substrong economic vitality subdistricts and the other one is a medium economic vitality subdistrict. (4) Among all the subdistricts between the middle ring and outer ring, 10.52% are strong economic vitality subdistricts, 63.16% are substrong economic vitality subdistricts and 26.32% are medium economic vitality subdistricts.
3.2. Social Vitality
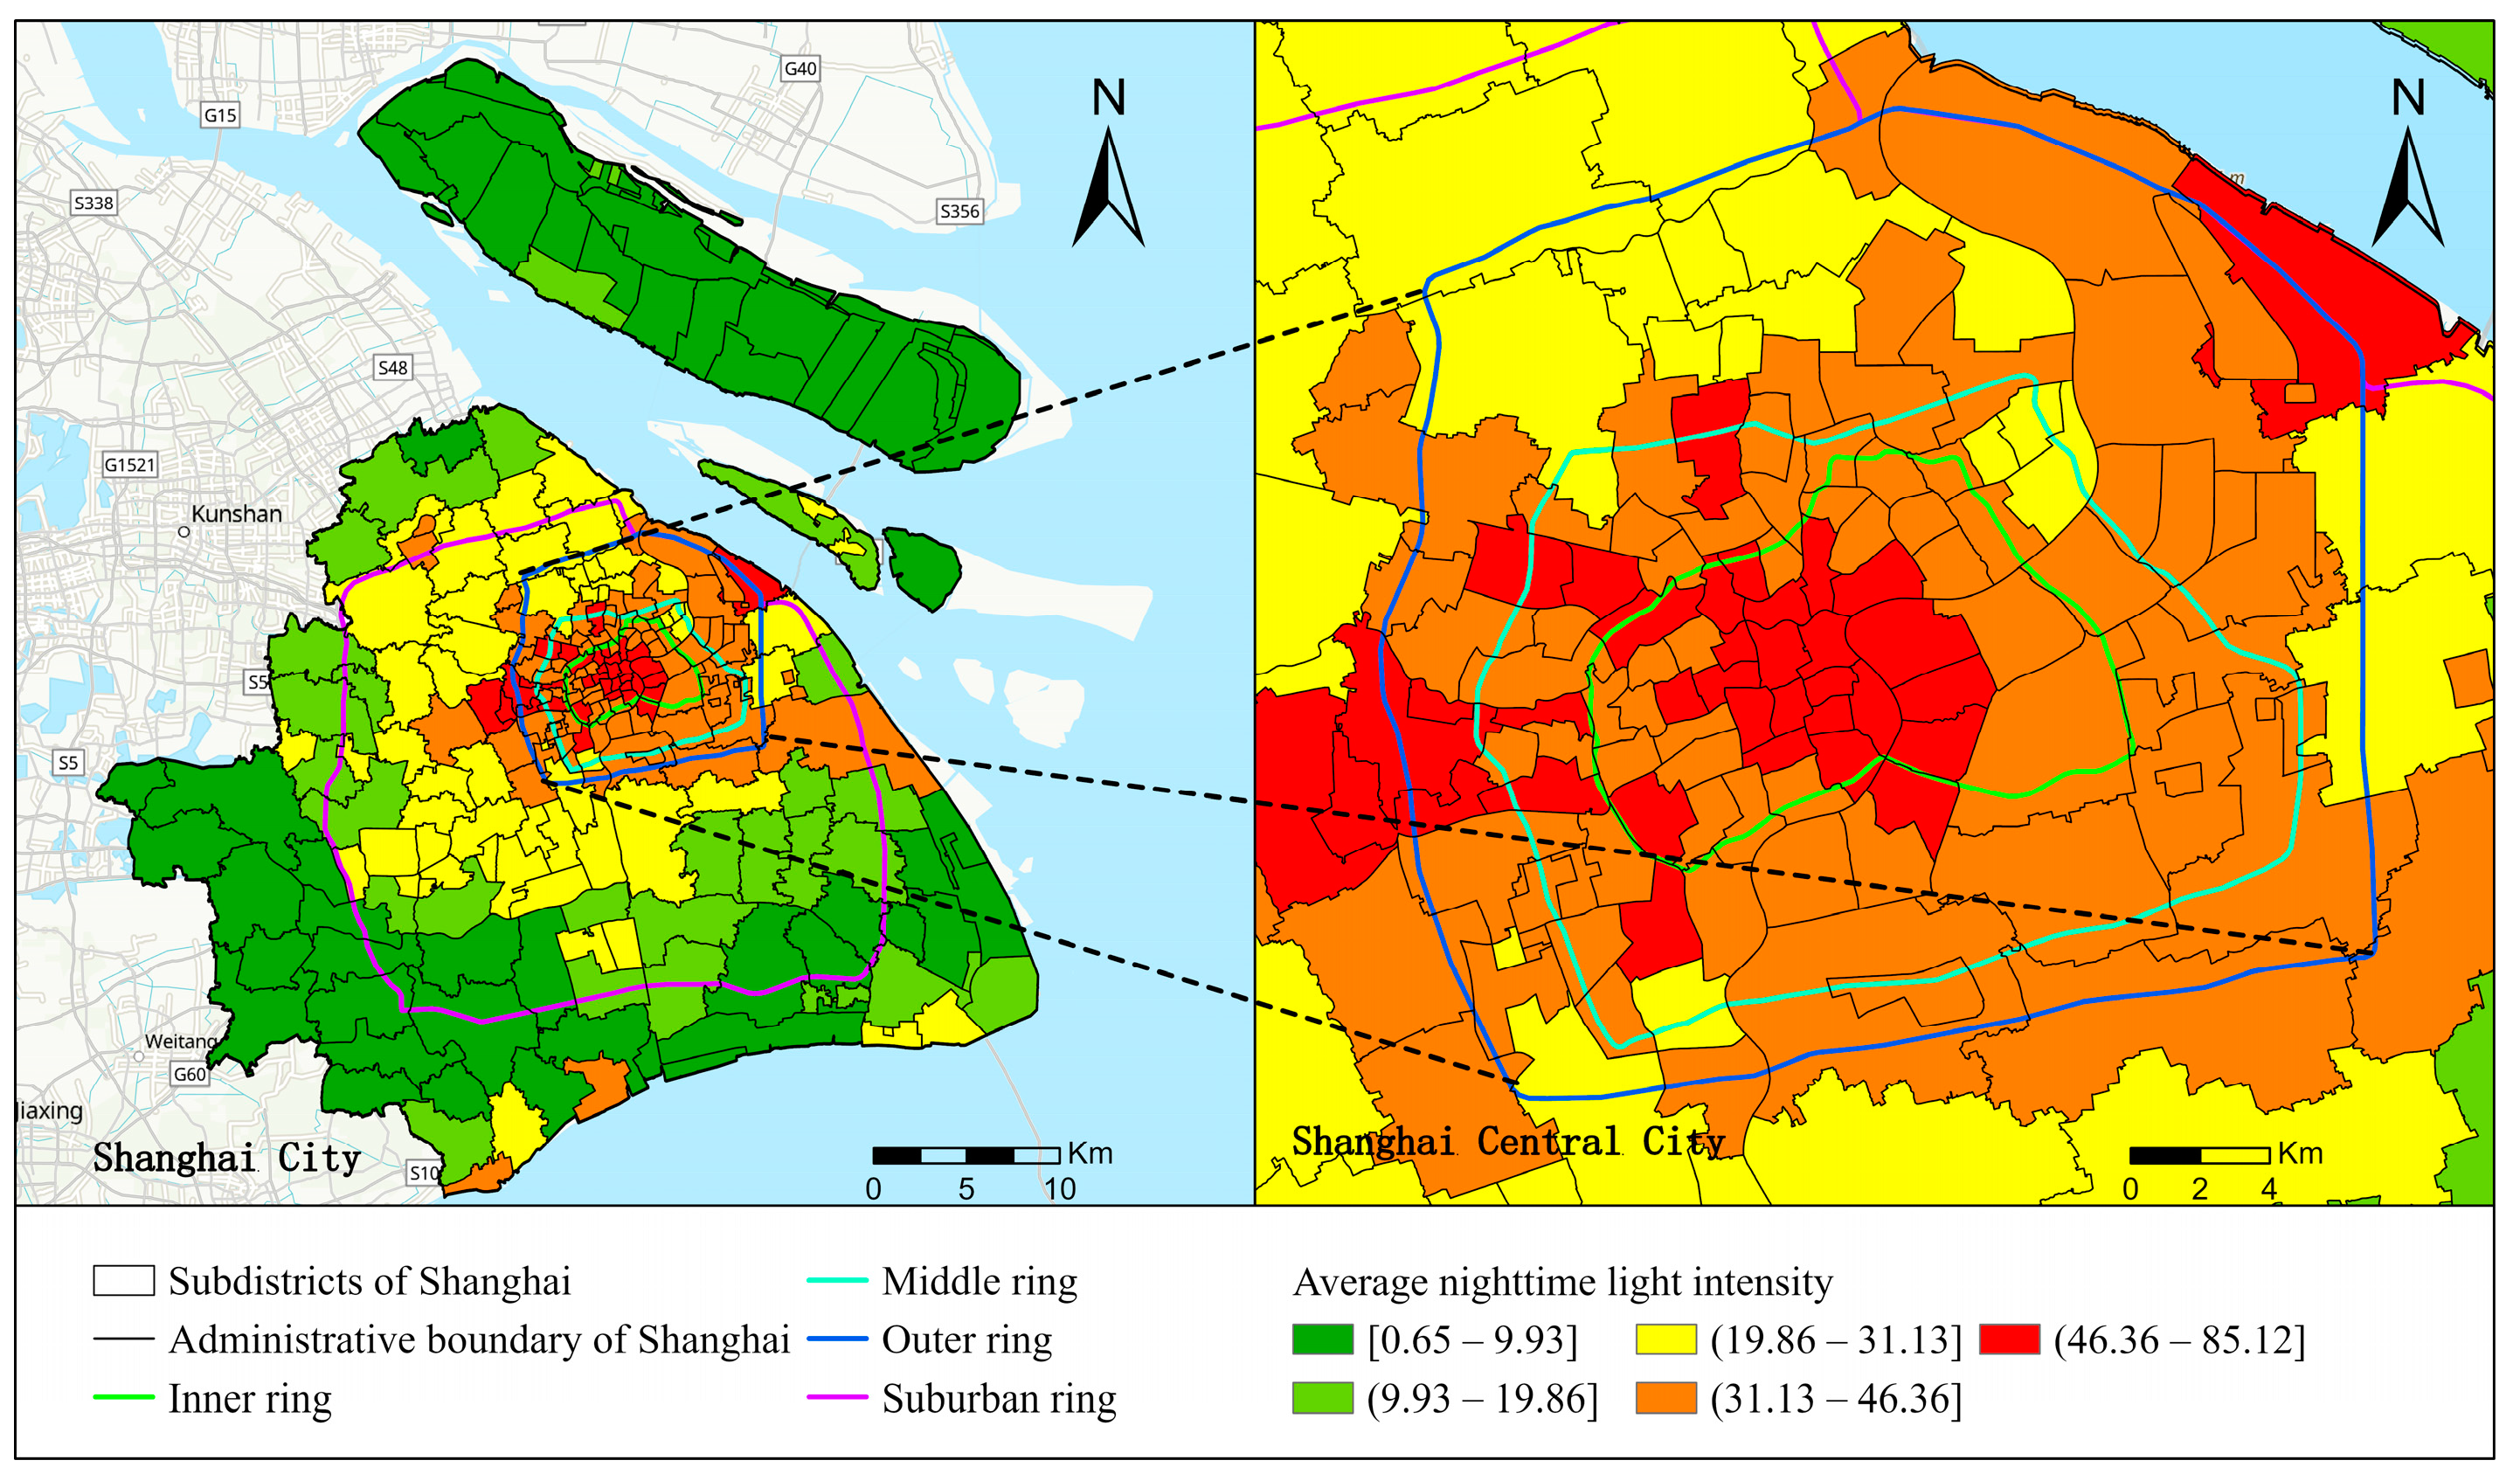
It was found that the social vitality of each subdistrict in Shanghai is obviously different; the lowest value of the average kernel density was zero, and the highest value was 4338.48. According to the natural interruption method, 19.39, 91.18, 248.39 and 654.00 were selected as the interruption values, and the social vitality was divided into five levels (Figure 10). The social vitality in Shanghai showed a more obvious central aggregation; most of the strong social vitality subdistricts were located within the inner ring; the substrong social vitality subdistricts were spread around the strong social vitality area, mainly within the inner ring and between the inner ring and middle ring; the medium social vitality subdistricts were mainly distributed between the middle ring and outer ring; and the subweak and weak social vitality subdistricts were mainly distributed in the suburbs.
3.3. Cultural Vitality
It was found that the number of subdistricts with strong, substrong, medium, subweak and weak cultural vitality in Shanghai accounted for 11.74%, 21.74%, 14.35%, 16.96% and 35.21%, respectively. There were 27 subdistricts with strong cultural vitality, with a spatial distribution pattern of “narrow upper and wide lower spoon-shaped contiguous distribution”. There were 50 subdistricts in the substrong cultural vitality area, which were spread around the subdistricts with strong cultural vitality, showing a ring distribution. There were 33 subdistricts in the medium cultural vitality area, which continued to spread to the surrounding areas on the basis of the substrong cultural vitality area. There were 120 subdistricts in the subweak and weak culturally vibrant areas, mainly distributed in the suburbs (Table 6).
3.4. Ecological Vitality
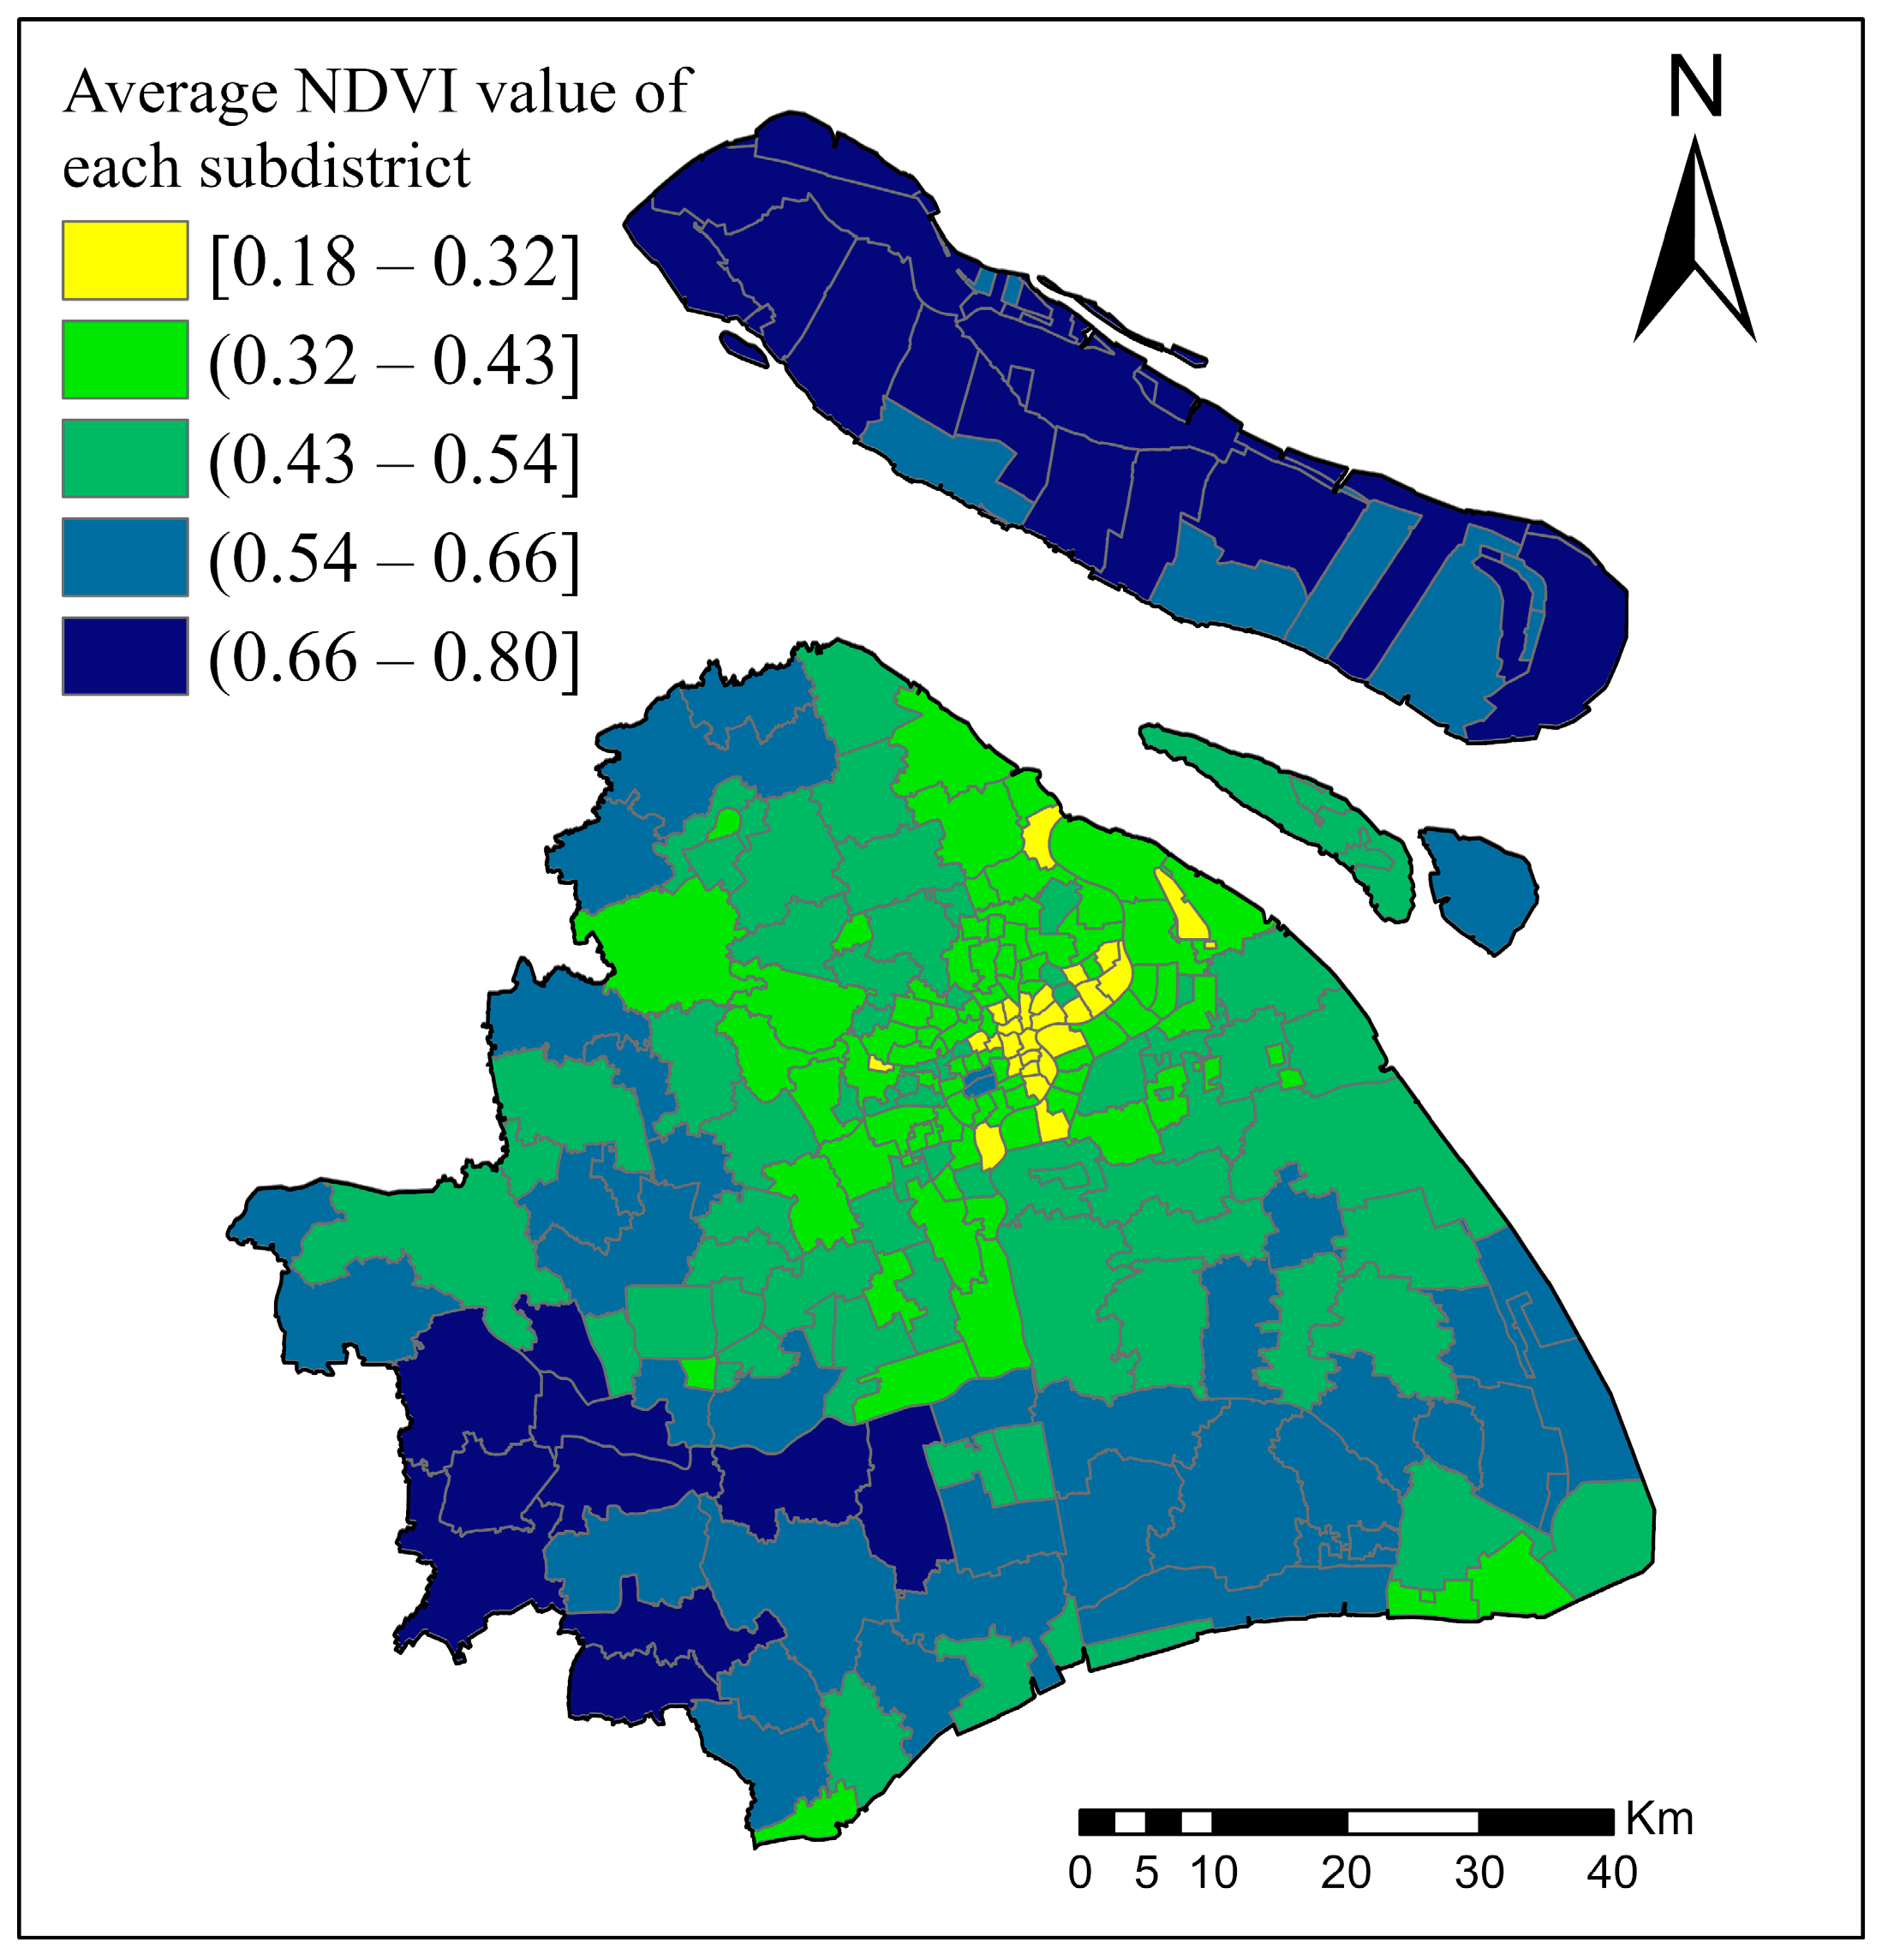
It was found that the ecological vitality of each subdistrict varied significantly, with the lowest value of EV being 0.18 and the highest value reaching 0.80. According to the natural interruption method, 0.32, 0.43, 0.54 and 0.66 were selected as interrupted values, and the ecological vitality was divided into five levels (Figure 11). The overall distribution of ecological vitality in Shanghai was also characterized by a circular structure, but in contrast to the spatial distribution of economic, social and cultural vitality, ecological vitality increased from the center to the periphery. There were 24 subdistricts with strong ecological vitality, mainly located in the southwestern part of Shanghai and Chongming Island; 39 subdistricts with substrong ecological vitality; 64 subdistricts with medium ecological vitality; 77 subdistricts with subweak ecological vitality, most of which were located within the outer ring; and 26 subdistricts with weak ecological vitality, most of which were located within the inner ring.
3.5. Comprehensive Urban Vitality
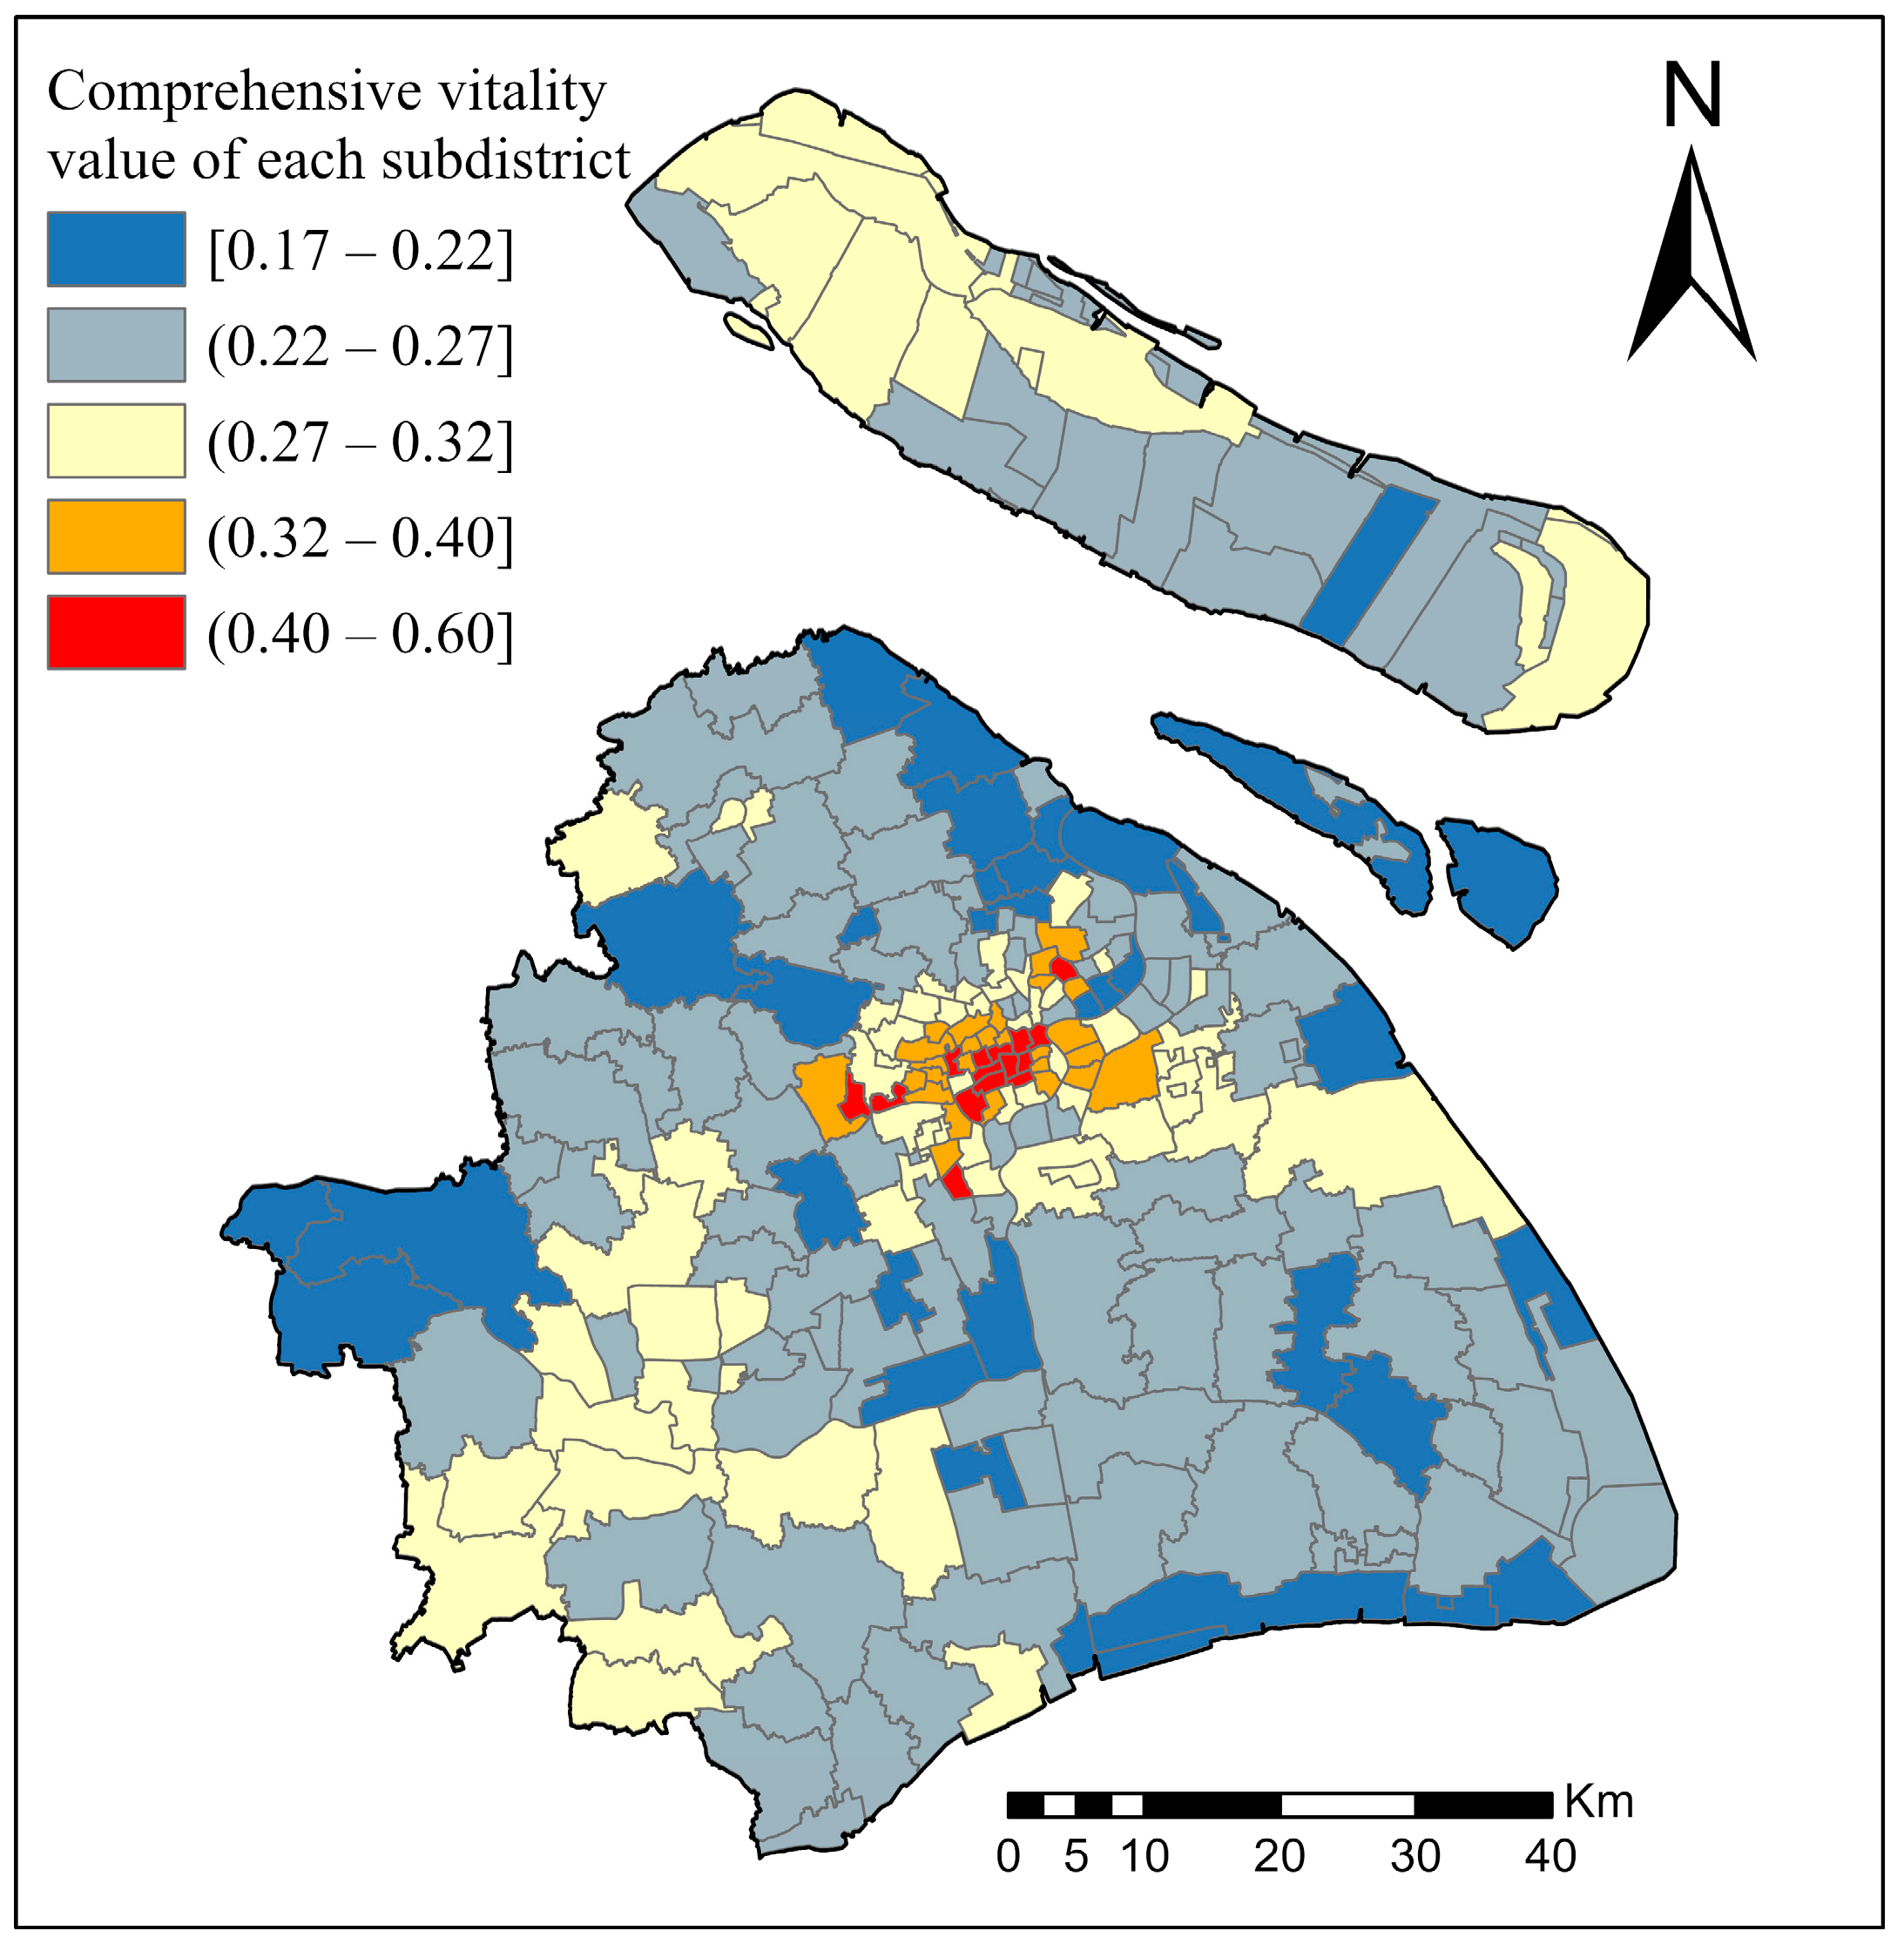
The weights of economic vitality, social vitality, cultural vitality and ecological vitality of the city determined according to the entropy weight method are shown in Table 7. The weight of economic vitality was 0.3049, followed by ecological vitality with 0.3007, cultural vitality with 0.2269 and social vitality with 0.1675, which was the smallest weight. The overall spatial distribution of integrated urban vitality in Shanghai showed a circle structure decreasing from the center to the surrounding area, but due to the opposite spatial distribution characteristics of ecological vitality, the circle characteristics of integrated urban vitality in Songjiang district and Jinshan district were weakened to some extent. According to the natural interruption method, the integrated urban vitality was divided into five levels (Figure 12). There were 14 subdistricts in the strong integrated vitality zone, which were mainly clustered in the central area of Shanghai. There were 27 substrong integrated vitality subdistricts distributed in a ring around the periphery of the strong vitality subdistricts. In addition, there were also clusters in the Songjiang and Jinshan districts in southwestern Shanghai and Chongming district in the northeast, mainly because the relatively remote areas have a good ecological environment, which improves the comprehensive urban vitality score. There were 93 subdistricts with subweak overall urban vitality. There were 34 weak integrated dynamic subdistricts scattered in the periphery of Shanghai.
3.6. Influence Mechanism of Urban Subdistrict Vitality
From the Pearson correlation test results (Table 8), it can be seen that the factors that play a significant role in urban vitality are functional density, subway station density, bus station density, intersection density, road network density and commercial facility density, all of which are highly positively correlated with urban vitality. Comprehensive vitality is moderately correlated with neighborhood location and population density, whereas it is negatively correlated with neighborhood location and positively correlated with population density. Neighborhoods with strong vitality are mainly located in densely populated areas that are closer to the city center. Comprehensive vitality is weakly correlated with functional mix, accessibility of large transportation stations, accessibility of subway stations and accessibility of bus stations, indicating that these four factors have a weak influence on comprehensive urban vitality. Integrated urban vitality has no significant linear relationship with spatial compactness and fractal dimension, which is not statistically significant.
The regression results of the OLS model show that only four factors pass the significance test (Table 9). The accessibility of subways is significant at the 5% level, and the subway station density, bus station density and intersection density are significant at the 1% level, indicating that these four factors are the main factors affecting the urban vitality of Shanghai. By observing the regression coefficients, it can be seen that subway accessibility, subway station density, bus station density and intersection density all have positive effects on urban vitality, and the order of the effects from high to low is bus station density > subway station density > intersection density > subway station accessibility. The R2 of the model was 0.6285, indicating that it could explain 62.85% of the spatial distribution pattern of urban vitality.
The regression results of the SLM show that five factors passed the significance test (Table 10): functional mix and subway accessibility are significant at the 10% level, intersection density is significant at the 5% level, and subway station density and bus station density are significant at the 1% level. According to the regression coefficients, all five factors that passed the significance test have positive effects on urban vitality, and the effects are ranked from highest to lowest: bus station density > subway station density > intersection density > subway station accessibility > functional mix. The R2 of the model is 0.6984, indicating that it can explain 69.84% of the spatial distribution pattern of urban vitality.
The regression results of the SEM show that there are five factors that pass the significance test (Table 11): functional mix is significant at the 10% level, metro station accessibility is significant at the 5% level, and metro station density, bus station density and intersection density are significant at the 1% level. The regression coefficients show that all five factors passing the significance test have positive effects on urban vitality, and the effects are ranked from highest to lowest: bus station density > subway station density > intersection density > subway station accessibility > functional mix. The R2 of the model is 0.6928, indicating that it can explain 69.28% of the spatial distribution pattern of urban vitality.
By comparing the parameters of R2, AIC and SC of the three regression models (Table 12), it was determined that the best fitting model was the SLM model based on the principle that the larger the fitting coefficient R2, the smaller the AIC, and the smaller the SC, the better the fitting effect of the model. According to the regression results, five factors with the greatest influence on urban vitality were obtained, and the degree of influence was from highest to lowest: bus station density > metro station density > intersection density > metro station accessibility > functional mix. The former four factors are related to public transport density and accessibility. It is clear that in areas with a denser distribution of public transportation stations, such as bus stops and subways, and better accessibility, people can travel more conveniently, and the increase in human activities greatly promotes the prosperity and development of the city. Areas with dense intersections generally have higher traffic flow, and many shopping malls and restaurants are located at intersections with high pedestrian flow, so the vitality value is higher. Neighborhoods with a high mix of functions contain more complete facilities that can meet the various needs of residents, with more human activities and higher urban vitality.
4. Discussion
4.1. On the Research Scale, Measurement Indicators and Data Sources
In terms of the research scale of urban vitality, previous studies mainly focused on the vitality of single cities and urban agglomerations at the overall level [8,16,17,20,30], community level and street scale [14,18,19], but rarely at the district level [63]. This study focuses on the subdistrict scale and studies the vitality characteristics of each subdistrict and its influence mechanism of creating vitality. In this way, it enriches the study scale of urban vitality and helps to reveal the heterogeneity of urban vitality within a city.
In terms of measurement indicators of urban vitality, previous studies mainly used pedestrian flow to characterize urban vitality [14,27,28,63]. Indeed, mobility enhances the strength of interactions and generates vitality. However, in addition to the flow of people, the flow of goods and information cannot be ignored. Additionally, this approach takes into account the social and economic vitality of urban activity subjects but neglects cultural and ecological vitality. In fact, architects and planners tend to focus on cities that are more active, diverse, dense, green and safe [13]. In other words, they prefer cities with integrated vitality to cities with single vitality. Therefore, this study constructs a comprehensive urban vitality measurement index system, which includes four aspects of economic, social, cultural and ecological vitalities, to explore the spatial distribution characteristics of urban subdistrict vitality in Shanghai. This not only enriches the connotation of urban vitality but also realizes the multidimensional perception of urban vitality.
In terms of data sources for urban vitality, most studies measured urban vitality based on microblog check-in data or mobile phone signaling data [22,27,28,36,46,47]. The following are disadvantages of microblog check-in data: one is that the group covered is mainly young people, the other is that the check-in data are generated by check-in behavior, and the group without check-in data is not covered, so it can only be regarded as sample data. Through crawler technology or website downloads, this study obtains rich and diverse network open big data, such as nighttime light remote sensing data, microblog check-in data, POI data, normalized vegetation index images, OpenStreetMap road network data, population raster data, etc. Big data based on location services make up for the defects that traditional statistical data cannot be quantified at the microscale and provide a rich data basis for large-scale, fine-scale and multiperiod urban vitality research.
4.2. The Relationship between Urban Density and Urban Vitality
Density is one of Jane Jacobs’ six criteria for urban vitality. Most previous studies have mainly examined the relationship between the living environment and walking activities in different cities to verify the relationship between urban vitality and urban density, built environment, land use mix, block size, accessibility, etc. [14,15,16,30,33,63,64]. Researchers generally believe that density and land use mix are positively correlated with urban vitality, and a compact urban form has a higher level of urban vitality. However, high density needs to be matched with good forms of public transport to combine a large number of elements (homes, commercial enterprises, buildings, blocks, lots, etc.) into a dynamic whole [13]. However, high density does not guarantee the vitality of a city and is sometimes even associated with a poor environment, economic decline and social fragmentation. Some researchers have found a negative relationship between neighborhood density and social cohesion; however, urban vitality plays a positive role in mediating the relationship between the built environment and social cohesion [34].
We selected two indices, population density and building density, to test the relationship between density and urban comprehensive vitality. The results show that population density and building density are significantly correlated with urban comprehensive vitality at the 1% level in Shanghai in 2019 (Table 13). This means that dense urban living can enhance the overall vitality of the city, including the provision of richer social, health, recreation and other services, the reduction of the cost of building and management services and the improvement of the efficiency of public transport.
4.3. The Relationship between Residents’ Income, Young People and Urban Vitality
Typically, the most vibrant city can attract not the blue-collar class but the affluent and the young. In other words, there is a strong correlation between urban vitality and the proportion of high-income residents and young people. Similarly, we selected two indicators, the proportion of professional technicians and the proportion of the population aged 18–35, to test the relationship between the high-income population, young people and urban vitality. Since data on high-income populations are hard to obtain, we use professional technicians as a proxy. Among all kinds of employees in Shanghai, their income is relatively high. The results show that the proportion of professional technicians is significantly correlated with urban comprehensive vitality at the 5% level, and the proportion of the population aged 18–35 is significantly correlated with urban comprehensive vitality at the 1% level in Shanghai in 2019 (Table 13). This implies that vibrant cities need strong support from high-income groups and fashionable youth groups.
4.4. Limitations of this Study
The limitations of this study are as follows: (1) Because the users of Weibo are mostly young people, the frequency of middle-aged, elderly and children groups using Weibo software to sign in and punch cards is much smaller than that of young people. The coverage of the entire population is not enough, and it cannot completely replace the actual flow distribution of the city. In addition, this paper uses the density of cultural facilities to characterize cultural vitality without considering the impact of different levels of facilities. (2) When detecting the influencing factors of urban vitality, most of the selected indicators are from the physical space dimension, without considering historical factors, the natural environment, policy support, information technology and human capital. (3) Taking the subdistrict as the research unit, the impact of the particularity of those subdistricts with perennial operating facilities is ignored. For example, in subdistricts with airports such as the Pudong Airport and Hongqiao Airport, stations such as the Hongqiao High-speed Railway Station and other facilities, high nighttime light values do not mean that the economic development level of the entire subdistrict is necessarily high.
5. Conclusions
Based on multisource data, this study uses the kernel density and entropy weight methods to measure the urban vitality of each subdistrict in Shanghai. At the same time, the correlation analysis, ordinary least squares regression model, spatial lag model and spatial error model were used for fitting analysis, aiming to reveal the influencing mechanism of urban vitality. The main conclusions are as follows:
- (1)
- The spatial distribution of economic vitality in Shanghai showed an obvious circle structure, with vitality values gradually decreasing from the center to the periphery. Social vitality showed the spatial characteristics of radiating outward from the center; however, there are differences in the types of places corresponding to different levels of hotspots, with the first level hotspots mainly concentrated in the vicinity of business districts, the second level hotspots mainly concentrated in the areas of colleges and universities and the third level hotspots mainly distributed in the areas of tourist attractions and parks. Cultural vitality showed the spatial distribution characteristics of “gathering in the centre, dispersing around, and Puxi is higher than Pudong”, but the cultural vitality value of different subdistricts varies greatly. Ecological vitality is characterized by a reverse circle structure of increasing from the center to the periphery.
- (2)
- Shanghai’s comprehensive urban vitality also showed an overall decreasing circle structure from the center to the surrounding area, but since ecological vitality is spatially inversely distributed, the circle characteristics of comprehensive urban vitality in the Songjiang and Jinshan districts are somewhat weakened.
- (3)
- Among the three regression models, the least squares regression model, the spatial lag model and the spatial error model, the spatial lag model is the most effective in explaining urban vitality, with an R2 of 0.6984, indicating that it can explain 69.84% of the spatial distribution pattern of urban vitality.
- (4)
- The factors that have significant effects on urban vitality are public transport density, accessibility and functional mix, and all of them are positively correlated. The order of the effects is bus station density > subway station density > intersection density > subway accessibility > functional mix. Therefore, in addition to building a multilevel transportation network system to cultivate urban vitality nodes, promoting multifunctional mixed land development to enhance land use efficiency is still an important practical theme for enhancing urban vitality in Shanghai.
Author Contributions
Y.S.: manuscript writing, conceptual design and technical guidance, fund acquisition. J.Z.: methodology and visualization. X.P.: manuscript writing, data acquisition and investigation, methodology. All authors have read and agreed to the published version of the manuscript.
Funding
This research was supported by the Shanghai Planning and Land Resource Administration Bureau (one of the key projects for the Shanghai General Land Use Planning Revision (2015(D)-002(F)-11).
Data Availability Statement
Data and materials are available from the authors upon request.
Acknowledgments
The authors thank the anonymous reviewers for their valuable comments and suggestions on this article.
Conflicts of Interest
The authors declare no conflict of interest.
References
- Batty, M. Empty buildings, shrinking cities and ghost towns. Environ. Plan. B Plan. Des. 2016, 43, 3–6. [Google Scholar] [CrossRef]
- Seunghoon, C. A study on the estimation methodology of traffic congestion cost based on individual vehicle speed data. J. Transp. Res. 2019, 26, 45–57. [Google Scholar]
- Irankhahi, M.; Jozi, S.A.; Farshchi, P.; Shariat, S.M.; Liaghati, H. Combination of GISFM and TOPSIS to evaluation of Urban Environment Carrying Capacity (Case study: Shemiran City, Iran). Int. J. Environ. Sci. Technol. 2017, 14, 1317–1332. [Google Scholar] [CrossRef]
- Yang, Y.; Ma, M.; Zhu, X.; Ge, W. Research on spatial characteristics of metropolis development using nighttime light data: NTL based spatial characteristics of Beijing. PLoS ONE 2020, 15, e0242663. [Google Scholar] [CrossRef]
- Kim, K.; Lee, J. A Study on the Characteristics and Implication of Ghost Towns Popping up during New Urbanization in China. J. Asian Stud. 2019, 22, 71–99. [Google Scholar] [CrossRef]
- Chitra, V. Remembering the river: Flood, memory and infrastructural ecologies of stormwater drainage in Mumbai. Urban Stud. 2022, 59, 1855–1871. [Google Scholar] [CrossRef]
- Shi, Y. Measurement index system and empirical analysis of China’s urban diseases. Econ. Geogr. 2014, 34, 1–6. (In Chinese) [Google Scholar]
- Chen, Z.; Dong, B.; Pei, Q.; Zhang, Z. The impacts of urban vitality and urban density on innovation: Evidence from China’s Greater Bay Area. Habitat Int. 2020, 119, 102490. [Google Scholar] [CrossRef]
- Shen, J.; Zhang, K. An empirical analysis of the predisposing factors of typical symptoms of metropolitan disease in China. Prog. Geogr. 2020, 9, 1–12. (In Chinese) [Google Scholar]
- Montgomery, J. Making a city: Urbanity, vitality and urban design. J. Urban Des. 1998, 3, 93–116. [Google Scholar] [CrossRef]
- Gomez-Varo, I.; Delclos-Alio, X.; Miralles-Guasch, C. Urban vitality and everyday life: Revisiting Jane Jacobs through a spatial analysis of food retail in Barcelona. Cuad. Geográficos 2022, 60, 147–167. [Google Scholar]
- Lynch, K. Good City Form; The MIT Press: Cambridge, UK, 1984. [Google Scholar]
- Montgomery, C. Happy City: Transforming Our Lives through Urban Design; Doubleday Canada Ltd.: Toronto, ON, Canada, 2013. [Google Scholar]
- Sung, H.-G.; Go, D.-H.; Choi, C.G. Evidence of Jacobs’s street life in the great Seoul city: Identifying the association of physical environment with walking activity on streets. Cities 2013, 35, 164–173. [Google Scholar] [CrossRef]
- Sung, H.; Lee, S. Residential built environment and walking activity: Empirical evidence of Jane Jacobs’ urban vitality. Transp. Res. Part D Transp. Environ. 2015, 41, 318–329. [Google Scholar] [CrossRef]
- Delclòs-Alió, X.; Miralles-Guasch, C. Looking at Barcelona through Jane Jacobs’s eyes: Mapping the basic conditions for urban vitality in a Mediterranean conurbation. Land Use Policy 2018, 75, 505–517. [Google Scholar] [CrossRef]
- Zeng, C.; Song, Y.; He, Q.; Shen, F. Spatially explicit assessment on urban vitality: Case studies in Chicago and Wuhan. Sustain. Cities Soc. 2018, 40, 296–306. [Google Scholar] [CrossRef]
- Bosselmann, P.; Macdonald, E.; Kronemeyer, T. Livable Streets Revisited. J. Am. Plan. Assoc. 1999, 65, 168–180. [Google Scholar] [CrossRef]
- Marshall, S. Streets & Patterns; Spon Press: London, UK, 2005. [Google Scholar]
- Yue, W.; Chen, Y.; Thy, P.T.M.; Fan, P.; Liu, Y.; Zhang, W. Identifying urban vitality in metropolitan areas of developing countries from a comparative perspective: Ho Chi Minh City versus Shanghai. Sustain. Cities Soc. 2020, 65, 102609. [Google Scholar] [CrossRef]
- Sulis, P.; Manley, E.; Zhong, C.; Batty, M. Using mobility data as proxy for measuring urban vitality. J. Spat. Inf. Sci. 2018, 16, 137–162. [Google Scholar] [CrossRef]
- Ta, N.; Zeng, Y.; Zhu, Q.; Wu, J. Analysis of the relationship between built environment and urban vitality in central Shanghai based on big data. Sci. Geogr. Sin. 2020, 40, 60–68. (In Chinese) [Google Scholar]
- Zhu, T.; Tu, W.; Le, Y.; Zhong, H.; Zhao, T.; Ni, Q.; Li, Q. Sensing urban vitality using geotagged data. Acta Geod. Cartogr. Sin. 2020, 49, 365–374. (In Chinese) [Google Scholar]
- Jin, Y. Evaluation of urban economic vitality in China. Sci. Geogr. Sin. 2007, 27, 11–18. (In Chinese) [Google Scholar]
- Jiang, D. On the Vitality of Urban Form; Southeast University Press: Nanjing, China, 2007. (In Chinese) [Google Scholar]
- Liu, L.; Xu, Y.; Jiang, S. Evaluation of urban vitality based on fuzzy matter-element model. Geogr. Geogr. Inf. Sci. 2010, 26, 73–77. (In Chinese) [Google Scholar]
- Miriam, C. Producing urban vitality: The case of dance in San Francisco. Urban Geogr. 2009, 30, 416–439. [Google Scholar]
- Wang, B.; Zhen, F.; Zhang, H. Spatial-temporal dynamics and regionalization of urban vitality based on check-in data. Sci. Geogr. Sin. 2015, 35, 151–160. (In Chinese) [Google Scholar]
- Lan, F.; Gong, X.; Da, H.; Wen, H. How do population inflow and social infrastructure affect urban vitality? Evidence from 35 large- and medium-sized cities in China. Cities 2020, 100, 102454. [Google Scholar] [CrossRef]
- Mao, W.; Zhong, Y. Spatial pattern and influencing factors of urban vitality level in urban agglomerations in the middle reaches of Yangtze River. Reg. Geogr. Res. 2020, 29, 86–95. (In Chinese) [Google Scholar]
- Paköz, M.Z.; Işık, M. Rethinking urban density, vitality and healthy environment in the post-pandemic city: The case of Istanbul. Cities 2022, 124, 103598. [Google Scholar] [CrossRef]
- Jesús, M. Almendros-Jiménez, Antonio. B.; Manuel, T. The retrieval of social network data for points-of-interest in OpenStreetMap. Hum.-Cent. Comput. Inf. Sci. 2021, 11, 1–22. [Google Scholar]
- Liu, D.; Shi, Y. The Influence Mechanism of Urban Spatial Structure on Urban Vitality Based on Geographic Big Data: A Case Study in Downtown Shanghai. Buildings 2022, 12, 569. [Google Scholar] [CrossRef]
- Mouratidis, K.; Poortinga, W. Built environment, urban vitality and social cohesion: Do vibrant neighborhoods foster strong communities? Landsc. Urban Plan. 2022, 204, 103951. [Google Scholar] [CrossRef]
- Zhao, P.; Luo, A.; Liu, Y.; Xu, J.; Li, Z.; Zhuang, F.; Sheng, V.S.; Zhou, X. Where to Go Next: A Spatio-Temporal Gated Network for Next POI Recommendation. IEEE Trans. Knowl. Data Eng. 2020, 34, 2512–2524. [Google Scholar] [CrossRef]
- He, Q.S.; He, W.S.; Song, Y.; Wu, J.Y.; Yin, C.H.; Mou, Y.C. The impact of urban growth patterns on urban vitality in newly built-up areas based on an association rules analysis using geographical ‘big data’. Land Use Policy 2018, 78, 726–738. [Google Scholar] [CrossRef]
- Kim, Y.-L. Seoul’s Wi-Fi hotspots: Wi-Fi access points as an indicator of urban vitality. Comput. Environ. Urban Syst. 2018, 72, 13–24. [Google Scholar] [CrossRef]
- Díaz, C.L.P.; Xiong, X.; Li, Y.; Chiang, K. S-NPP VIIRS Thermal Emissive Bands 10-Year On-Orbit Calibration and Performance. Remote. Sens. 2021, 13, 3917. [Google Scholar] [CrossRef]
- Shi, K.; Yu, B.; Huang, Y.; Hu, Y.; Yin, B.; Chen, Z.; Chen, L.; Wu, J. Evaluating the ability of npp-viirs nighttime light data to estimate the gross domestic product and the electric power consumption of China at multiple scales: A comparison with DMSP-OLS Data. Remote Sens. 2014, 6, 1705–1724. [Google Scholar] [CrossRef]
- Tu, Q.; Pan, D.; Hao, Z. Validation of S-NPP VIIRS Sea Surface Temperature Retrieved from NAVO. Remote Sens. 2015, 7, 17234–17245. [Google Scholar] [CrossRef]
- Sarkar, S. Rapid assessment of cyclone damage using NPP-VIIRS DNB and ancillary data. Nat. Hazards 2021, 106, 579–593. [Google Scholar] [CrossRef]
- Sun, Y.; Fan, H.; Li, M.; Zipf, A. Identifying the city center using human travel flows generated from location-based social networking data. Environ. Plan. B Plan. Des. 2015, 43, 480–498. [Google Scholar] [CrossRef]
- Liu, K.; Yin, L.; Lu, F.; Mou, N. Visualizing and exploring POI configurations of urban regions on POI-type semantic space. Cities 2020, 99, 102610. [Google Scholar] [CrossRef]
- Low, R.; Tekler, Z.D.; Cheah, L. An End-to-End Point of Interest (POI) Conflation Framework. ISPRS Int. J. Geo-Inf. 2021, 10, 779. [Google Scholar] [CrossRef]
- Han, J.; Yamana, H. Geographic Diversification of Recommended POIs in Frequently Visited Areas. ACM Trans. Inf. Syst. 2020, 38, 1–39. [Google Scholar] [CrossRef]
- Hu, Q.; Bai, G.; Wang, S.; Ai, M. Extraction and monitoring approach of dynamic urban commercial area using check-in data from Weibo. Sustain. Cities Soc. 2019, 45, 508–521. [Google Scholar] [CrossRef]
- Rizwan, W.; Wan, W.; Cervantes, O.; Gwiazdzinski, L. Using location-based social media data to observe check-in behavior and gender difference: Bringing Weibo data into play. ISPRS Int. J. Geo-Inf. 2018, 7, 196. [Google Scholar] [CrossRef]
- Wu, J.; Li, J.; Ma, Y. A comparative study of spatial and temporal preferences for waterfronts in Wuhan based on gender differences in check-in behaviour. ISPRS Int. J. Geo-Inf. 2019, 8, 413. [Google Scholar] [CrossRef]
- Bhuyan, U.; Zang, C.; Vicente-Serrano, S.M.; Menzel, A. Exploring Relationships among Tree-Ring Growth, Climate Variability, and Seasonal Leaf Activity on Varying Timescales and Spatial Resolutions. Remote Sens. 2017, 9, 526. [Google Scholar] [CrossRef]
- Sanjiwana, A.; Yasushi, Y.; Tatsuro, N.; Yoshiko, K.; Siti-Aisah, S.; Marryanna, L. Assessment of values and trends in coarse spatial resolution NDVI datasets in Southeast Asia landscapes. Eur. J. Remote Sens. 2018, 51, 863–877. [Google Scholar]
- John, M.; Ellen, D.; Donnelly, A. Evaluating the role of race in sentencing: An entropy weighting analysis. Justice Q. 2019, 36, 656–681. [Google Scholar]
- Joshi, R.; Kumar, S. A Novel Fuzzy Decision-Making Method Using Entropy Weights-Based Correlation Coefficients Under Intuitionistic Fuzzy Environment. Int. J. Fuzzy Syst. 2018, 21, 232–242. [Google Scholar] [CrossRef]
- Vapnik, V. The Nature of Statistical Learning Theory; Springer Science & Business Media: Berlin/Heidelberg, Germany, 2013. [Google Scholar]
- Badi, H.B.; Bernard, F.; Alain, P. Spatial lag models with nested random effects: An instrumental variable procedure with an application to English house prices. J. Urban Econ. 2014, 80, 76–86. [Google Scholar]
- Shin, K.; You, S.; Kim, M. A Comparison of Two-Stage Least Squares (TSLS) and Ordinary Least Squares (OLS) in Estimating the Structural Relationship between After-School Exercise and Academic Performance. Mathematics 2021, 9, 3105. [Google Scholar] [CrossRef]
- Jery, R.S.; Tasker, G.D. Regional hydrologic analysis-ordinary, weighted, and generalized least squares compared. Water Resour. Res. 1985, 121, 1421–1432. [Google Scholar]
- Francisco, L.; María, E.G.; José, R.L.; Carenne, L. Modelling malaria incidence by an autoregressive distributed lag model with spatial component. Spat. Spatio-Temporal Epidemiol. 2017, 22, 27–37. [Google Scholar]
- Chien, L.-C.; Guo, Y.; Li, X.; Yu, H.-L. Considering spatial heterogeneity in the distributed lag non-linear model when analyzing spatiotemporal data. J. Expo. Sci. Environ. Epidemiol. 2016, 28, 13–20. [Google Scholar] [CrossRef]
- Dong, K.; Guo, L. Research on the Spatial Correlation and Spatial Lag of COVID-19 Infection Based on Spatial Analysis. Sustainability 2021, 13, 12013. [Google Scholar] [CrossRef]
- Vural, Y.; Yeliz, M.K. Robust estimation approach for spatial error model. J. Stat. Comput. Simul. 2020, 90, 1618–1638. [Google Scholar]
- Kato, T. A comparison of spatial error models through Monte Carlo experiments. Econ. Model. 2013, 30, 743–753. [Google Scholar] [CrossRef]
- Yankey, O.; Amegbor, P.M.; Essah, M. The effect of socioeconomic and environmental factors on obesity: A spatial regression analysis. Int. J. Appl. Geospat. Res. 2021, 12, 58–74. [Google Scholar] [CrossRef]
- Irene, G.; Xavier, D.; Carme, M. Jane Jacobs reloaded: A contemporary operationalization of urban vitality in a district in Barcelona. Cities 2022, 123, 103565. [Google Scholar]
- Fuentes, L.; Miralles-Guasch, C.; Truffello, R.; Delclòs-Alió, X.; Flores, M.; Rodríguez, S. Santiago de Chile through the Eyes of Jane Jacobs: Analysis of the conditions for urban vitality in a Latin American metropolis. Land 2020, 9, 498. [Google Scholar] [CrossRef]
Figure 1.
Geographical location of Shanghai.

Figure 2.
The nighttime light data in Shanghai in 2019 (the spatial resolution is 300 m × 300 m).

Figure 3.
Distribution of Weibo check-in data in Shanghai in October 2019.

Figure 4.
Distribution of scientific, educational and cultural facilities in Shanghai.

Figure 5.
Distribution of NDVI in Shanghai in 2019.

Figure 6.
Kernel density of Weibo sign-in data.

Figure 7.
Kernel density distribution of scientific, educational and cultural facilities in Shanghai.
Figure 7.
Kernel density distribution of scientific, educational and cultural facilities in Shanghai.

Figure 8.
Spatial distribution of economic vitality in Shanghai.

Figure 9.
Economic vitality grade division of subdistricts in different ring lines in Shanghai.

Figure 10.
Social vitality grade division of subdistricts in different ring lines in Shanghai.

Figure 11.
Spatial distribution of the ecological vitality of subdistricts in Shanghai.

Figure 12.
Spatial distribution of the comprehensive vitality of each subdistrict in Shanghai.


Table 1.
Shanghai nighttime light intensity statistics.
| DN Value | Level | Shanghai Central City | Shanghai | ||||||
|---|---|---|---|---|---|---|---|---|---|
| Within the Inner Ring | Between the Inner Ring and Middle Ring | Between the Middle Ring and Outer Ring | |||||||
| Number of Pixels | % | Number of Pixels | % | Number of Pixels | % | Number of Pixels | % | ||
| [0, 13] | Weak | 0 | 0.00 | 0 | 0.00 | 52 | 0.99 | 57,420 | 56.42 |
| (13, 32] | Medium | 167 | 9.78 | 709 | 23.57 | 2526 | 48.25 | 29,079 | 28.57 |
| (32, 373] | Strong | 1541 | 90.22 | 2299 | 76.43 | 2658 | 50.76 | 15,279 | 15.01 |
Table 2.
Statistics of sign-in points per unit area in different regions of Shanghai.
| Region | Number of Points | Area (km2) | Number of Sign-in Points per Unit Area (Number /km2) |
|---|---|---|---|
| Within the inner ring | 111,854 | 114.0546 | 981 |
| Between the inner ring and middle ring | 54,456 | 199.84 | 272 |
| Between the middle ring and outer ring | 45,145 | 348.9013 | 129 |
| Between the outer ring and suburban ring | 122,819 | 2297.856 | 53 |
| Outside the suburban ring | 51,514 | 3811 | 14 |
Table 3.
Factors influencing urban vitality.
| I Impact Factors | II Impact Factors | Abbreviations | Implication | |
|---|---|---|---|---|
| Internal features | Location | Subdistrict location | LOC | The distance between the center of a subdistrict and the center of Shanghai |
| Spatial form | Spatial compact ratio | SC | Reflects the complexity of the spatial structure of the subdistrict | |
| Fractal dimension | FD | Reflects the complexity of the subdistrict shape | ||
| Functional form | Functional density | FDE | The density of each functional POI point | |
| Functional mixing degree | FMD | Mixing degree of POI points of each function | ||
| Population character | Population density | PD | Number of people per unit area | |
| External environment | Traffic accessibility | Accessibility of large traffic stations | TSA | The reciprocal of the distance between a commercial service and the nearest airport, railway station and long-distance passenger station |
| Subway stations | SSA | The inverse of the distance to the nearest subway station | ||
| Bus stations | BSA | The inverse of the distance to the nearest bus station | ||
| Infrastructure construction intensity | Subway station density | SSD | The number of subway stations per unit area | |
| Bus station density | BSD | Number of bus stations per unit area | ||
| Intersection density | CD | Number of intersections per unit area | ||
| Road network density | RND | Length of road per unit area | ||
| Commercial services | Commercial facility density | CSD | The number of commercial facilities per unit area |
Note: (1) The formula of spatial compactness (SD) is , where area is the area of the block unit and L is the perimeter of the administrative boundary of the subdistrict unit; the larger the SD is, the more compact the spatial form. (2) The fractal dimension (FD) calculation formula is , and fractal dimension values range between 1 and 2; the greater the value of FD is, the more complex the shape. (3) Function density (the number of POIs in a unit area) is used to represent functional density (FDE), and the calculation formula is , where is the density of cultural facilities in the ith subdistrict, is the number of POI facilities in the ith subdistrict and is the area of the ith subdistrict. (4) The functional mixing degree is used to represent the functional mixing degree (FMD), and the calculation formula is , where represents the functional mixing degree of the ith subdistrict, n is the total number of POI types and is the proportion of the number of jth POIs in all POIs in the ith subdistrict. The larger the value of FMD is, the richer the POI species in the region. (5) The commercial service facility density (CSD) can be calculated as follows: , where denotes the density of commercial service facilities in the ith subdistrict, is the total number of commercial service facilities in the ith subdistrict and is the area of the ith subdistrict.
Table 4.
Variance inflation factor (VIF) of each variable.
| Impact Factors | Variance Inflation Factor (VIF) |
|---|---|
| Subdistrict location | 5.13 |
| Spatial compact ratio | 7.89 |
| Fractal dimension | 8.05 |
| Functional density | 24.09 |
| Functional mixing degree | 1.39 |
| Population density | 3.34 |
| Accessibility of large traffic stations | 1.54 |
| Subway stations | 2.80 |
| Bus stations | 1.40 |
| Subway station density | 3.37 |
| Bus station density | 4.72 |
| Intersection density | 10.89 |
| Road network density | 17.80 |
| Commercial facility density | 21.48 |
Table 5.
Statistics of the economic vitality of each subdistrict in Shanghai.
| DN Value | Economic Vitality Level | Shanghai Central City | Shanghai | ||||||
|---|---|---|---|---|---|---|---|---|---|
| Within the Inner Ring | Between the Inner Ring and Middle Ring | Between the Middle Ring and Outer Ring | |||||||
| Number of Subdistricts | % | Number of Subdistricts | % | Number of Subdistricts | % | Number of Subdistricts | % | ||
| [0.65, 9.93] | Weak | 0 | 0.00 | 0 | 0.00 | 0 | 0.00 | 45 | 19.57 |
| (9.93, 19.86] | Subweak | 0 | 0.00 | 0 | 0.00 | 0 | 0.00 | 27 | 11.74 |
| (19.86, 31.13] | Medium | 0 | 0.00 | 1 | 3.13 | 10 | 26.32 | 51 | 22.17 |
| (31.13, 46.36] | Substrong | 9 | 37.50 | 20 | 62.50 | 24 | 63.16 | 73 | 31.74 |
| (46.36, 85.12] | Strong | 15 | 62.50 | 11 | 34.37 | 4 | 10.52 | 34 | 14.78 |
Table 6.
Statistics of subdistricts with different levels of cultural vitality in Shanghai.
| Level of Cultural Vitality | DCF Value (Number/km2) | Number of Subdistricts | Proportion of Subdistricts (%) |
|---|---|---|---|
| Strong | (21.57, 70.31] | 27 | 11.74 |
| Substrong | (7.56, 21.57] | 50 | 21.74 |
| Medium | (2.54, 7.56] | 33 | 14.35 |
| Subweak | (0.88, 2.54] | 39 | 16.96 |
| Weak | [0.00, 0.88] | 81 | 35.21 |
Table 7.
Weight of different vitalities.
| Vitality Type | Weight |
|---|---|
| Economic vitality | 0.3049 |
| Social vitality | 0.1675 |
| Cultural vitality | 0.2269 |
| Ecological vitality | 0.3007 |
Table 8.
Pearson correlation analysis results.
| I Impact Factors | II Impact Factors | Pearson Correlation (R) | Significance (P) | Correlation | |
|---|---|---|---|---|---|
| Internal features | Location | Subdistrict location | −0.390 ** | 0.000 | Medium |
| Spatial form | Spatial compact ratio | 0.009 | 0.892 | Uncorrelated | |
| Fractal dimension | −0.113 | 0.087 | Uncorrelated | ||
| Functional form | Functional density | 0.743 ** | 0.000 | High | |
| Functional mixing degree | 0.214 ** | 0.001 | Low | ||
| Population character | Population density | 0.482 ** | 0.000 | Medium | |
| External environment | Traffic accessibility | Accessibility of large traffic stations | −0.271 ** | 0.000 | Low |
| Subway stations | −0.158 * | 0.016 | Low | ||
| Bus stations | −0.221 ** | 0.001 | Low | ||
| Infrastructure construction intensity | Subway station density | 0.624 ** | 0.000 | High | |
| Bus station density | 0.626 ** | 0.000 | High | ||
| Intersection density | 0.567 ** | 0.000 | High | ||
| Road network density | 0.611 ** | 0.000 | High | ||
| Commercial services | Commercial facility density | 0.731 ** | 0.000 | High |
Note: ** and * indicate significance at the 1% and 5% levels, respectively.
Table 9.
Summary of OLS results.
| Impact Factors | Coefficient | Standard Deviation | Statistical Quantities | Probability |
|---|---|---|---|---|
| Intercept | 0.0368 | 0.0319 | 1.1547 | 0.2495 |
| Subdistrict location | 0.0357 | 0.0498 | 0.7182 | 0.4734 |
| Spatial compact ratio | −0.0020 | 0.0558 | −0.0365 | 0.9709 |
| Functional mixing degree | 0.0641 | 0.0451 | 1.4216 | 0.1566 |
| Population density | 0.0149 | 0.0500 | 0.2969 | 0.7668 |
| Accessibility of large traffic stations | 0.0014 | 0.0411 | 0.0335 | 0.9734 |
| Subway stations | 0.1102 | 0.0531 | 2.0742 | 0.0392 ** |
| Bus stations | 0.0331 | 0.0606 | 0.5458 | 0.5858 |
| Subway station density | 0.3869 | 0.0578 | 6.6891 | 0.0000 *** |
| Bus station density | 0.3939 | 0.0676 | 5.8250 | 0.0000 *** |
| Intersection density | 0.2211 | 0.0626 | 3.5336 | 0.0005 *** |
| R2 | 0.6285 | |||
| Adjusted R2 | 0.6115 | |||
| Log L | 224.378 | |||
| AIC | −426.756 | |||
| SC | −388.938 |
Note: ** and *** denote significance at 5% and 1% levels, respectively.
Table 10.
Summary of SLM results.
| Impact Factors | Coefficient | Standard Deviation | Statistics z | Probability P |
|---|---|---|---|---|
| Constant | −0.0137 | 0.0293 | −0.4682 | 0.6396 |
| Subdistrict location | 0.0416 | 0.0440 | 0.9458 | 0.3442 |
| Spatial compact ratio | 0.0019 | 0.0491 | 0.0380 | 0.9697 |
| Functional mixing degree | 0.0676 | 0.0396 | 1.7051 | 0.0882 * |
| Population density | −0.0352 | 0.0442 | −0.7971 | 0.4254 |
| Accessibility of large traffic stations | 0.0164 | 0.0362 | 0.4537 | 0.6500 |
| Subway stations | 0.0785 | 0.0474 | 1.6559 | 0.0977 * |
| Bus stations | 0.0229 | 0.0533 | 0.4285 | 0.6683 |
| Subway station density | 0.2671 | 0.0530 | 5.0396 | 0.0000 *** |
| Bus station density | 0.3232 | 0.0609 | 5.3053 | 0.0000 *** |
| Intersection density | 0.1236 | 0.0564 | 2.1898 | 0.0285 ** |
| R2 | 0.6984 | |||
| Log L | 243.304 | |||
| AIC | −462.608 | |||
| SC | −421.351 |
Note: *, ** and *** denote significance at 10%, 5% and 1% levels, respectively.
Table 11.
Summary of SEM results.
| Impact factors | Coefficient | Standard Deviation | Statistics z | Probability P |
|---|---|---|---|---|
| Constant | 0.0815 | 0.0354 | 2.3046 | 0.0212 |
| Subdistrict location | −0.0796 | 0.0672 | −1.1847 | 0.2362 |
| Spatial compact ratio | −0.0071 | 0.0520 | −0.1367 | 0.8913 |
| Functional mixing degree | 0.0742 | 0.0408 | 1.8159 | 0.0694 * |
| Population density | −0.0414 | 0.0546 | −0.7579 | 0.4485 |
| Accessibility of large traffic stations | 0.0233 | 0.0410 | 0.5694 | 0.5691 |
| Subway stations | 0.1669 | 0.0739 | 2.2581 | 0.0240 ** |
| Bus stations | 0.0468 | 0.0520 | 0.8982 | 0.3691 |
| Subway station density | 0.2735 | 0.0554 | 4.9336 | 0.0000 *** |
| Bus station density | 0.3841 | 0.0626 | 6.1403 | 0.0000 *** |
| Intersection density | 0.1752 | 0.0654 | 2.6798 | 0.0074 *** |
| LAMBDA | 0.5080 | 0.0681 | 7.4608 | 0.0000 *** |
| R2 | 0.6928 | |||
| Log L | 238.3404 | |||
| AIC | −454.681 | |||
| SC | −416.862 |
Note: *, ** and *** indicate significance at the 10%, 5% and 1% levels, respectively.
Table 12.
Comparison of three regression model results.
| Index | OLS Model | SLM | SEM |
|---|---|---|---|
| R2 | 0.6285 | 0.6984 | 0.6928 |
| AIC | −426.756 | −462.608 | −454.681 |
| SC | −388.938 | −421.351 | −416.862 |
Table 13.
Pearson correlation analysis results.
| Indicators | Pearson Correlation (R) | Significance (P) | Correlation | |
|---|---|---|---|---|
| Urban comprehensive vitality | Population density | 0.653 ** | 0.06 | High |
| Building density | 0.718 ** | 0.002 | High | |
| The proportion of professional technicians | 0.621 * | 0.10 | High | |
| The proportion of population aged 18–35 | 0.747 ** | 0.001 | High |
Note: ** and * indicate significance at the 1% and 5% levels, respectively. Data source: ① 2020 Shanghai Population Census Yearbook (Download version). https://tjj.sh.gov.cn/tjnj_rkpc/20220829/734169a3ce96405e88917bebd78376bf.html (accessed on: 10 October 2022). ② 2020 Shanghai Statistical Yearbook. ③ 2020 Statistical Yearbooks of Shanghai Districts. ④ The comprehensive vitality of the city is our calculated value.
Disclaimer/Publisher’s Note: The statements, opinions and data contained in all publications are solely those of the individual author(s) and contributor(s) and not of MDPI and/or the editor(s). MDPI and/or the editor(s) disclaim responsibility for any injury to people or property resulting from any ideas, methods, instructions or products referred to in the content. |
© 2023 by the authors. Licensee MDPI, Basel, Switzerland. This article is an open access article distributed under the terms and conditions of the Creative Commons Attribution (CC BY) license (https://creativecommons.org/licenses/by/4.0/).
Share and Cite
MDPI and ACS Style
Shi, Y.; Zheng, J.; Pei, X. Measurement Method and Influencing Mechanism of Urban Subdistrict Vitality in Shanghai Based on Multisource Data. Remote Sens. 2023, 15, 932. https://doi.org/10.3390/rs15040932
AMA Style
Shi Y, Zheng J, Pei X. Measurement Method and Influencing Mechanism of Urban Subdistrict Vitality in Shanghai Based on Multisource Data. Remote Sensing. 2023; 15(4):932. https://doi.org/10.3390/rs15040932
Chicago/Turabian StyleShi, Yishao, Jianwen Zheng, and Xiaowen Pei. 2023. "Measurement Method and Influencing Mechanism of Urban Subdistrict Vitality in Shanghai Based on Multisource Data" Remote Sensing 15, no. 4: 932. https://doi.org/10.3390/rs15040932
Note that from the first issue of 2016, this journal uses article numbers instead of page numbers. See further details here.