
Roméite-Group Minerals Review: New Crystal Chemical and Raman Data of Fluorcalcioroméite and Hydroxycalcioroméite


1
São Carlos Institute of Physics (IFSC), University of São Paulo (USP), São Carlos 13566-590, SP, Brazil
2
Laboratory of Physics (LABFIS), Amapá State University (UEAP), Macapá 68900-070, AP, Brazil
3
Institute of Geosciences (IGc), University of São Paulo (USP), São Paulo 05508-080, SP, Brazil
*
Author to whom correspondence should be addressed.
Minerals 2021, 11(12), 1409; https://doi.org/10.3390/min11121409
Submission received: 22 November 2021
/
Revised: 7 December 2021
/
Accepted: 8 December 2021
/
Published: 13 December 2021
(This article belongs to the Special Issue Pyrochlore Supergroup and Their Crystal Structures)
Abstract
:The roméite-group is part of the pyrochlore-supergroup and comprises cubic oxides of A2B2X6Y formula in which Sb5+ predominates in the B-site. The A and Y main occupants determine different minerals in the group and are important for the discovery of new mineral species. Two different roméite-group mineral samples were analysed by electron microprobe analysis (EMPA), Raman spectroscopy and single-crystal X-ray diffraction (XRD). The first sample is from Prabornaz Mine (locality of the original roméite), Saint Marcel, Valle d’Aosta, Italy, whereas the other one occurs in Kalugeri Hill, Babuna Valley, Jakupica Mountains, Nezilovo, Veles, Macedonia. Sample 1 was identified as fluorcalcioroméite, and sample 2 as hydroxycalcioroméite. Both samples belong to the cubic crystal system, space group Fdm, Z = 8, where a = 10.2881(13) Å, V = 1088.9(4) Å3 for sample 1, and a = 10.2970(13) Å, V = 1091.8(4) Å3 for sample 2. The crystal structure refinements converged to (1) R1 = 0.016, wR2 = 0.042; and (2) R1 = 0.023, wR2 = 0.049. Bond-valence calculations validated the crystal structure refinements determining the correct valences at each crystallographic site. Discrepancies observed in the Sb5+ bond-valence calculations were solved with the use of the proper bond valence parameters. The resulting structural formulas are (Ca1.29Na0.55□0.11Pb0.05)Σ=2.00(Sb1.71Ti0.29)Σ=2.00[O5.73(OH)0.27]Σ=6.00[F0.77O0.21(OH)0.02]Σ=1.00 for sample 1, and (Ca1.30Ce0.51□0.19)Σ=2.00(Sb1.08Ti0.92)Σ=2.00O6.00[(OH)0.61O0.21F0.18]Σ=1.00 for sample 2. The Raman spectra of the samples exhibited the characteristic bands of roméite-group minerals, the most evident corresponding to the Sb-O stretching at around 510 cm−1.
1. Introduction
The roméite-group is part of the pyrochlore-supergroup and comprises cubic oxides of A2B2X6Y formula in which Sb5+ predominates in the B-site. The A and Y main occupants determine different minerals in the group and are important for the discovery of new mineral species. As a source of Sb, the roméite-group minerals are economically relevant. However, only five roméite-group mineral species, namely fluorcalcioroméite, hydroxycalcioroméite, hydroxyferroroméite, oxycalcioroméite, and oxyplumboroméite have been completely characterized and approved by the International Mineralogical Association (IMA). Many others might be discovered from possible chemical substitutions at crystallographic sites.
1.1. Pyrochlore Supergroup
The pyrochlore supergroup comprises cubic and trigonal oxides of A2B2X6Y formula. The nomenclature of pyrochlore-supergroup minerals is based on the dominant valences of the ions present in the A, B and Y sites. The correct identification of each mineral in this supergroup is only possible by combining different analytic methods that investigate crystal structure and chemical composition, among other properties.
This supergroup was named after the generic name ‘pyrochlore’. This name is derived from the Greek terms for fire (pyro) and green (chlore), as an allusion to the fact that the mineral becomes green under ignition. This name was first introduced by J. J. Berzelius for a cubic mineral found by N. O. Tank around 1826 in a syenitic pegmatite deposit—a raw grained rock with low quartz (max. 5%) [1]—in Stavern (previously Fredriksvärn), Norway [2]. Hogarth [3] introduced a new classification of the “pyrochlore group”, as it was known by that time. However, this system did not fully attend to the current classification rules of the International Mineralogical Association (IMA). The nomenclature was further revised by Atencio et al. [4], and approved by the IMA’s Commission on New Minerals, Nomenclature and Classification (CNMNC). This was done to ensure that the classification is consistent with the current definitions of group and supergroup nomenclature [5]. More recently, a new study brought clarity to the status of some pyrochlore-supergroup species [6].
The pyrochlore-supergroup minerals crystalize mostly in the cubic system, usually in the space group Fdm. However, there are species characterized in other space groups, such as hydroxycalciomicrolite [7] which crystalizes in the P4332 space group. However, some other mineral species crystallize in the trigonal system, for instance: hydrokenoelsmoreite [8], which occurs as 3C (Fdm) and 6R (R) polytypes; hydrokenomicrolite, which occurs as 3C (Fdm) and 3R (Rm) polytypes [9], and fluornatrocoulsellite, which crystallizes as 3R (Rm) polytype [10].
According to the A2B2X6Y1 general formula for the pyrochlore-supergroup species, the crystallographic site A (16d) is typically occupied by a cation of ionic radii greater than 1.0 Å [Na+, Ca2+, Sr2+, Pb2+, Sn2+, Sb3+, Y3+, U2+, or less frequently Ag+, Mn2+, Ba2+, Fe2+, Bi3+, Ce3+ (and other REE), Sc3+ or Th4+], or by H2O. There is also the possibility of vacancy occurring in this site.
B-site (16c) is typically occupied by smaller cations such as Ta5+, Nb5+, Ti4+, Sb5+, W6+, V5+, Sn4+, Zr4+, Hf4+, Fe3+, Mg2+, Al3+, and Si4+. According to the literature, vacancy is not frequently found in this site, except for extreme cases of secondary alteration [4]. This total occupation of B-site has been observed both in natural and synthetic minerals [10]. Some features of energetic nature and stability also help to understand the total fulfilment of this crystallographic site. B-site is more compact, with a lower coordination number, 6, as well as bonds shorter than the ones present in the A-site. As such, the ions capable of being held in this site have ionic radii varying from 0.40 Å to 0.78 Å [11]. All of this contributes to the higher stability of the B-site.
In the X-site (48f) typically O2− or F− are predominant, but it can also contain small amounts of the OH−. The Y-site (8b) is typically occupied by anions like O2−, F−, OH−, but it can also comprise H2O or even a large monovalent cation (>>1.0 Å), for instance: K+, Cs+, Rb+. This site can also present vacancies.
The pyrochlore supergroup is currently divided into seven groups based on the dominant valences and atomic proportions of the atoms in the B-site: pyrochlore (Nb5+), microlite (Ta5+), betafite (Ti4+), roméite (Sb5+), elsmoreite (W6+), ralstonite (Al3+), and coulsellite (Mg2+).
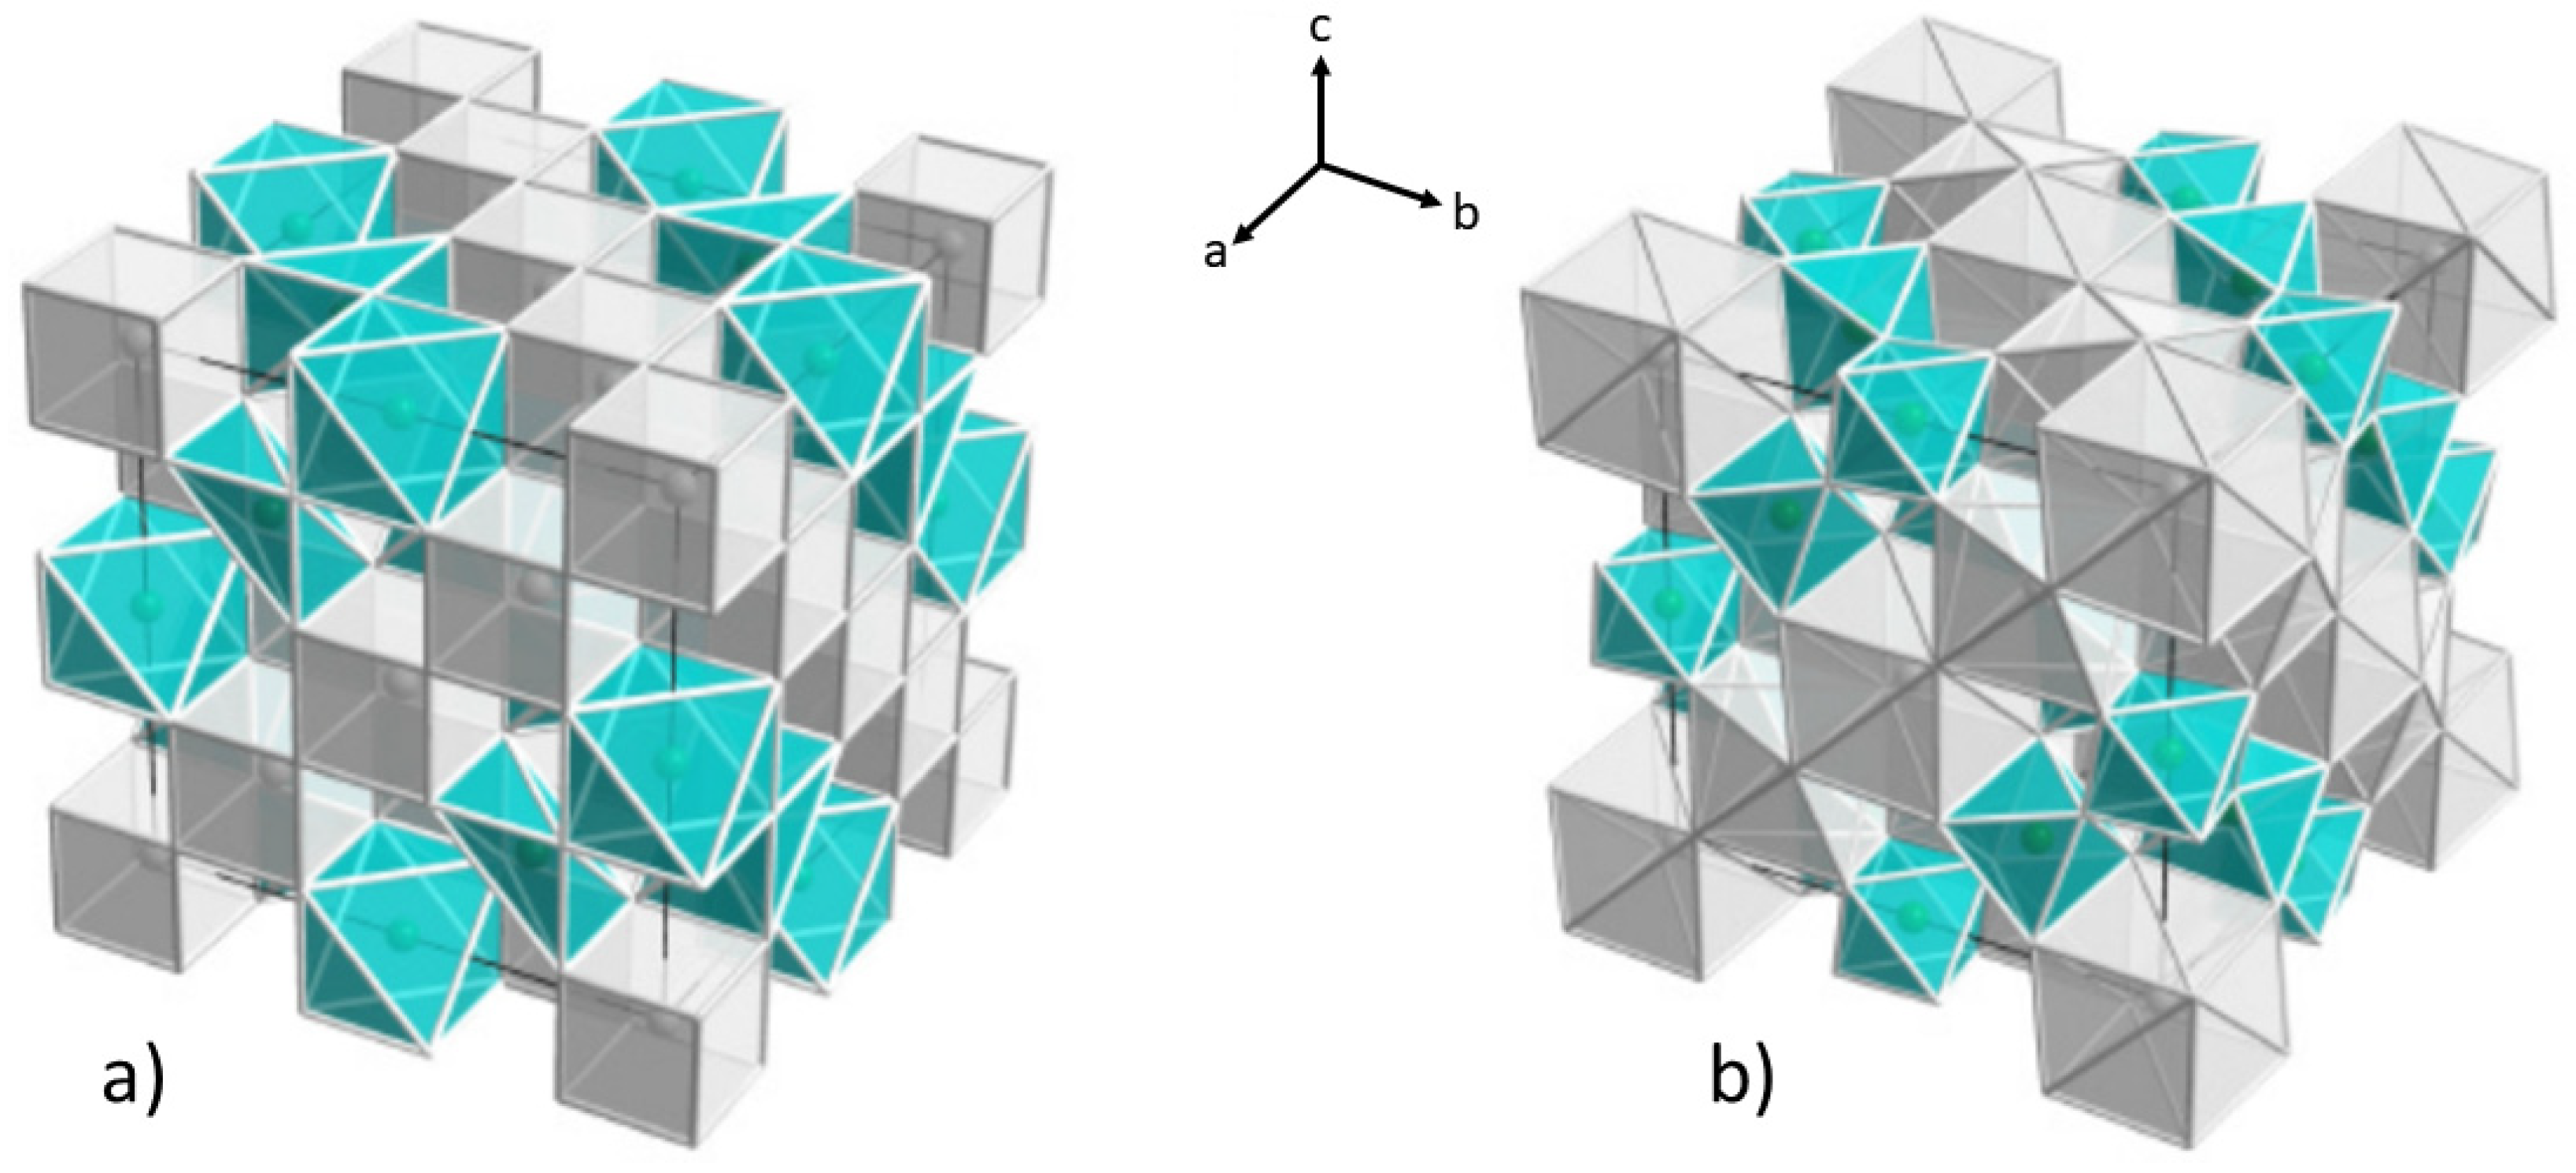
The positional parameter x of the O atoms at the X site (48f) can be refined, and the result allows estimation of the distortion of the coordination polyhedrons of the cations centered in the A and B-sites [12].
The x parameter usually varies from 3⁄8 = 0.3750 to 5⁄16 = 0.3125. In the first case, A is located at the center of a regular cube and B at the center of a trigonal antiprism. For x = 0.3125, A-site form a trigonal scalenohedron and B-site, in turn, becomes a regular octahedron, sharing vertices with 6 other neighbor octahedrons. These situations are shown in Figure 1.
1.2. Roméite-Group Minerals
The roméite-group is part of the pyrochlore supergroup and is characterized by oxides with predominance of Sb5+ in the crystallographic site B. The group’s name is based on the term ‘roméite’, used first by Augustin Alexis Damour in 1841 in honour of Jean Baptiste Louis Romé de L’Isle (1736–1790), an officer of the French army who developed the science of crystallography while private curator for rich collectors of coins and minerals. Romé de L’Isle also became known as the “father of crystallography” [13].
At first, the roméite-group minerals were not included in the pyrochlore group, which was constituted at that time only of the subgroups “pyrochlore”, “betafite” and “microlite” [3]. The same absence occurred for the minerals of the current elsmoreite-group, characterized by the dominance of W6+ in the B-site. These species were treated as antimonates (roméite) and tungstates (elsmoreite) instead of conventional oxides. The nomenclature of [4] included roméite and elsmoreite-groups in the pyrochlore supergroup, once these group’s species present Sb5+ and W6+ in octahedral coordination with oxygen and the pattern formed by these octahedrons result in the “pyrochlore” structure. Furthermore, the species containing Sb5+ and W6+ present many degrees of solid solutions with other supergroup members [14].
Roméite-group minerals are rare, normally found in yellow and dark brown colors. They are a source of Sb and other rare metals. They are insoluble in water and acetone and are associated with andradite Ca3Fe3+2(SiO4)3, braunite Mn2+Mn3+6O8(SiO4), hematite Fe2O3, calcite CaCO3, diopside CaMgSi2O6, quartz SiO2, and wallkilldellite-(Mn) Ca2Mn2+3(AsO4)2(OH)4·9H2O. Antimony can be obtained from roméite-group minerals in its oxide form Sb2O3, an alternative way to obtain this metal, which is usually obtained from the mineral stibnite (Sb2S3) by fusion with iron. Antimony is used in many applications as the production of metal alloys of Sn and Pb and in the cosmetic industry. To mention some further applications, it is used as a protective layer (obtained by electroplating) on steels to prevent rust and as a flame retardant in foams for mattresses and other furniture [15]. Beyond this, compounds of pyrochlore structure present magnetic geometric frustration and have been intensely investigated in recent decades [16].
Due to the interstices present in their structure, roméite-group minerals can be host to many rare elements. The presence and distribution of these other elements can indicate important information about the nature and conditions of the crystallization of the host rock.
Existing data for the roméite-group mineral are scarce, although these minerals present a variety of colors and, as preliminary results suggest, great variety in chemical composition. Given that the nomenclature system of the pyrochlore-supergroup minerals was recently modified, there is a great possibility of new species being discovered, since only five roméite-group species were fully characterized: hydroxycalcioroméite [17,18,19], oxycalcioroméite [20,21], fluorcalcioroméite [14,22,23,24], oxyplumboroméite [21,25] and hydroxyferroroméite [26]. This work aimed to correct some deficiencies related to this group that still persist.
The main goal of this work is to characterize roméite-group minerals using Raman spectroscopy, electron microprobe and single-crystal X-ray diffraction, defining species according to IMA rules.
1.3. Roméite-Group Mineral Species
As mentioned before, there are only five roméite-group minerals currently completely described and approved by IMA. However, there is also a species (fluornatroroméite) with analytic evidence considered adequate, although not approved; one recently discredited (cuproroméite) after being pointed out as “possible”; and three species (argentoroméite, stibioroméite, and bismutoroméite) only “probable” in the literature, having been insufficiently characterized, especially in regard to the Y-site content, so that it is not possible to establish correlation with the exact mineral species within the currently nomenclature scheme [6]. Table 1 summarizes the current status of the roméite-group minerals (2021).
The roméite-group species are briefly described below, presenting a summarized history of their crystallo-chemical descriptions, and differentiating them by the classification: A—approved; N—not approved; D—discredited; P—probable.
1.3.1. Hydroxycalcioroméite (A)
Previously known as lewisite, the crystal structure of this mineral was initially determined by Rouse et al. [18] and later by Zubkova et al. [19]. The type-sample for ‘lewisite” has been described by Hussak and Prior [17] and become the type-specimen for hydroxycalcioroméite after the new nomenclature system [4]. The type-locality for this mineral is Fazenda Três Cruzes, Tripuí, Ouro Preto, Minas Gerais, Brazil.
The general formula is (Ca,Sb3+)2(Sb5+,Ti)2O6(OH), IMA 2010 s.p., and the empirical formula, based on two cations in the B-site is (Ca0.91Sb3+0.27Fe0.19Al0.10Na0.10Mg0.06)∑ = 1.63(Sb5+1.28Ti0.72)O6(OH). The crystal structure of hydroxycalcioroméite has cubic unit cell, space group Fdm, with = 10.311(7) Å, V = 1096.23 Å3 and Z = 8 [19]. Rouse et al. [18] solved and refined the crystal structure for this mineral in three different space groups: Fdm, F4m (pseudo-Fdm) and F23, with a = 10.277(1) Å, V = 1085.45 Å3 and Z = 8, for all the three space groups.
The associate minerals are “xenotime”, “monazite”, zircon, kyanite, “tourmaline”, rutile, hematite, pyrite, magnetite, gold, cinnabar, tripuhyite, derbylite, florencite-(Ce), muscovite, quartz and others. It occurs as yellow brown octahedra, transparent, up to 1 mm or as earthy mass. Its luster is vitreous to resinous, hardness is approximately 5.5 Mohs, and density is 4.95 g/cm3. As for tenacity, it is brittle, cleavage is perfect in {111} and fracture is conchoidal. Streak is pale brown-yellow.
1.3.2. Oxycalcioroméite (A)
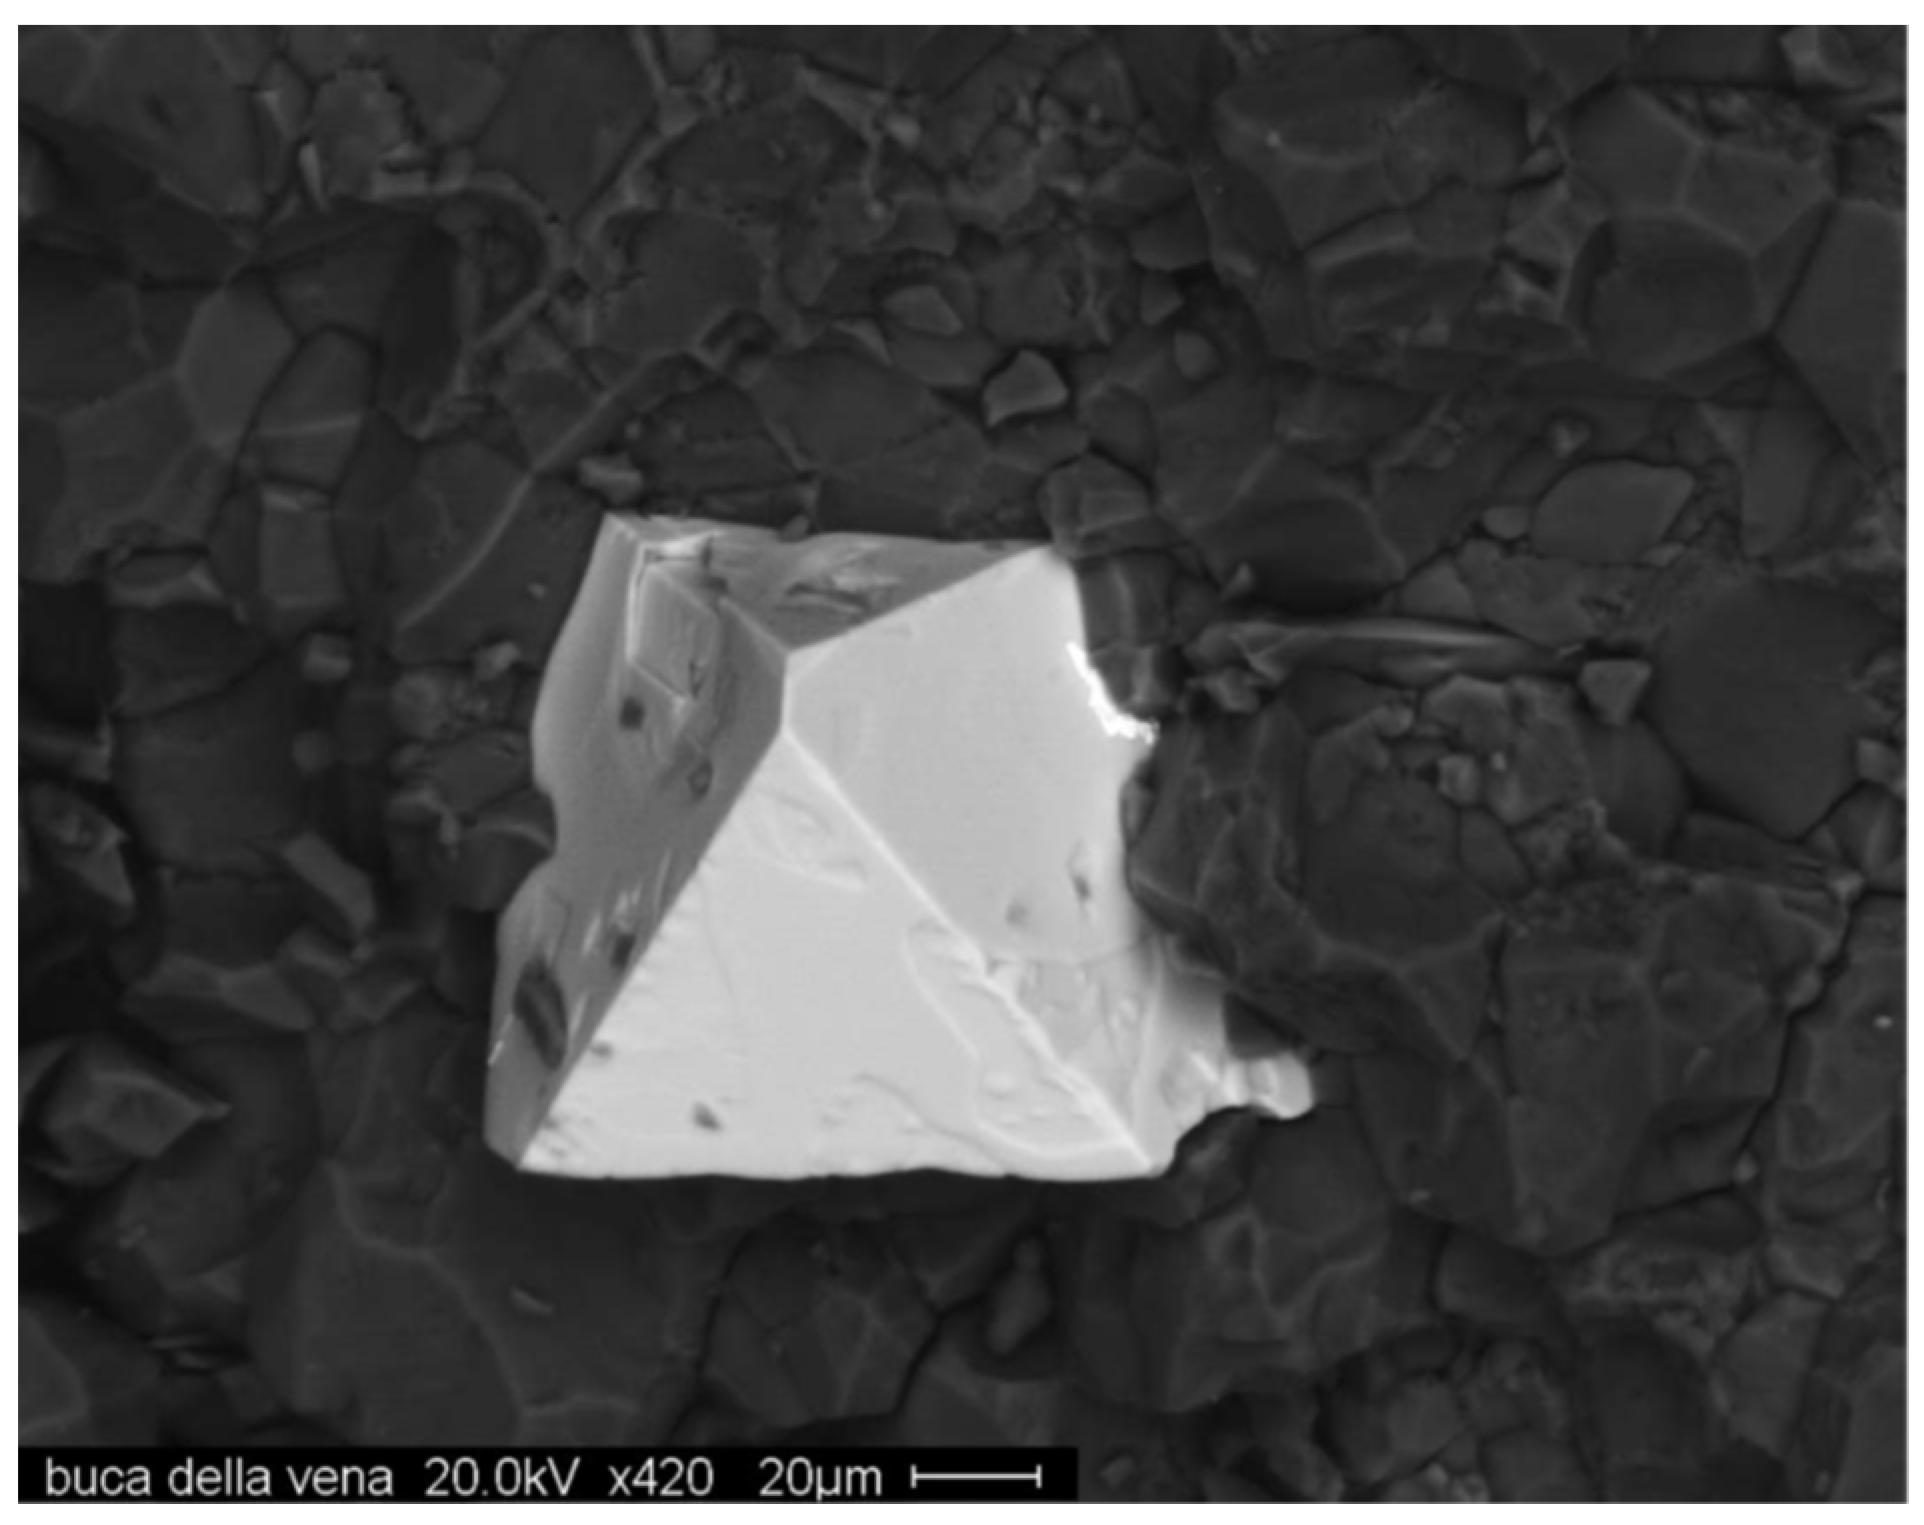
First reported by Christy and Gatedal [20], it was later characterized by Biagioni et al. [21]. The type-locality for this mineral is Bucca della Vena mine, Ponte Stazzemezze, Stazzema, Alpes Apuam, Tuscany, Italy. The IMA number is 2012-093.
It occurs as a euhedral octahedron, with size up to 0.1 mm, incorporated to dolomite lenses in baryte, pyrite and iron oxide ores. The associated minerals are calcite, cinnabar, derbylite, dolomite, hematite, “mica”, pyrite, sphalerite and “tourmaline”. Oxycalcioroméite is reddish-brown, transparent and isotropic, with ncalc = 1.950.
The general formula is Ca2Sb25+O6O [21], and the empirical formula, based in 2 cations in the B-site, is (Ca1.073Fe2+0.338Sb3+0.330Na0.118Pb0.013Mn0.008)∑ = 1.880(Sb5+1.734Ti0.194V0.040Al0.024Sn0.008)∑ = 2.000(O6.682F0.278)∑6.960. Concerning the crystal structure, oxycalcioroméite has cubic unit cell, space group Fdm, with = 10.3042(7) Å, V = 1094.06(13) Å3, Z = 8. Figure 2 shows an image of this mineral.
1.3.3. Fluorcalcioroméite (A)
First reported by Brugger et al. [22], Uher et al. [23] and Brugger and Gieré [14], it was completely characterized by Atencio et al. [24]. The type locality for this mineral is Starlera mine, Starlera valley, Ferrera valley, Grischun, Switzerland.
Its general formula is (Ca,Na)2Sb5+2(O,OH)6F. The IMA number is 2012-093. It occurs as a euhedral octahedron, untwinned and with a size up to 0.1 mm. The crystals are yellow-orange and transparent. Streak is white, and luster is vitreous-resinous. It is non-fluorescent under violet light, Mohs hardness is ~5, and tenacity is brittle. Cleavage was not observed, and fracture is conchoidal. Its density is 5.113 g/cm3, and the mineral is isotropic, with ncalc = 1.826.
The empirical formula, based in two cations in the B-site, is (Ca1.16Na0.56□0.22) Fe2+0.03Mn2+0.03)∑ = 2.00(Sb5+1.98Al0.01W0.01)∑ = 2.00O6(F0.62(OH)0.28O0.06□0.04)∑ = 1.00. Concerning the crystal structure, it has cubic unit cell, space group Fdm, with = 10.284(2) Å, V=1087.7(7) Å3, Z = 8. Figure 3 shows an image of this mineral.
1.3.4. Oxyplumboroméite (A)
Initially named bindheimite, it was reported by Dana [28]. Atencio et al. [4] suggested a correlation with oxyplumboroméite due to the new nomenclature, supported by the data of [20], and also pointed out that the mineral monimolite, reported by Igelström [29] and by Mason and Vitaliano [30], could also correspond to oxyplumboroméite. Finally, oxyplumboroméite was completely characterized by Hålenius and Bosi [25]. The type-locality for this mineral is Harstigen mine, Pajsberg, District of Pajsberg, Filipstad, Värmland, Sweden.
It has the general formula Pb2Sb5+2O7. The IMA number is 2013-042. It occurs as round grains or imperfect octahedra, with sizes up to 0.1 mm. The crystals have color varying from yellow to brownish-yellow and are transparent. Its Mohs hardness is ~5, its density is 6.732 g/cm3, and the mineral is isotropic with ncalc = 2.061.
The empirical formula, based in two cations in the B-site, is (Pb0.92Ca0.87Mn0.09 Na0.05Sr0.01)∑ = 1.93(Sb5+1.73Fe3+0.27)∑ = 2.00O6[O0.64(OH)0.03]∑ = 0.67. It is cubic, space group Fdm, with = 10.3783(6) Å, V = 1117.84(11) Å3, Z = 8. Figure 4 shows an image of this mineral.
1.3.5. Hydroxyferroroméite (A)
Found by Georges Favreau in 2012, this mineral was completely characterized by Mills et al. [26]. The type-locality for this mineral is Correc d’en Llinassos, Oms, Pyrénées-Orientales, Occitanie, France.
It has the general formula (Fe2+1.5□0.5)Sb5+2O6(OH). The IMA number is 2016-006. It occurs as small crystals up to 50 μm in a quartz-siderite matrix. The crystals vary between yellow and yellowish-brown and are opaque. Luster is vitreous and fracture is conchoidal. No other physical properties could be measured because of the lack of size-adequate crystals of this mineral [26].
The empirical formula based on seven atoms in the anionic positions is (Fe2+1.07Cu2+0.50Zn0.03Sr0.03Ca0.01□0.36)∑ = 2.00(Sb5+1.88Si0.09Al0.02As0.01)∑ = 2.00O6[(OH)0.86O0.14]. Hydroxyferroroméite has cubic unit cell, space group Fdm, with = 10.25(3)Å, V = 1077(6) Å3, Z = 8. Figure 5 shows an image of this mineral.
1.3.6. Fluornatroroméite (N)
1.3.7. Cuproroméite (D)
Reported by Arents [32], it received initially the name partzite. Atencio et al. [4] pointed out that it could probably be cuproroméite. However, due to the absence of electron microprobe data, the material had to be chemically and structurally analysed to be then approved as a new mineral species. New analysis by single-crystal X-ray diffraction and electron microprobe were conducted on the type-specimen and the mineral was discredited by Mills et al. [27], who noted that it was a mixture of various phases, the two main ones being an oxide phase similar to plumboroméite and an amorphous phase of copper silicate similar to chrysocolla.
1.3.8. Argentoroméite (P)
1.3.9. Stibioroméite (P)
1.3.10. Bismutoroméite (P)
2. Occurrence and Geological Background
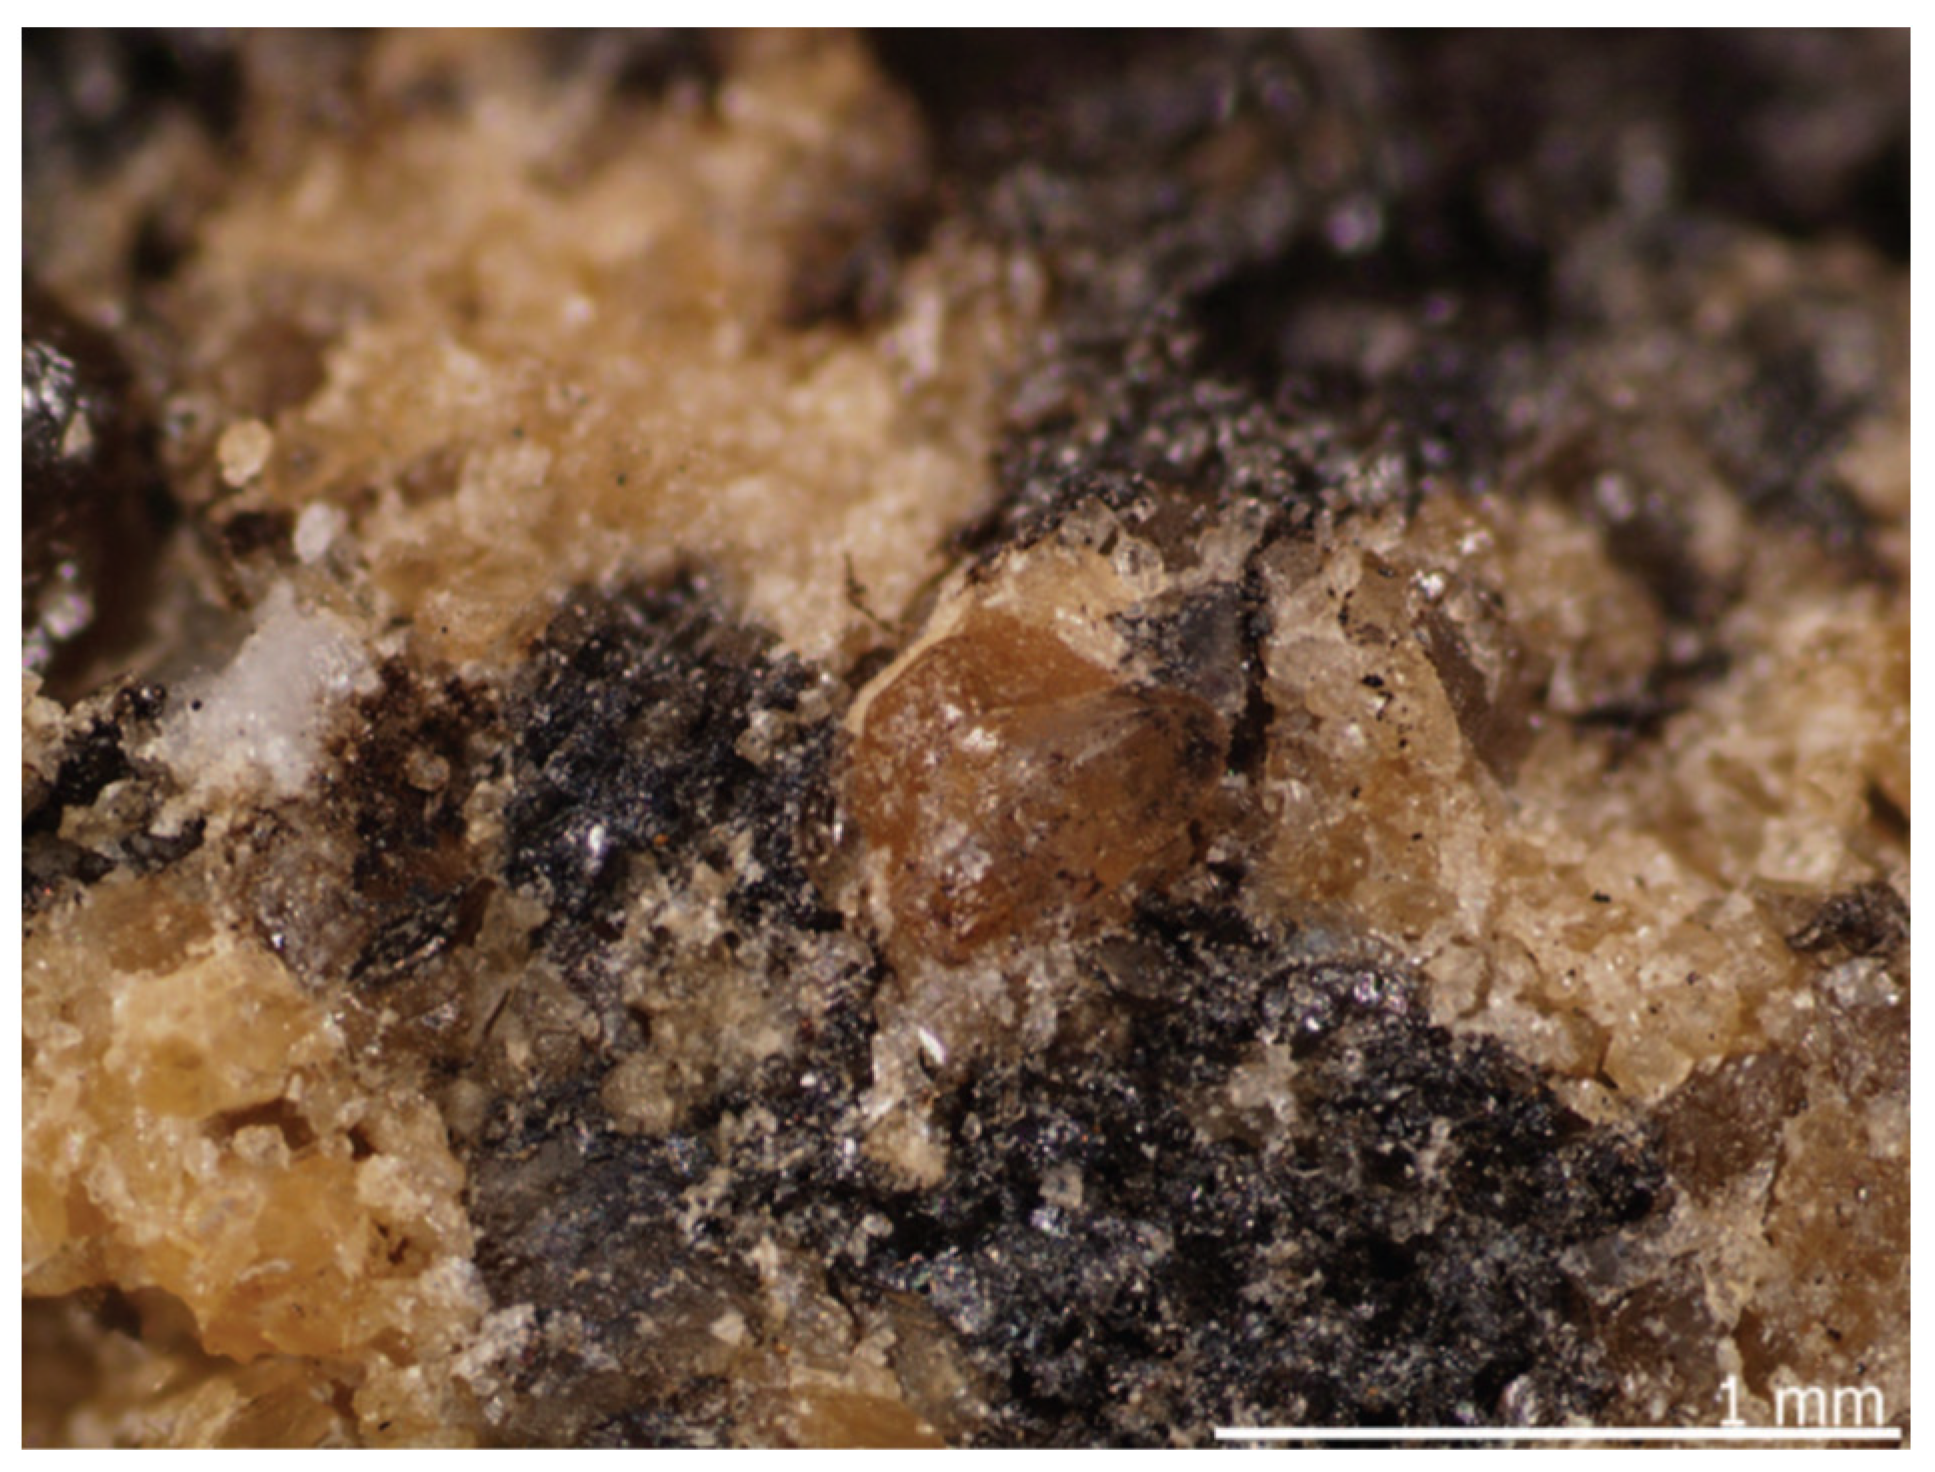
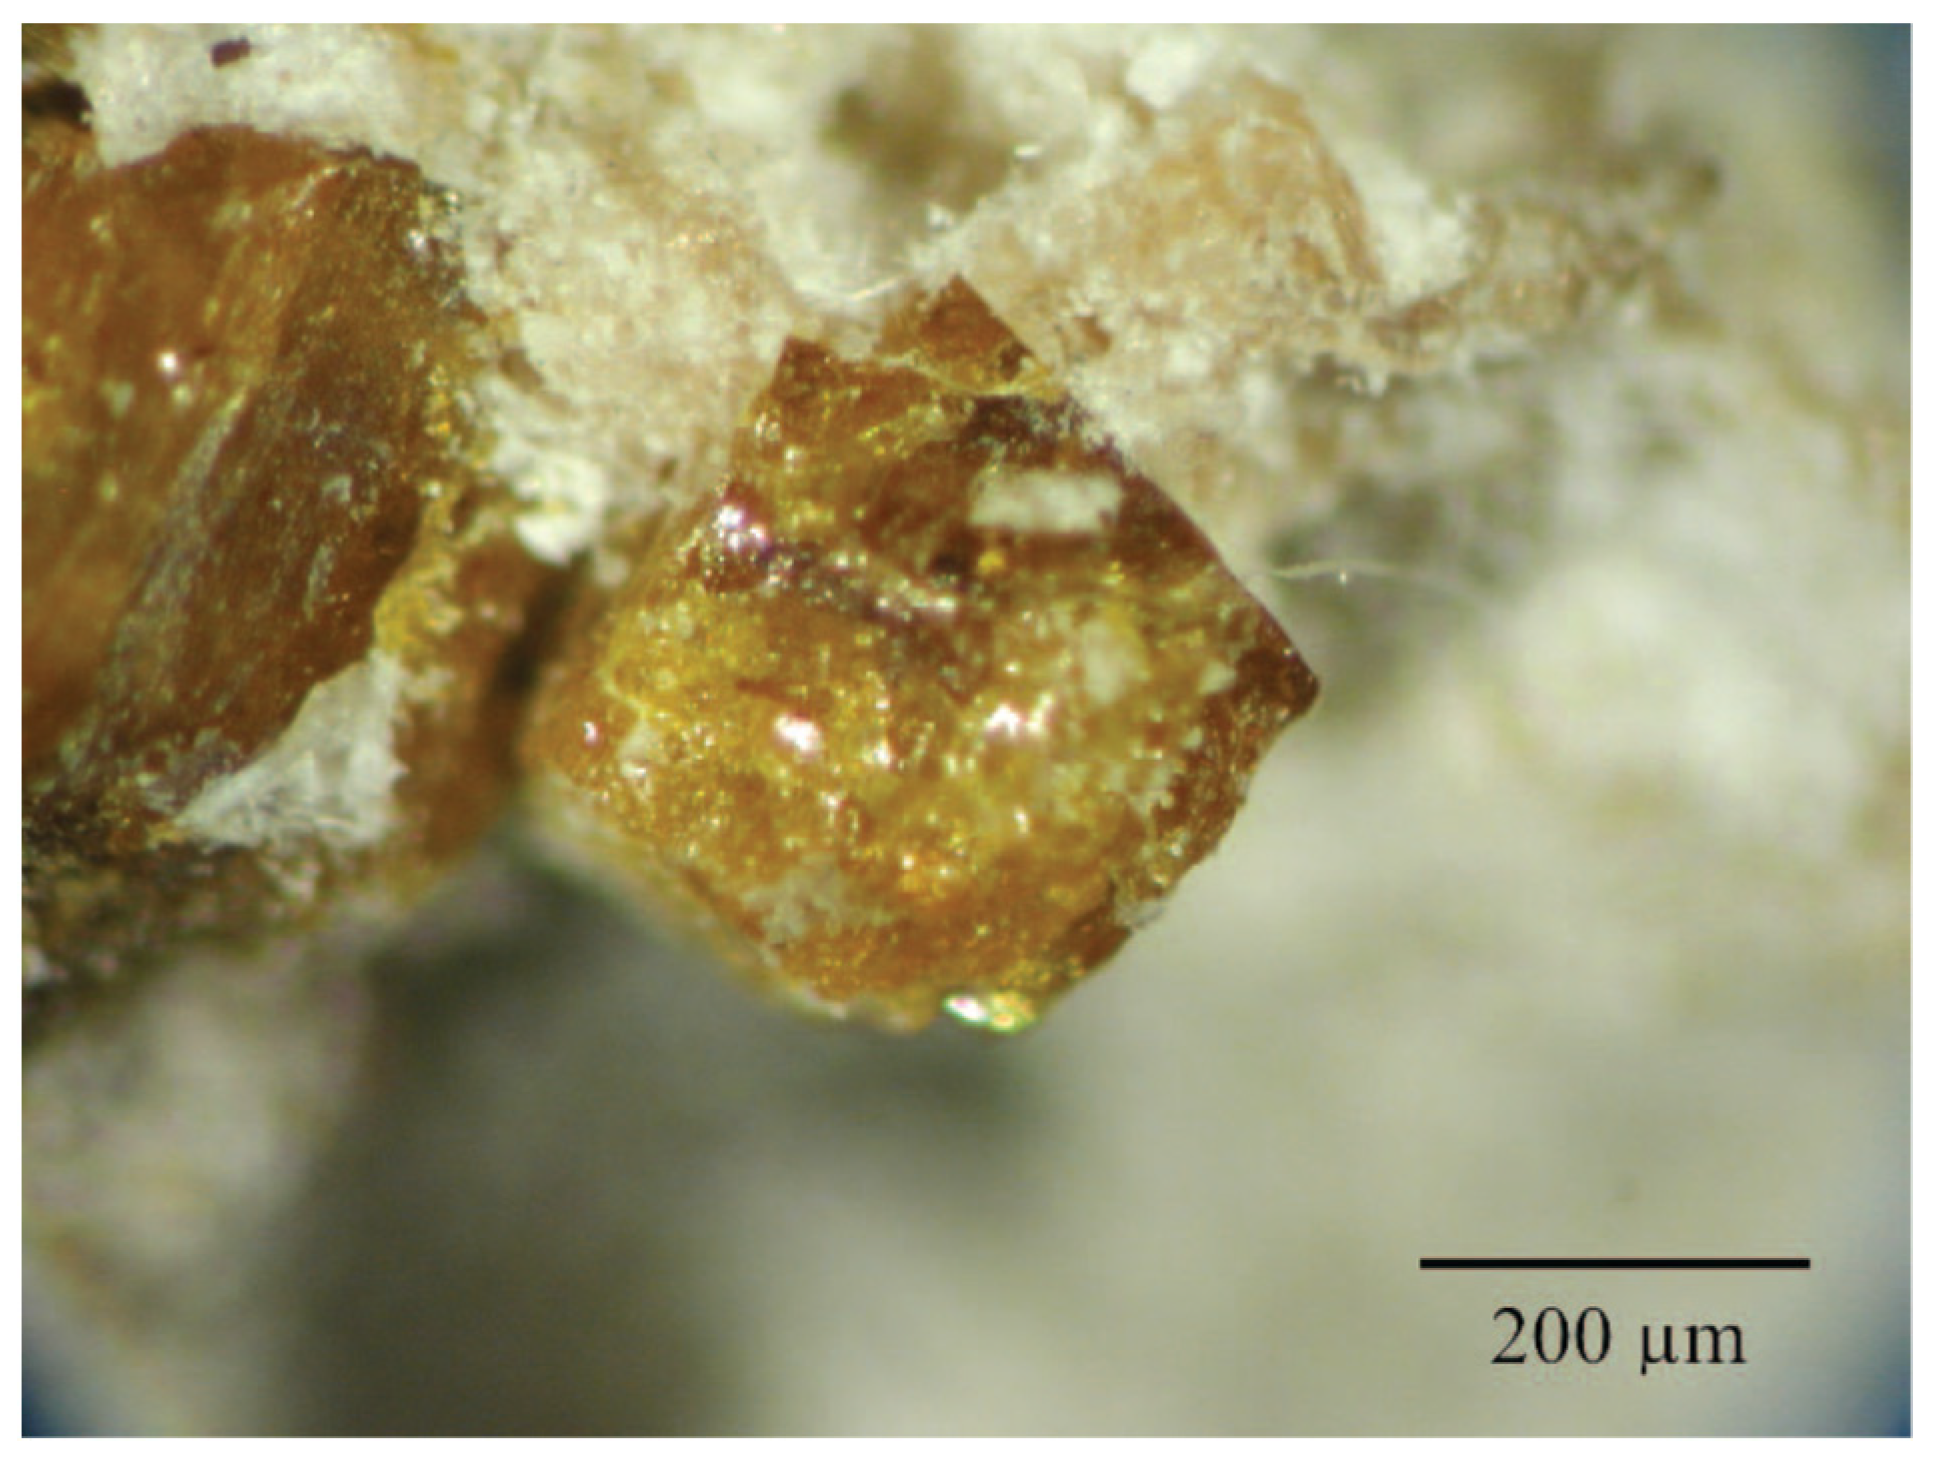
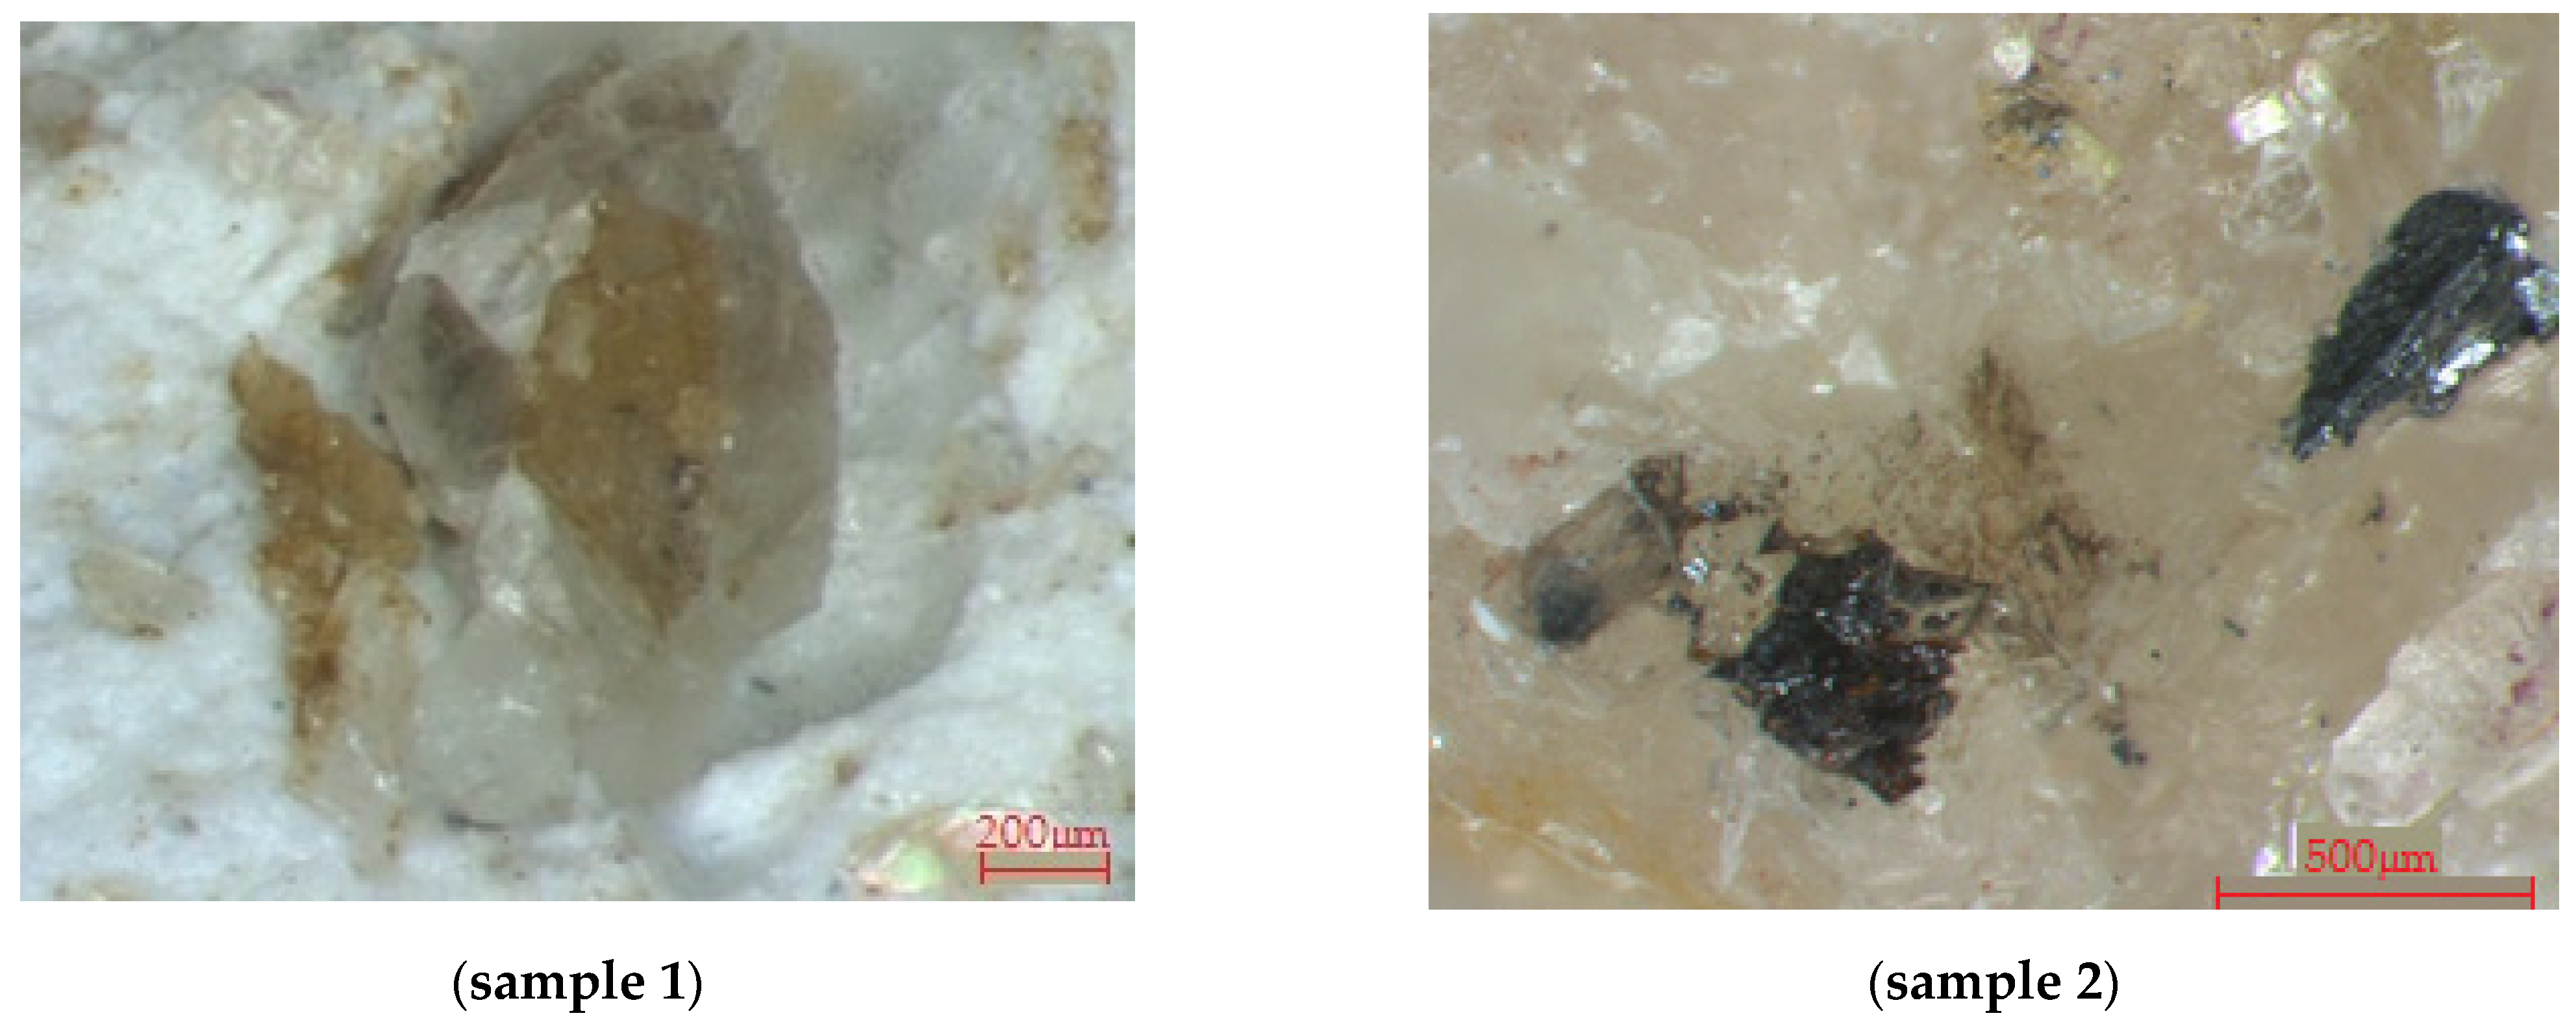
Both samples are shown in Figure 6 and their occurrences are described below.
The occurrences of the samples are described below.
- Prabornaz mine, Saint Marcel commune, Aosta valley, country: Italy (Sample 1)
It is worth mentioning that the original sample which gave the group its name is from Prabornaz mine, Italy. Prabornaz is a region of volcanic rocks, with age from the Cretaceous period (66–145 million years ago) and may include hypabyssal intrusions [35]. Prabornaz mine is located in the northwest of Italy, 45°40′45″ north and 7°26′57″ east. It is the type-locality for braunite, piemontite, manganiandrosite-(Ce) and strontiomelane. The manganese concentrations of Prabornaz are restricted to a unit of quartzite of 4 × 8 m thick of diverse lithologies, which represents the basal part of the metasedimentary rocks covering an ophiolite. Together, they constitute the Piemonte Nappe, which was metamorphized until facies eclogite in the Cretaceous period and retreated in the early Tertiary.
The quartzite unit is comprised of a succession of silicon levels characterized by minerals that host Mn which reflect difference in chemical composition and in the fugacity of oxygen inherited of the original sediments. The paragenesis evolved during the alpine multiphasic metamorphism that was going through an event pre-eclogite of blue schist facies, the main eclogite facies event and the various stages after eclogite that ended in the green schist facies. These concentrations of Mn were later penetrated by various transversal vein nets and late fractures which were responsible for the mobilization of certain elements, in particular K, Sr and Ba [36].
- Kalugeri Hill, Babuna valley, Jakupica mountains, Nezilovo settlement, city: Veles, country: Macedonia (Sample 2)
Kalugeri Hill is a locality in the center of the Republic of North Macedonia, 41°34′ north and 21°34′ east. It is located 15 km northeast from the Nezilovo settlement, and it is the type-locality of the mineral nežilovite.
Kalugeri is a predominantly oxide (almost without silicates) mineral association characterized by extremely high concentrations of Zn and Pb, as well as a substantial (but subordinate) role of Sb and As. The major minerals of the rock are gahnite, franklinite and hetaerolite. The rock is crossed by hydrothermal veinlets that are up to 8 mm thick and are composed of a complex of oxide minerals with predominant ferricoronadite. Two zones can be distinguished in the Zn-oxide rock. One (spinellide zone) is mainly composed of the fine-grained aggregate of gahnite, with subordinate franklinite and hetaerolite. Another (spinellide-zincohögbomite zone) is enriched in a högbomite-group mineral that forms epitaxial intergrowths with Zn-spinellides [37].
3. Materials and Methods
3.1. Electron Microprobe
Electron microprobe analysis (EMPA) were performed with a CAMECA SX-100 electron probe microanalyzer, CAMECA, Gennevilliers Cedex, France, in wavelength dispersive spectroscopy (WDS) mode, and the resolution of the analysis was approximately 10 eV. Results are shown in Table 2.
The analytical conditions applied for the sample 1 were 25 kV accelerating voltage, 20 nA beam current, 1 μm beam diameter and the following standards: Ti: rutile; F: MgF2; Na: albite; Al: bas498 (Basalt glass); Fe: bas498 (Basalt glass); Si: wollastonite; Ca: wollastonite; Mn: rhodochrosite; Pb: wulfenite; Cu: chalcopyrite; Zn: gahnite; Ce: REE3 (glass); Y: YAG garnet; U: UO2; W: scheelite.
The analytical conditions for sample 2 were 20 kV accelerating voltage, 20 nA beam current, 1 μm beam diameter and the following standards: F: MgF2; Na: albite; Ca: anorthite; Ce: REE3 (glass); Ti: rutile; Mn: rhodochrosite; Fe: fayalite; Sb: stibnite; Nb: LiNbO3; Th: ThO2; U: UO2.
3.2. Single-Crystal X-Ray Diffraction
Single-crystal X-ray diffraction analysis were performed using a Bruker APEX II CCD X-ray diffractometer, Bruker AXS Inc., Madison, WI, USA, equipped with graphite-monochromatized Mo-Kα radiation (0.71073 Å), with crystal-detector separation distance of 40.00 mm. All measures were performed until a resolution of 0.67 Å giving a maximum 2θ angular aperture of 64°. Absorption correction was done with SADABS [38] using the APEX2 software [39]. Structure solutions were done by Patterson method within SHELX-TL [39] and refinements were performed using SHELXL [40], within the WinGX platform [41].
3.3. Raman Spectroscopy
Raman spectroscopy analysis was performed using the System HORIBA LabRAM HR Evolution, EMU LabRam, equipped with a liquid nitrogen cooled charge coupled device (CCD) detector, belonging to the Centre of Characterization of Mineral Species (CCEM), located at São Carlos Institute of Physics of University of São Paulo, Brazil.
The two samples were analysed using a confocal microscope (Model BX41, Olympus Horiba France SAS, Villeneuve d’Ascq, France) with a focus ×50 LWD (N.A. 0.5) objective lens, 1800 gr/mm diffraction grating, and laser at 532 nm. The laser power on the sample was 1.5 mW. The spectrum range was from 100 to 1600 cm−1. No thermal damage was observed during the analysis.
4. Results and Discussion
4.1. Chemical Composition
Results of the chemical analysis for samples 1 and 2 are shown in Table 2.
The empirical chemical formulas are shown in Table 3.
Analysing the formulas of Table 3, it is possible to determine the nomenclature of the samples, using the nomenclature rules for the pyrochlore supergroup [4]. Sample 1 is the fluorcalcioroméite species, due to the predominance of F− in Y-site, Ca2+ in the A-site and of Sb5+ in the B-site. Sample 2, in turn, is the hydroxycalcioroméite species, due to the predominance of OH− in Y-site, Ca2+ in A-site and of Sb5+ in B-site. In this way no new minerals were identified among the analysed samples.
In the locality for sample 1, there are some reports of ‘roméite-group’ minerals given by James Dana, as cited by Palache et al. [42], but no detailed analysis is given. So this study gives the first complete description of fluorcalcioroméite mineral species in Prabornaz mine, Saint Marcel commune, Aosta valley, Italy.
In the locality for sample 2, there are some reports of occurrence of ‘roméite’. Brugger et al. [22] reports “roméite” mineral occurrence, and it was later identified as hydroxycalcioroméite [4]. Ermolaeva et al. [43] provide a chemical formula, from which it is possible to infer that the mineral species is hydroxycalcioroméite: (Ca1.30Ce0.49Na0.05Pb0.03Sr0.02Ba0.01La0.01U0.01)∑ = 1.92(Sb0.97Ti0.91Mn0.07Fe0.04Al0.01)∑ = 2.00O6[(OH)0.84O0.16]∑ = 1.00. Further, ref. [37] mentioned the presence of hydroxycalcioroméite as minor and accessory for minerals of the spinel group. Varlamov et al. [44] also mention the occurrence of hydroxycalcioroméite and fluorcalcioroméite at the same occurrence but did not present any complete description of these minerals. Therefore, this study confirms the occurrence and present a complete description of hydroxycalcioroméite mineral species in Kalugeri Hill, Babuna valley, Jakupica mountains, Nezilovo settlement, Veles, Macedonia.
4.2. Crystal Structure
4.2.1. Sample 1
This is a yellowish-orange crystal, with dimensions 0.10 mm × 0.07 mm × 0.04 mm, and with Miller indices intervals −18 ≤ h ≤ 7, −13 ≤ k ≤ 12, −14 ≤ l ≤ 8, and the following results were obtained: cubic system, space group Fdm, = 10.2881(13) Å, V = 1088.9(4) Å3 and Z = 8. A total of 976 reflections were collected, among which 193 are unique reflections.
The site occupation was calculated from the electron microprobe chemical analysis results. The A-position was initially assumed to be A(16d), and during the first refinement cycles the site occupations were constrained by the microprobe data obtained, and isotropic thermal parameters were used. The elements Sb and Ti were positioned at the B-site (16c), and the elements Ca, Na and Pb were positioned in the A-site. Due to the low concentration detected in microanalysis, Ce was treated as Pb during the refinement. In the final cycles, anisotropic thermal displacement parameters were used.
The final model, refined with anisotropic displacement parameters for all atoms converged to R1 = 0.016, wR2 = 0.042 and presented relatively low residual densities. It is worth noting that the final R1 value is practically equal to the Rint value.
4.2.2. Sample 2
A yellowish-orange crystal, with dimensions 0.02 mm × 0.02 mm × 0.01 mm was selected. The final lattice parameters were based on 152 reflections with the Miller indices intervals −13 < h < 9, −13 < k < 6, −15 < l < 4. A total of 653 reflections were collected, among which 121 were unique. The final model, refined with anisotropic displacement parameters for all atoms, converged to an R1 = 0.023, wR2 = 0.049, and presented residual densities smaller than 1.0 e.Å−3.
The elements Sb and Ti were considered allocated in the B-site, and for the A-site were considered the elements Ca and Ce. The rest of the elements were not considered due to their low concentration as obtained by the microanalysis. The refinement did not include O atoms either at the X-site or at the Y-site. However, the content of F detected by the microanalysis was included in the charge balance. The B-site was considered fully occupied (2 apfu).
Table 4 and Table 5 show the structural parameters obtained for samples 1 and 2, respectively, comparing to the previous complete description in the literature for each case.
It is possible to note in Table 4 that the unit cell dimension and volume for both samples are similar, with a small difference of ~0.01 Å. There is further published data for a fluorcalcioroméite sample, although it is not a complete description, given by Aia et al. [45], in which the authors found a unit cell dimension of 10.300 Å. So the sample from this study follows the tendency for this mineral species regarding unit cell dimensions.
In Table 5 is shown that the sample studied in this work is structurally similar and has an intermediate unit cell dimension when compared to those of [18] and [19]. Once again, the sample follows the tendency for this mineral species regarding unit cell dimension.
To determine the refined formula for sample 1, the contents of O and OH of the X-site (48f), and the contents of F and OH of the Y-site (8b), were calculated according to the charge balance requirements. Table 6 compares the formula obtained by microanalysis with that obtained after the refinement and charge balance procedure. Only small variations were observed in the absolute quantities of the ions Na+, Pb2+, Sb5+, Ti4+, O2- and OH, without varying; however, the elements’ relative molar quantities (that is, without varying the order that they appear based on their molar quantities) could modify the identification of the mineral species.
Both formulas are similar in terms of experimental error, mainly by considering the precision of the chemical determination by electron microprobe analysis. For instance, the percentage errors for cations Na+ and Pb2+ in this analysis were 0.13 and 0.76, respectively (according to microprobe data), being higher for Pb2+ since this cation is found in smaller concentration in the sample, decreasing the detection statistics and, therefore, the measurement precision. However, the percentage errors are low (<1%), and the obtained formulas can be considered satisfactory.
At this point it is possible to compare the data obtained with those from the literature. First, we compare the data in this study to those published by Bosi et al. [46] for a fluorcalcioroméite sample. The chemical formula obtained by the authors is (Ca1.07Na0.82□0.11)Σ2.00(Sb1.96Fe3+0.04)Σ2.00(O5.86F0.14)Σ6.00(F1.02) and shows similarity in the vacancy at the A-site, but displays some important differences compared to the data obtained in this study, although they are samples of the same mineral species. The first important difference is the absence of OH− in the anionic sites, which can be related to the environment conditions of formation of the samples, for instance presence of H2O and pH. The other main difference is the absence of the substituent Pb2+ in the A site and the presence of Fe3+ instead of Ti4+ in the B-site. These substitutions are related to the associate minerals present at their occurrence and the paragenesis of each mineral. The sample of [46] is from the Langban Mn-Fe deposit in Central Sweden, and this explains the presence of Fe in their sample.
We also compare the data from this study to the data obtained by Brugger et al. [22], which studied a sample from the same locality at the Prabornaz mine, Saint Marcel commune, Aosta valley, Italy. The sample of [18] is Fe-rich but is poor in F, and presents no significant content of Pb at the A-site or Ti at the B-site. The sample from this study describes a fluorcalcioroméite, which presents Pb and Ti, and its composition.
Furthermore, we compare the data from this study to the original data for the fluorcalcioroméite species, which were studied by Atencio et al. [24]. The chemical formula obtained by the authors is (Ca1.22Na0.54Mn0.06□0.18)Σ2.00Sb2.00O6.00(F0.62OH0.28O0.10), which shows a similar amount of OH and a slightly higher value for vacancy in the A-site, but not significantly different from the sample of this study. Despite these similarities and those in structure already shown in Table 4, the two samples also show some chemical differences, for instance B-site and X-site fully occupied by Sb and O, respectively, and the presence of Mn in the A-site. The sample of [24] is from Starlera Mine, Ferrera, Grischun, Switzerland and many Mn minerals (braunite, rhodonite, manganlotharmeyerite) have been reported in this locality, which explains the presence of Mn as a substituent at A-site. For instance, this is the type locality for manganlotharmeyerite [47].
Table 7 compares the formulas for sample 2 obtained by electron microprobe and that obtained by charge balance. Both are experimentally coincident regarding the molar quantities of the elements and can be considered satisfactory.
The authors [18] studied a hydroxycalcioromeíte sample from Tripuí, Ouro Preto district, Minas Gerais, Brazil, and the chemical formula obtained by the authors (re-written with 2 a.p.f.u in the B-site) was (Ca1.04□0.88Mn0.07Na0.01)∑ = 2.00(Sb0.99Ti0.76Fe3+0.19Al0.06)∑ = 2.00O6.00(OH0.91□0.09)∑ = 1.00. Two important differences compared to the formula from this work are the high value of the vacancy in the A-site and the existence of vacancy in the Y-site, due to charge-balance restrictions. It is possible to explain the presence of Fe as an important substituent in the sample from Tripuí, considering that many Fe minerals (hematite, magnetite, derbylite, tripuhyite) have been reported in this locality, for instance derbylite and tripuhyite, for which this is the type locality.
The study of [19] was carried out with another sample for the same locality in the Tripuí, Ouro Preto district, Minas Gerais, Brazil, and obtained the formula (Ca0.91□0.37Sb3+0.27Fe3+0.19Al0.10Na0.10Mn0.06)∑ = 2.00(Sb1.28Ti0.72)∑ = 2.00O6.00OH1.00. The vacancy value is intermediate between the values from this study and those obtained by Rouse et al. [18]. As for the sample of this study, the Y-site is fully occupied. Another important characteristic is that part of Sb is Sb3+, which was confirmed by the authors in the structural refinement.
Furthermore, we compare our data to those of [43]. The authors described the occurrence of hydroxycalcioroméite at the same locality of this study, Kalugeri Hill, Babuna valley, Jakupica mountains, Nezilovo settlement, Veles, Macedonia. The formula obtained by the authors is (Ca1.30Ce0.49Na0.05Pb0.03Sr0.02Ba0.01La0.01U0.01)∑ = 1.92(Sb0.97Ti0.91Mn0.07Fe0.04Al0.01)∑ = 2.00O6[(OH)0.84O0.16]∑ = 1.00 and shows two main similarities to the one presented in Table 7b, which are the presence of Ce and Ti in A and B-sites, respectively, as important substituents.
Table 8 shows the atomic coordinates and anisotropic thermal parameters of sample 1. Atoms at the same crystallographic position were restricted to the same anisotropic thermal displacements parameters. The positional parameter x of site 48f is 0.3237(2), which is similar to the ideal model for the pyrochlore supergroup (0.3125), as discussed in the introduction, which allows us to infer that the A-site has trigonal scalenohedral geometry and that the cations positioned at the B-site occupy the centers of regular octahedra [48].
Table 9 shows the atomic coordinates and anisotropic thermal displacement parameters for sample 2. The positional parameter x of the site 48f was 0.3241(4), also close to the ideal model for pyrochlore supergroup minerals (0.3125), keeping the trigonal scalenohedral geometry for the A-site and with cations positioned at B-site occupying the centers of regular octahedra [48].
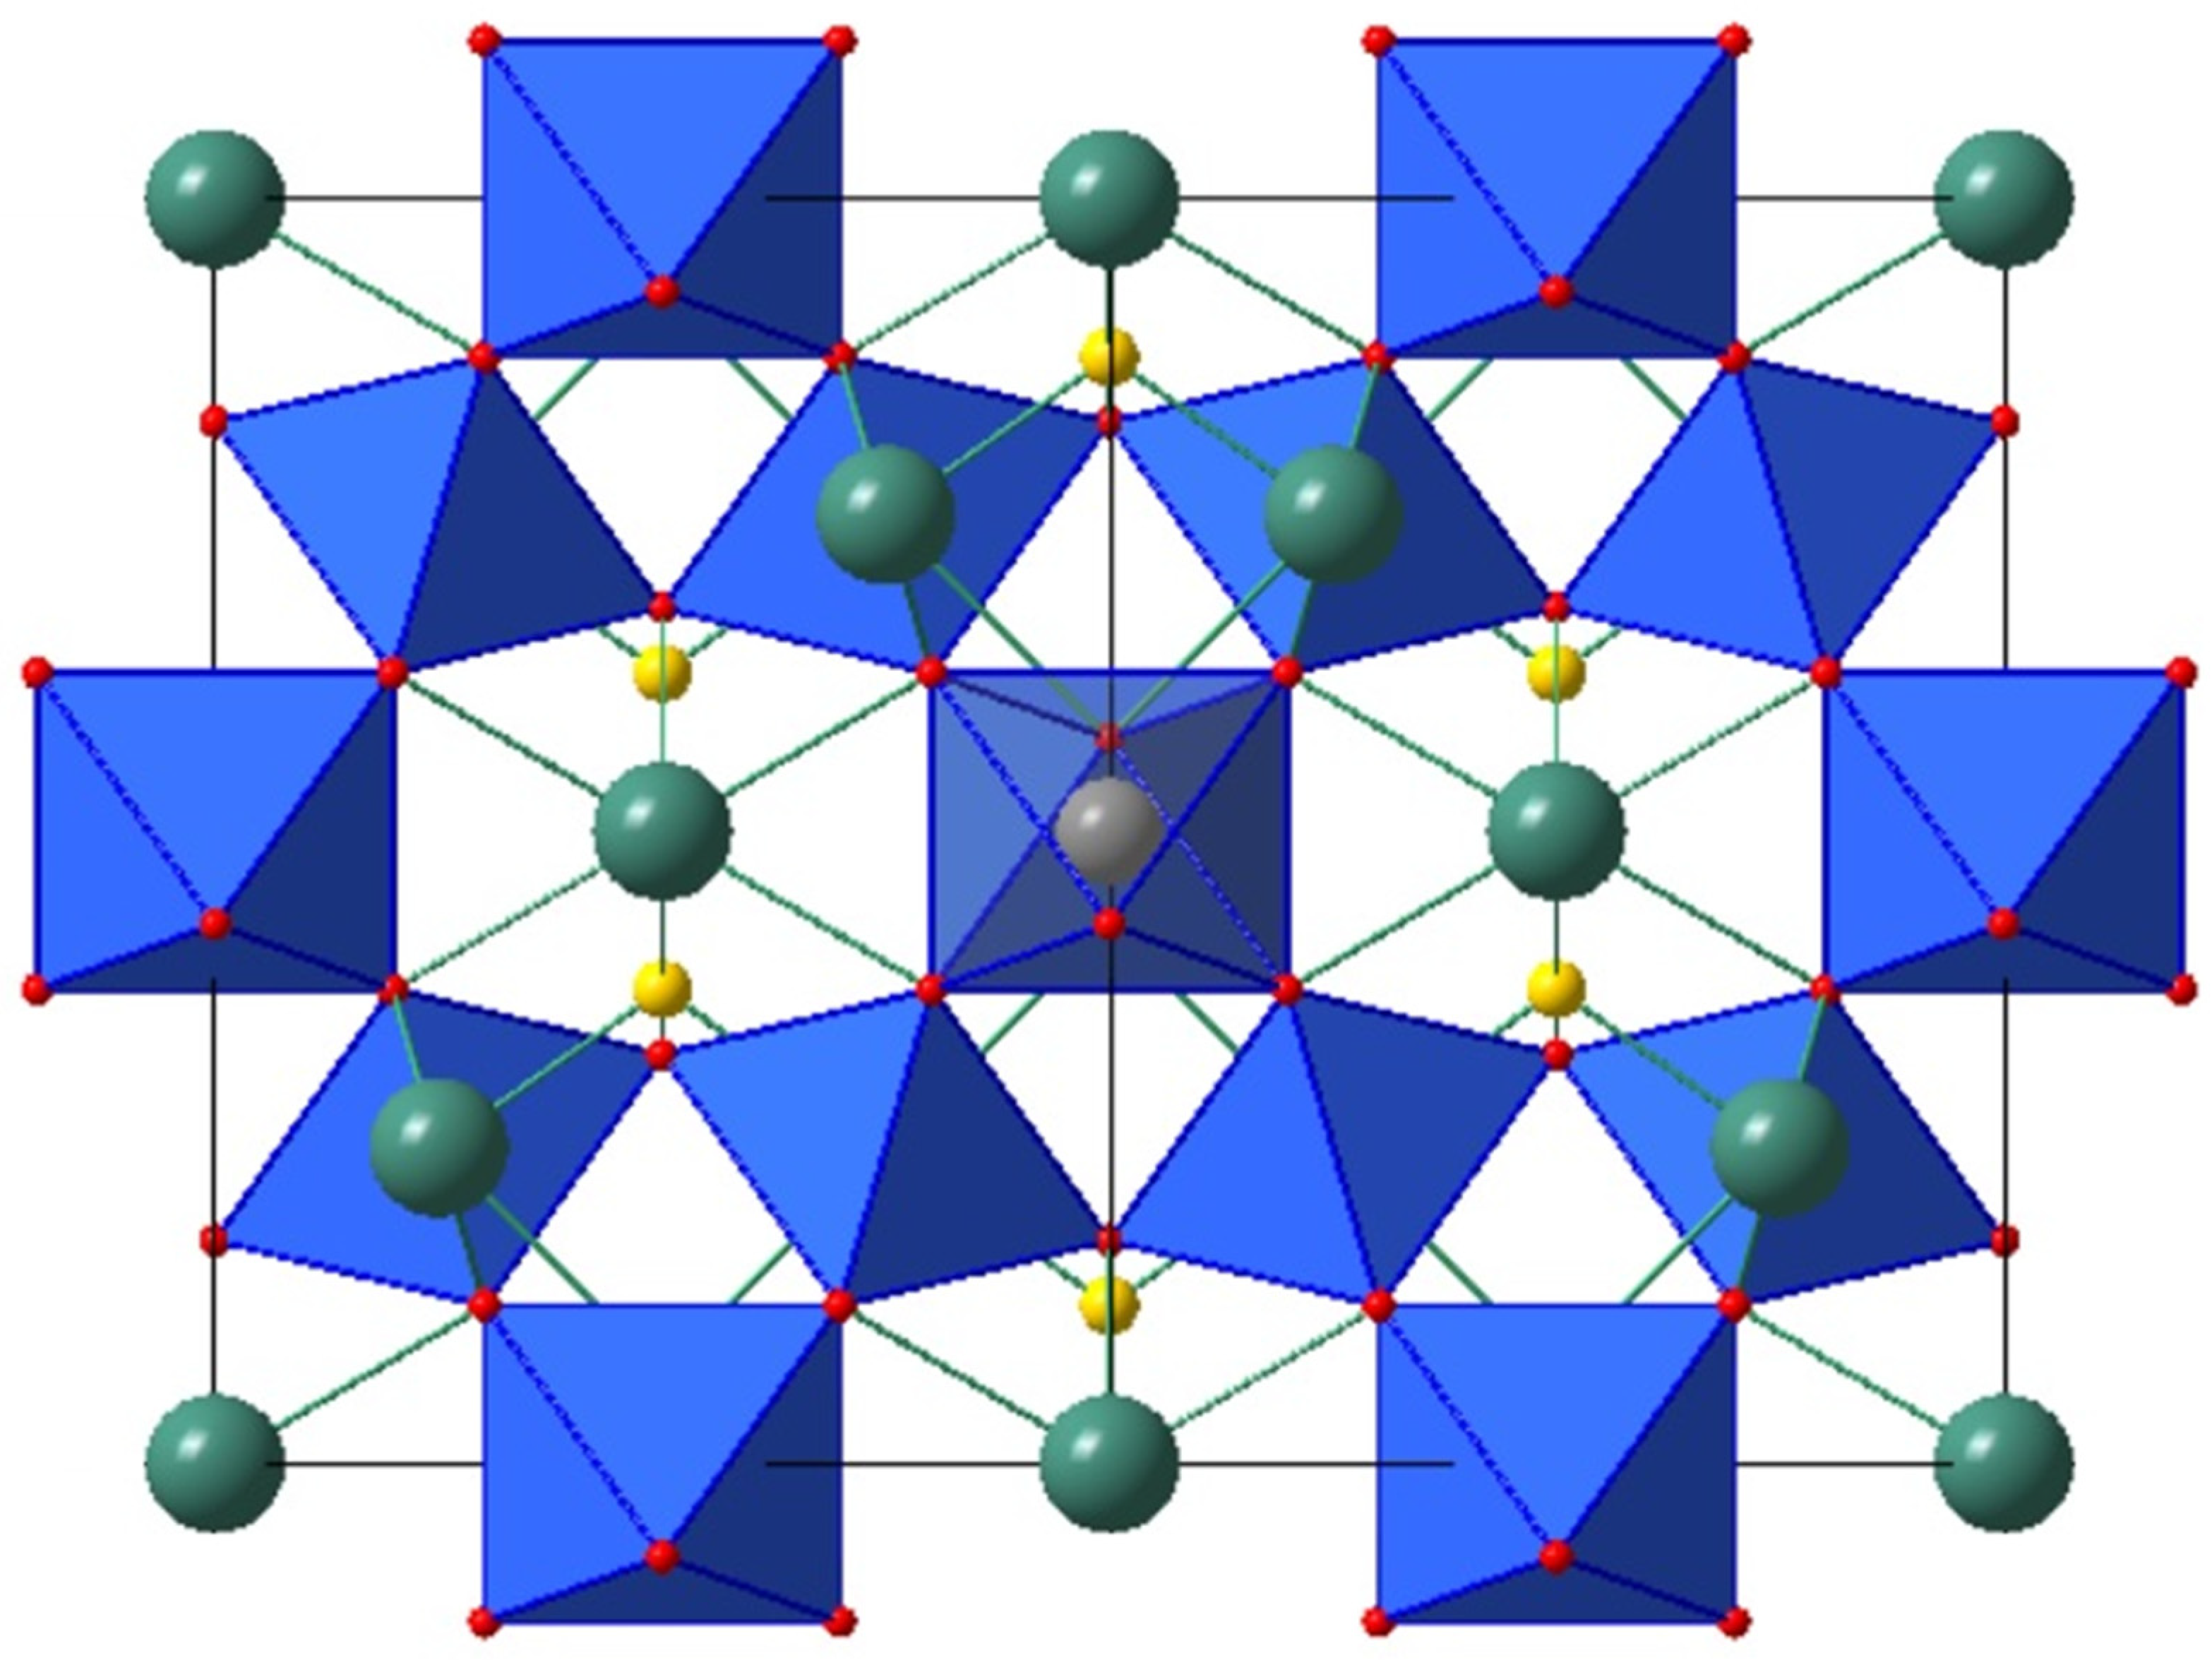
Despite the chemical composition difference between samples 1 and 2 already discussed, both are structurally similar. The crystal structure for samples’ 1 and 2 crystal is shown in Figure 7.
4.2.3. Bond-Valence Calculation. Sample 1
Bond-valence calculations were performed to validate the crystal structures’ results. Table 10 shows some selected distances and bond-valences. The bond-valence(s) calculations were firstly performed using all the parameters as published by Brown and Altermatt [49], but following what was pointed out by Atencio et al. [24], the parameters of Mills et al. [50] for Sb bound to oxygen were used, since they reported problems when calculating the valence for the B-site occupied by Sb atom in roméite-group minerals. The parameters for Pb2+ and F−, in turn, were chosen from [51]. With these corrections no problem was observed, and the calculated valence became similar to ones found by the electron microprobe analysis. For example, the valance calculated for the X-site was −1.89 and the value obtained from EMPA was −2.00, which confirmed the predominance of O2− in the X-site.
The small variations observed are due to possible substitutions of OH− in the X-site and of O2− in Y-site, which explains the lower value for the X-site and the higher value for the Y-site compared to those obtained by EMPA. However, for the Y-site, the bond-valence result is closest to −1 instead of −2, which confirmed the predominance of F− in the Y-site. The analysis of the described results allows purposing of another corrected chemical formula for the analysed mineral to agree with the bond-valence, and keeping coherence with the charge balance. Table 11 shows the formulas previously obtained, in the two first lines (a and b), together with the formula corrected after bond-valence, highlighted in line c.
4.2.4. Bond-Valence Calculation. Sample 2
Table 12 shows the results of the bond-valence calculations carried out using the refined model for the sample 2.
The values for the valences in the A and B-sites statistically agree with that calculated from microanalysis. The small variation observed in the valence of the X-site are probably due to possible substitutions of OH−. Regarding the Y-site, the values show some variation; however, they are typical, since it is difficult to discern the exact amounts of O2−, OH− or even H2O present in the sample. However, it is easy to infer, from the value obtained by the bond-valence, that the predominant species is OH−, which agrees with the experimental result. In this case, it was not necessary to perform any correction in the refined formula to adjust it to the bond-valence.
4.3. Raman Spectroscopy
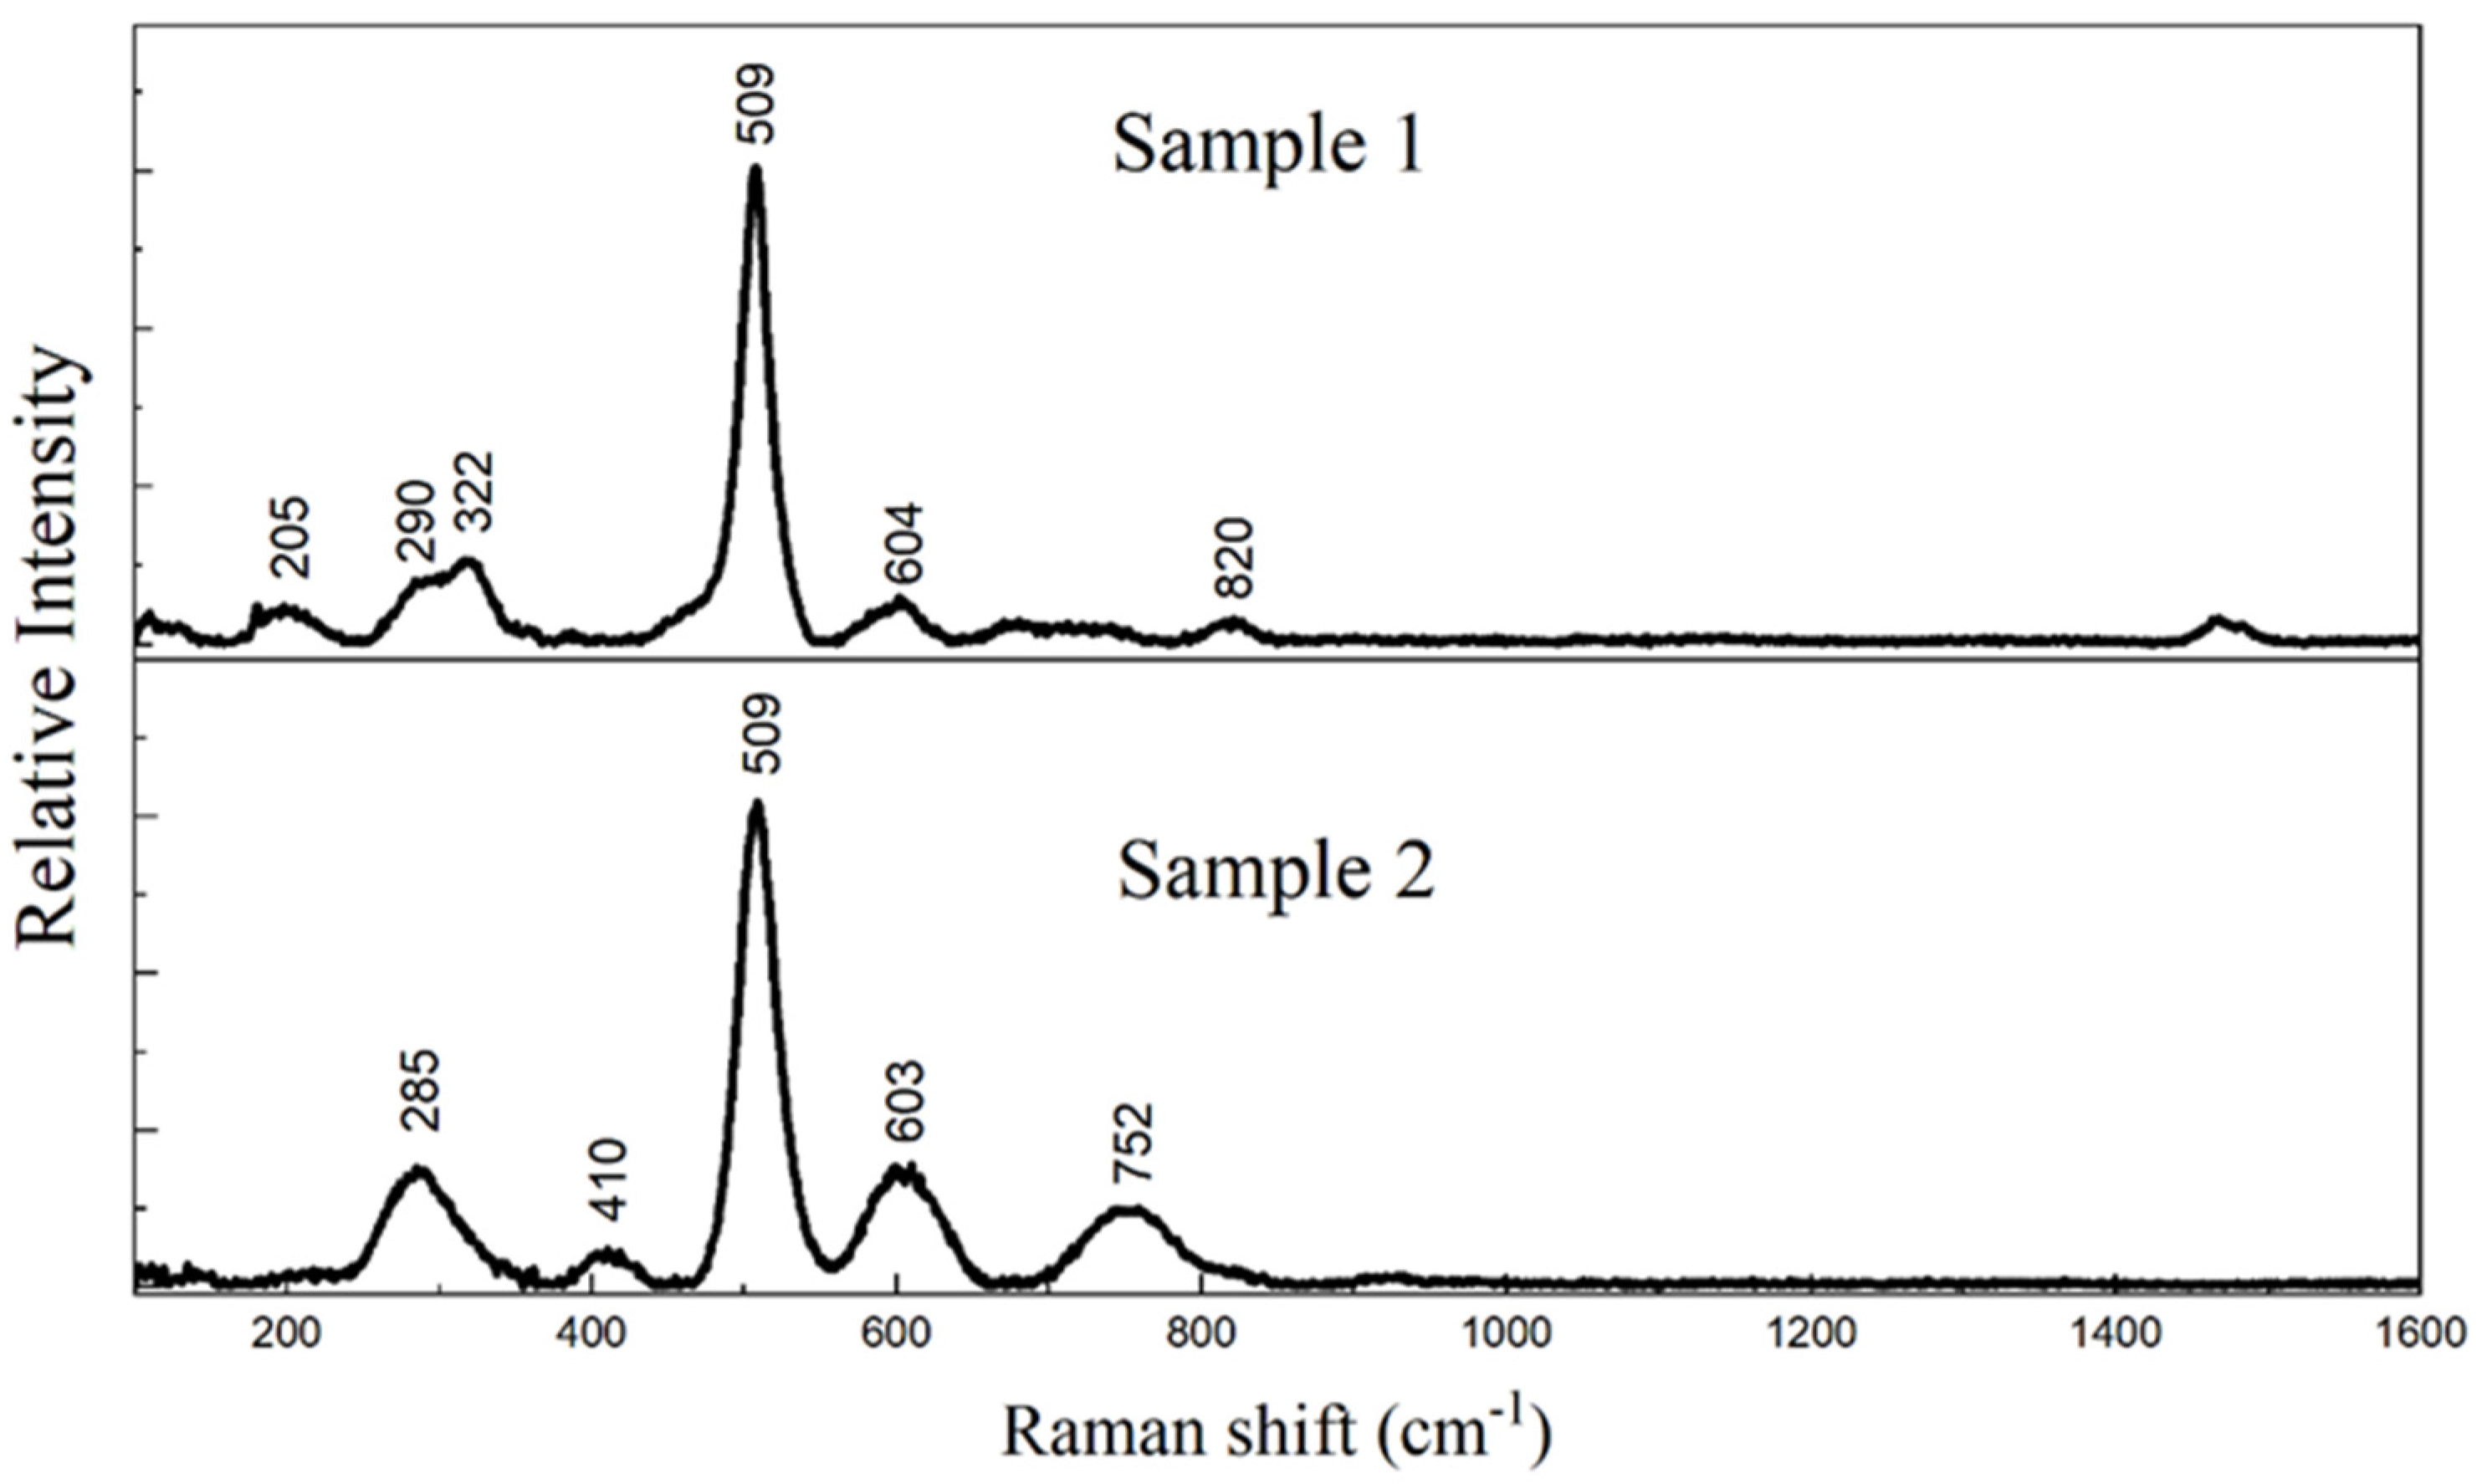
The spectra obtained for the two samples were compared in the RRUFF database, using the software Crystal Sleuth [52]. All spectra exhibited the characteristic bands of the bonds present in roméite-group minerals [24]. The most evident band in the spectra is that corresponding to the stretching of Sb-O bond, visible in the region of 400 to 600 cm−1, for the highest intense peak. In the spectra showed in Figure 8, this band is highlighted as 509 cm−1 for both samples 1 and 2. The figure shows the spectral range from 100 cm−1 to 1600 cm−1, which comprises the characteristic spectrum region of the samples and the bands corresponding to the bending of the O-Sb-O group are in the range from 200 to 400 cm−1 (205, 290 and 322 cm−1 for sample 1 and 285 and 410 cm−1 for sample 2) while the overtones are in the region above 700 cm−1, for instance 820 cm−1 for sample 1 and 752 cm−1 for sample 2 [24,53]. Low intensity Raman bands at 604 cm−1 for sample 1 and at 603 cm−1 for sample 2 are probably assignable to the O–Sb–O antisymmetric stretching vibrations, by comparison to those observed at 669 and 682 cm−1 for the mineral bahianite Al5Sb35+O14(OH)2 [54].
5. Conclusions and Perspectives
Two roméite-group samples were chemically characterized by Electron Microprobe Analysis (EPMA). The crystal structures were determined and refined by single-crystal X-ray diffraction (XRD) and Raman spectroscopy. The structures were then validated by Bond-valence calculations. Sample 1 was identified as fluorcalcioroméite, while sample 2 was identified as hydroxycalcioroméite and this study presented the first complete description of these mineral species at their occurrences.
This study has established the state-of-the-art of the research on roméite-group minerals and discussed the possibility of new species yet to be discovered. Currently, there are only five roméite-group mineral species approved by IMA, although these minerals have Sb in their composition, which has great commercial and industrial importance. Therefore, there is a great probability that new mineral species of this group will be discovered in the near future.
Author Contributions
Conceptualization, G.A.C.L.; investigation, G.A.C.L.; supervision, M.B.A.; writing—original draft, G.A.C.L.; writing—review & editing, D.A., J.E. and M.B.A. All authors have read and agreed to the published version of the manuscript.
Funding
This research was funded by São Paulo Research Support Foundation (FAPESP), grant number 2013/03487-8 and 2019/23498-0.
Acknowledgments
The authors acknowledge the Amapá State University (UEAP) and thank Robert T. Downs—Department of Geoscience and Ken Domanik—Michael J. Drake Electron Microprobe Laboratory from University of Arizona and Marco E. Ciriotti from University of Turin.
Conflicts of Interest
The authors declare no conflict of interest.
References
- Dana, J.; Hurlbut, J.R.C. Manual de Mineralogia; Livros Técnicos e Científicos Editora SA: Rio de Janeiro, Brazil, 1976; p. 642. [Google Scholar]
- Wöhler, F. Ueber den Pyrochlor, eine neue Mineralspecies. Ann. Phys. 1826, 83, 417–428. [Google Scholar] [CrossRef] [Green Version]
- Hogarth, D. Classification and nomenclature of the pyrochlore group. Am. Miner. 1977, 62, 403–410. [Google Scholar]
- Atencio, D.; Andrade, M.; Christy, A.; Gieré, R.; Kartashov, P.M. The pyrochlore supergroup of minerals: Nomenclature. Can. Miner. 2010, 48, 673–698. [Google Scholar] [CrossRef]
- Mills, S.J.; Hatert, F.; Nickel, E.H.; Ferraris, G. The standardisation of mineral group hierarchies: Application to recent nomenclature proposals. Eur. J. Miner. 2009, 21, 1073–1080. [Google Scholar] [CrossRef] [Green Version]
- Christy, A.; Atencio, D. Clarification of status of species in the pyrochlore supergroup. Miner. Mag. 2013, 77, 13–20. [Google Scholar] [CrossRef]
- Andrade, M.; Yang, H.; Atencio, D.; Downs, R.T.; Chukanov, N.V.; Lemée-Cailleau, M.H.; Persiano, A.I.C.; Goeta, A.E.; Ellena, J. Hydroxycalciomicrolite, Ca1.5Ta2O6(OH), a new member of the microlite group from Volta Grande pegmatite, Nazareno, Minas Gerais, Brazil. Miner. Mag. 2017, 81, 555–564. [Google Scholar] [CrossRef] [Green Version]
- Mills, S.J.; Christy, A.G.; Rumsey, M.S.; Spratt, J. The crystal chemistry of elsmoreite from the Hemerdon (Drakelands) mine, UK: Hydrokenoelsmoreite-3C and hydrokenoelsmoreite-6R. Miner. Mag. 2016, 80, 1195–1203. [Google Scholar] [CrossRef] [Green Version]
- Atencio, D. Parabariomicrolite discredited as identical to hydrokenomicrolite-3R. Miner. Mag. 2016, 80, 923–924. [Google Scholar] [CrossRef]
- Atencio, D.; Andrade, M.B.; Neto, A.C.B.; Pereira, V.P. Ralstonite Renamed Hydrokenoralstonite, Coulsellite Renamed Fluornatrocoulsellite, and Their Incorporation into the Pyrochlore Supergroup. Can. Miner. 2017, 55, 115–120. [Google Scholar] [CrossRef]
- Diniz-Pinto, H.S. Pyrochlore der Pegmatit-Provinz Nazareno/Brasilien: Modellvorstellungen zu Mineralisation-Alteration-Kristallchemie. Ph.D. Thesis, Universität Johannes Gutenberg, Mainz, Germany, 2000. [Google Scholar]
- Andrade, M.D. Crystallochemistry study of pyrochlore group minerals from Brazil. Ph.D. Thesis, Universidade de São Paulo, São Paulo, Brazil, 2007. [Google Scholar]
- Damour, A. Sur la roméine, nouvelle espèce minérale, de St. Marcel, Piemont. Ann. Mines 1841, 20, 247. [Google Scholar]
- Brugger, J.; Gieré, R. As, Sb, Be and Ce enrichment in minerals from a metamorphosed Fe-Mn deposit, Val Ferrera, eastern Swiss Alps. Can. Miner. 1999, 37, 37–52. [Google Scholar]
- Lee, J.D. Química Inorgânica não tão Concisa; Edgard Blücher: São Paulo, Brazil, 1999; p. 527. [Google Scholar]
- Zhou, H.; Wiebe, C.; Janik, J.; Vogt, B.; Harter, A.; Dalal, N.; Gardner, J. Spin glass transitions in the absence of chemical disorder for the pyrochlores A2Sb2O7 (A.=Mn, Co, Ni). J. Solid State Chem. 2010, 183, 890–894. [Google Scholar] [CrossRef]
- Hussak, E.; Prior, G.T. Lewisite and Zirkelite, Two New Brazilian Minerals. Miner. Mag. J. Miner. Soc. 1895, 11, 80–88. [Google Scholar] [CrossRef]
- Rouse, R.C.; Dunn, P.J.; Peacor, D.R.; Wang, L. Structural Studies of the Natural Antimonian Pyrochlores: I. Mixed Valency, Cation Site Splitting, and Symmetry Reduction in Lewisite. J. Solid State Chem. 1998, 141, 562–569. [Google Scholar] [CrossRef]
- Zubkova, N.; Pushcharovsky, D.; Atencio, D.; Arakcheeva, A.; Matioli, P. The crystal structure of lewisite, (Ca,Sb3+,Fe3+,Al,Na,Mn,□)2(Sb5+,Ti)2O6(OH). J. Alloy. Compd. 2000, 296, 75–79. [Google Scholar] [CrossRef]
- Christy, A.G.; Gatedal, K. Extremely Pb-rich rock-forming silicates including a beryllian scapolite and associated minerals in a skarn from Långban, Värmland, Sweden. Miner. Mag. 2005, 69, 995–1018. [Google Scholar] [CrossRef]
- Biagioni, C.; Orlandi, P.; Nestola, F.; Bianchin, S. Oxycalcioroméite, Ca2Sb2O6O, from Buca della Vena mine, Apuan Alps, Tuscany, Italy: A new member of the pyrochlore supergroup. Miner. Mag. 2013, 77, 3027–3037. [Google Scholar] [CrossRef]
- Brugger, J.; Gieré, R.; Graeser, S.; Meisser, N. The crystal chemistry of roméite. Contrib. Miner. Petrol. 1997, 127, 136–146. [Google Scholar] [CrossRef]
- Uher, P.; Cerny, P.; Chapman, R.; Hatar, J.; Miko, O. Evolution of Nb, Ta-oxide minerals in the Prasiva granitic pegmatites, Slovakia; II, External hydrothermal Pb, Sb overprint. Can. Miner. 1998, 36, 535–545. [Google Scholar]
- Atencio, D.; Ciriotti, M.; Andrade, M.B. Fluorcalcioromeite, (Ca,Na)2Sb25+(O,OH)6F, a new roméite-group mineral from Starlera mine, Ferrera, Grischun, Switzerland: Description and crystal structure. Miner. Mag. 2013, 77, 467–473. [Google Scholar] [CrossRef]
- Halenius, U.; Bosi, F. Oxyplumboroméite, Pb2Sb2O7, a new mineral species of the pyrochlore supergroup from Harstigen mine, Värmland, Sweden. Miner. Mag. 2013, 77, 2931–2939. [Google Scholar] [CrossRef]
- Mills, S.J.; Christy, A.G.; Rumsey, M.S.; Spratt, J.; Bittarello, E.; Favreau, G.; Ciriotti, M.E.; Berbain, C. Hydroxyferroroméite, a new secondary weathering mineral from Oms, France. Eur. J. Miner. 2017, 29, 307–314. [Google Scholar] [CrossRef]
- Mills, S.J.; Christy, A.G.; Rumsey, M.S.; Spratt, J. Discreditation of partzite. Eur. J. Miner. 2016, 28, 1019–1024. [Google Scholar] [CrossRef]
- Dana, J.D. A System of Mineralogy; John Wiley and Sons Pubishers: New York, NY, USA, 1869; p. 793. [Google Scholar]
- Igelström, L. Nya och sällsynta mineralier från Vermland. Öfversigt Kongl. Vetensk. Akad. Förhandlingar 1865, 22, 227–229. [Google Scholar]
- Mason, B.; Vitaliano, C.J. The mineralogy of the antimony oxides and antimonates. Miner. Mag. J. Miner. Soc. 1953, 30, 100–112. [Google Scholar] [CrossRef]
- Matsubara, S.; Kato, A.; Shimizu, M.; Sekiuchi, K.; Suzuki, Y. Romeite from the Gozaisho mine, Iwaki, Japan. Miner. J. 1996, 18, 155–160. [Google Scholar] [CrossRef] [Green Version]
- Arents, A. Partzite: A new mineral. Am. J. Sci. Arts. 1867, 43, 1820–1879. [Google Scholar]
- Riotte, E. Stetefeldtit, ein neues Mineral. Berg Und HuettenmÆnnische Ztg. 1867, 26, 253–254. [Google Scholar]
- Walenta, K. Bismutostibiconit: Ein neues Mineral der Stibiconitgruppe aus dem Schwarzwald. Chemie der Erde 1983, 42, 77–81. [Google Scholar]
- Geological Survey of Canada. Generalized Geological Map of the World and Linked Databases, Open File 2915d. Available online: https://mrdata.usgs.gov/metadata/geology-world-gsc.faq.html (accessed on 23 January 2018).
- Piccoli, G.C.; Maletto, G.; Bosio, P.; Lombardo, B. Minerali del Piemonte e Della Valle d’Aosta; Associazione Amici del Museo “F. Eusebio”: Alba, Italy, 2007; p. 607. [Google Scholar]
- Ermolaeva, V.N.; Chukanov, N.V.; Varlamov, D.A.; Van, K.V.; Jancev, S. Epitaxic and syntactic intergrowth of structural related spinels, minerals of högbomite supergroup, nežilovite and rinmanite from pelagonian massif, Makedonia. In Magmatism of the Earth and Related Strategic Metal Deposits, Proceedings of XXXVI International Conference, Saint Peterburg, Russia, 23–26 May 2019; Ermolaeva, V.N., Zaitsev, V.A., Sorokhtina, N.V., Eds.; Saint Petersburg State University: Saint Peterburg, Russia, 2019; pp. 77–79. [Google Scholar]
- Sheldrick, G.M. SADABS; University of Göttingen: Göttingen, Germany, 1996. [Google Scholar]
- Bruker AXS Inc. APEX2 Software; Bruker: Madison, WI, USA, 2005. [Google Scholar]
- Sheldrick, G.M. Crystal structure refinement with SHELXL. Acta Crystallogr. C Sect. Chem. 2015, C71, 3–8. [Google Scholar]
- Farrugia, L. WinGX and ORTEP for Windows: An update. J. Appl. Crystallogr. 2012, 45, 849–854. [Google Scholar] [CrossRef]
- Palache, C.; Berman, H.; Frondel, C. The System of Mineralogy of James Dwight Dana and Edward Salisbury Dana; Wiley: New Haven, CT, USA, 1951; Volume 1021, pp. 1837–1892. [Google Scholar]
- Ermolaeva, V.N.; Chukanov, N.V.; Jancev, S.; Van, K.V. Parageneses of Oxygen-Bearing Minerals with Chalcophile Elements in Metasomatites of the Pelagonian Massif, Macedonia. In Magmatism of the Earth and Related Strategic Metal Deposits, Proceedings of XXXIV International Conference, Miass, Russia, 4–9 August 2017; Zaitsev, V.A., Ermolaeva., V.N., Eds.; South Ural State University: Tcheliabinské, Russia, 2017; pp. 62–66. [Google Scholar]
- Varlamov, D.A.; Ermolaeva, V.N.; Jancev, S.; Chukanov, N.V. Minerals of the pyrochlore supergroup from metasomatic associations of minerals of chalcophile elements in the pelagonian massif, Macedonia. In Magmatism of the Earth and Related Strategic Metal Deposits, Proceedings of XXXIV International Conference, Miass, Russia, 4–9 August 2017; Zaitsev, V.A., Ermolaeva., V.N., Eds.; South Ural State University: Tcheliabinské, Russia, 2017; pp. 289–292. [Google Scholar]
- Aia, M.A.; Mooney, R.W.; Hoffman, C.W.W. An X-ray Study of Pyrochlore Fluoantimonates of Calcium, Cadmium, and Manganese. J. Electrochem. Soc. 1963, 110, 1048. [Google Scholar] [CrossRef]
- Bosi, F.; Christy, A.G.; Hålenius, U. Crystal-chemical aspects of the roméite group, A2Sb2O6Y, of the pyrochlore supergroup. Miner. Mag. 2017, 81, 1287–1302. [Google Scholar] [CrossRef]
- Brugger, J.; Krivovichev, S.V.; Kolitsch, U.; Meisser, N.; Andrut, M.; Ansermet, S.; Burns, P.C. Description and crystal structure of manganlotharmeyerite, Ca(Mn3+,□,Mg)2{AsO4,[AsO2(OH)2]}2(OH,H2O)2, from the Starlera Mn deposit, Swiss alps and a redefinition of lotharmeyerite. Can. Miner. 2002, 40, 1597–1608. [Google Scholar] [CrossRef]
- Subramanian, M.A.; Aravamudan, G.; Subba Rao, G.V. Oxide pyrochlores: A review. Prog. Solid State Chem. 1983, 15, 55–143. [Google Scholar] [CrossRef]
- Brown, I.D.; Altermatt, D. Bond-valence parameters obtained from a systematic analysis of the Inorganic Crystal Structure Database. Acta Crystallogr. Sect. B Struct. Sci. 1985, 41, 244–247. [Google Scholar] [CrossRef] [Green Version]
- Mills, S.J.; Christy, A.G.; Chen, E.C.-C.; Raudsepp, M. Revised values of the bond valence parameters for [6]Sb(V)-O and [3–11]Sb(III)-O. Zeitschrift für Kristallographie 2009, 224, 423–431. [Google Scholar] [CrossRef]
- Brese, N.E.; O’Keeffe, M. Bond-valence parameters for solids. Acta Crystallogr. Sect. B Struct. Sci. 1991, 47, 192–197. [Google Scholar] [CrossRef]
- Laetsch, T.; Downs, R. Software for identification and refinement of cell parameters from powder diffraction data of minerals using the RRUFF Project and American Mineralogist Crystal Structure Databases. In Proceedings of the General Meeting of the International Mineralogical Association, Kobe, Japan, 23–28 July 2006. [Google Scholar]
- Bahfenne, S.; Frost, R.L. Raman spectroscopic study of the antimonate mineral lewisite (Ca, Fe, Na)2(Sb, Ti)2O6(O, OH)7. Radiat. Eff. Defects Solids Inc. Plasm. Sci. Plasm. Technol. 2010, 165, 46–53. [Google Scholar] [CrossRef] [Green Version]
- Frost, R.L.; Bahfenne, S. Raman spectroscopic study of the antimonate mineral bahianite Al5Sb35+O14(OH)2. J. Raman Spectrosc. 2009, 41, 207–211. [Google Scholar] [CrossRef] [Green Version]
Figure 1.
Distortion of A and B-sites in function of the positional parameter x. Adapted from [11]. (a) x = 0.3750, A (gray) is located at the center of a regular cube and B (blue) at the center of a trigonal antiprism. (b) x = 0.3125, A-site (gray) form a trigonal scalenohedron and B-site (blue) becomes a regular octahedron.

Figure 2.
Oxycalcioroméite from Bucca della Vena mine, Apuan Alps, Tuscany, Italy [20].
Figure 2.
Oxycalcioroméite from Bucca della Vena mine, Apuan Alps, Tuscany, Italy [20].

Figure 3.
Fluorcalcioroméite from Starlera mine, Ferrera, Grischun, Switzerland [24].
Figure 3.
Fluorcalcioroméite from Starlera mine, Ferrera, Grischun, Switzerland [24].

Figure 4.
Oxyplumboroméite from Harstigen mine, Värmland, Sweden [25].
Figure 4.
Oxyplumboroméite from Harstigen mine, Värmland, Sweden [25].

Figure 5.
Hydroxyferroroméite from Oms, France [26].
Figure 5.
Hydroxyferroroméite from Oms, France [26].

Figure 6.
On the left: (sample 1) yellowish-orange distorted octahedra of fluorcalcioroméite from Prabornaz mine, Aosta valley, Italy associated with dolomite and anatase. On the right: (sample 2) dark yellowish-orange distorted octahedra of hydroxycalcioroméite from Kalugeri Hill, Nezilovo, Macedonia associated with dolomite.

Figure 7.
Fluorcalcioroméite and hydroxycalcioroméite crystal structure, as seen along the a axis. For sample 1 the atoms are represented by colors: green = Ca, Na and Pb; yellow = F; red = O; blue polyhedral = octahedral sites Sb-O; gray = Sb, Ti. For sample 2 the atoms are represented by colors: green = Ca and Ce; yellow = O; red = O; blue polyhedral = octahedral sites Sb-O; gray = Sb, Ti. One central polyhedral was kept transparent.

Figure 8.
Raman spectra of the samples 1 and 2, obtained with laser of 532 nm and grid of 1800 gr/mm. The spectra are shown for the 100 to 1600 cm−1 range, with the highlighted line in 509 cm−1 corresponding to the Sb–O stretching for both samples 1 and 2.
Figure 8.
Raman spectra of the samples 1 and 2, obtained with laser of 532 nm and grid of 1800 gr/mm. The spectra are shown for the 100 to 1600 cm−1 range, with the highlighted line in 509 cm−1 corresponding to the Sb–O stretching for both samples 1 and 2.


Table 1.
Roméite-group species, with the dominant elements in the sites A and Y with the current IMA status. A = approved, N = not approved, D = discredited, P = probable.
Table 1.
Roméite-group species, with the dominant elements in the sites A and Y with the current IMA status. A = approved, N = not approved, D = discredited, P = probable.
| Mineral Name | A-Site Dominant | Y-Site Dominant | More Recent Reference | Current Status (2021) |
|---|---|---|---|---|
| hydroxycalcioroméite | Ca2+ | OH− | [6] | A |
| oxycalcioroméite | Ca2+ | O2− | [21] | A |
| fluorcalcioroméite | Ca2+ | F− | [24] | A |
| oxyplumboroméite | Pb2+ | O2− | [25] | A |
| hydroxyferroroméite | Fe2+ | OH− | [26] | A |
| fluornatroroméite | Na+ | F− | [6] | N |
| cuproroméite | Cu2+ | - | [27] | D |
| argentoroméite | Ag+ | - | [6] | P |
| estibioroméite | Sb3+ | - | [6] | P |
| bismutoroméite | Bi3+ | - | [6] | P |
Table 2.
Chemical data by EPMA for samples 1 and 2.
| Sample 1 | Sample 2 | ||||||
|---|---|---|---|---|---|---|---|
| Constituent | wt.% | Range (13 points) | Standard Deviation | Constituent | wt.% | Range (10 points) | Standard Deviation |
| FeO | 0.50 | 0.41–1.10 | 0.14 | FeO | 0.32 | 0.31–0.35 | 0.01 |
| Na2O | 4.11 | 3.66–4.44 | 0.23 | Na2O | 1.06 | 0.97–1.11 | 0.04 |
| CaO | 15.41 | 14.94–16.05 | 0.26 | CaO | 15.55 | 15.4–15.9 | 0.14 |
| Ce2O3 | 0.00 | 0.00–0.02 | 0.01 | Ce2O3 | 13.94 | 13.37–14.67 | 0.43 |
| TiO2 | 0.01 | 0.00–0.03 | 0.01 | TiO2 | 13.96 | 13.44–14.34 | 0.29 |
| Sb2O5 | 76.17 | 66.13–69.55 | 0.83 | Sb2O5 | 46.70 | 41.23–43.08 | 0.57 |
| MnO | 0.54 | 0.43–0.67 | 0.08 | MnO | 1.61 | 1.52–1.68 | 0.04 |
| UO2 | 0.01 | 0.00–0.03 | 0.01 | UO2 | 0.79 | 0.61–0.86 | 0.07 |
| Al2O3 | 0.10 | 0.03–0.26 | 0.05 | ThO2 | 0.42 | 0.35–0.48 | 0.04 |
| SiO2 | 0.04 | 0.02–0.12 | 0.03 | Nb2O5 | 0.65 | 0.56–0.72 | 0.05 |
| PbO | 0.02 | 0.00–0.10 | 0.03 | ||||
| CuO | 0.01 | 0.00–0.03 | 0.01 | ||||
| ZnO | 0.01 | 0.00–0.03 | 0.01 | ||||
| Y2O3 | 0.07 | 0.01–0.15 | 0.05 | ||||
| WO3 | 0.78 | 0.61–1.80 | 0.32 | ||||
| F | 2.79 | 2.40–3.07 | 0.23 | F | 0.83 | 0.63–1.00 | 0.12 |
| H2O calc. | 0.70 | H2O calc. | 1.40 | ||||
| O=F | −1.17 | O=F | −0.35 | ||||
| Total | 100.09 | Total | 96.88 | ||||
Table 3.
Chemical formulas calculated for samples 1 and 2.
| Sample 1 | (Ca1.16Na0.55□0.23Mn0.03Fe0.03)∑ = 2.00(Sb1.98W0.01Al0.01)∑ = 2.00O∑ = 6.00(F0.62OH0.33O0.05)∑ = 1.00 |
| Sample 2 | (Ca1.18Ce0.36□0.17Na0.15Mn0.10Fe0.02Th0.01U0.01)∑ = 2.00(Sb1.23Ti0.75Nb0.02)∑ = 2.00O6.00(OH0.66F0.19O0.15)∑ = 1.00 |
Table 4.
X-ray diffraction analysis data and corrected structural refinement for fluorcalcioroméite.
Table 4.
X-ray diffraction analysis data and corrected structural refinement for fluorcalcioroméite.
| X-Ray Diffraction Analysis Data | Sample 1 (This Study) | Atencio et al. [24] |
|---|---|---|
| Temperature (K) | 296(2) | 293(2) |
| Crystal colour | Yellowish-orange | Orange |
| Crystal dimensions (mm) | ||
| Crystal system | Cubic | Cubic |
| Space group | (#227, origin at 16c, ) | (#227, origin at 16c, ) |
| Unit cell dimension () | 10.2881(13) Å | 10.2987(8) Å |
| Unit cell volume (V) | 1088.9(4) Å3 | 1092.31(15) Å3 |
| Number of formulas by unit cell (Z) | 8 | 8 |
| Calculated density (ρ) | 5.026 g/cm3 | 5.135 g/cm3 |
| Absorption coefficient (μ) | 11.74(5) mm−1 | 11.20 mm−1 |
| F(000) | 1493 | 1526 |
| Collected/unique reflections | 976/193 | 774/123 |
| Parameters | 15 | 14 |
| Symmetry indices (Rint) | 0.017 | 0.015 |
| Goodness-of-fit over F2 (GOF) | 1.176 | 1.186 |
| Final residual indices [] | R1 = 0.016, wR2 = 0.042 | R1 = 0.0106, wR2 = 0.0318 |
| Highest residual peaks | 0.86 e.Å−3 to 0.50 Å of Ti (16c) | 0.57 e.Å−3 to 0.34 Å of O (48f) |
| Deepest residual hole | −0.69 e.Å−3 to 0.34 Å of F (8b) | −0.38 e.Å−3 to 1.93 Å of O (48f) |
Table 5.
X-ray diffraction analysis data and corrected structural refinement for hydroxycalcioroméite.
Table 5.
X-ray diffraction analysis data and corrected structural refinement for hydroxycalcioroméite.
| X-Ray Diffraction Analysis Data | Sample 2 (This Study) | Rouse et al. [18] | Zubkova et. al. [19] |
|---|---|---|---|
| Temperature (K) | 296(2) | 297 | |
| Crystal colour | Yellowish-orange | Orange-brown | |
| Crystal dimensions (mm) | |||
| Crystal system | Cubic | Cubic | Cubic |
| Space group | (#227, origin at 16c, ) | (#227, origin at 16c, ) | (#227, origin at 16c, ) |
| Unit cell dimension () | 10.2970(13) Å | 10.277(1) Å | 10.311(7) Å |
| Unit cell volume (V) | 1091.8(4) Å3 | 1085.4(3) Å3 | 1096(2) Å3 |
| Number of formulas by unit cell (Z) | 8 | 8 | 8 |
| Calculated density (ρ) | 5.002 g/cm3 | 4.966 g/cm3 | - |
| Absorption coefficient (μ) | 12.03(4) mm−1 | 10.9 mm−1 | 10.61 mm−1 |
| F(000) | 1495 | 1480.3 | - |
| Collected/unique reflections | 653/121 | 1241/218 | 922/218 |
| Parameters | 13 | 20 | 33 |
| Symmetry indices (Rint) | 0.014 | 0.034 | 0.046 |
| Goodness-of-fit over F2 (GOF) | 1.095 | 1.066 | - |
| Final residual indices [] | R1 = 0.023, wR2 = 0.049 | R1 = 0.017, wR2 = 0.026 | R1 = 0.015, wR2 = 0.029 |
| Highest residual peaks | 0.70 e.Å−3 to 0.490 Å of Ti (16c) | 0.64 e.Å−3 | 0.71 e.Å−3 |
| Deepest residual hole | −0.52 e.Å−3 to 0.34 Å of F (8b) | −1.20 e.Å−3 | −0.54 e.Å−3 |
Table 6.
Chemical formulas calculated for the sample 1, fluorcalcioroméite: (a) by microanalysis, (b) by refinement.
Table 6.
Chemical formulas calculated for the sample 1, fluorcalcioroméite: (a) by microanalysis, (b) by refinement.
| (a) | (Ca1.28Na0.56□0.14Ce0.01Pb0.01)∑ = 2.00(Sb1.70Ti0.30)∑ = 2.00(O5.87OH0.13)∑ = 6.00(F0.77OH0.23)∑ = 1.00 |
| (b) | (Ca1.29Na0.55□0.11Pb0.05)∑ = 2.00(Sb1.71Ti0.29)∑ = 2.00(O5.94OH0.06)∑ = 6.00(F0.77OH0.23)∑ = 1.00 |
Table 7.
Chemical formulas calculated for sample 2, hydroxycalcioroméite. (a) by microanalysis, (b) by refinement.
Table 7.
Chemical formulas calculated for sample 2, hydroxycalcioroméite. (a) by microanalysis, (b) by refinement.
| (a) | (Ca1.17Ce0.36□0.21Na0.14Mn0.10Th0.01U0.01)∑ = 2.00(Sb1.22Ti0.74Fe0.02Nb0.02) ∑ = 2.00O6.00(OH0.75F0.19O0.06)∑ = 1.00 |
| (b) | (Ca1.30Ce0.51□0.19)∑ = 2.00(Sb1.08Ti0.92)∑ = 2.00O6.00(OH0.61O0.21F0.18)∑ = 1.00 |
Table 8.
Atomic coordinates and displacement parameters, sample 1, fluorcalcioroméite.
| x/a | y/b | z/c | Ueq | U11 | U22 | U33 | U12 | U13 | U23 | |
|---|---|---|---|---|---|---|---|---|---|---|
| Ca1 | 0.0155 (4) | 0.0155 (4) | 0.0155 (4) | 0.0155 (4) | −0.0018 (3) | −0.0018 (3) | −0.0018 (3) | |||
| Na1 | 0.0155 (4) | 0.0155 (4) | 0.0155 (4) | 0.0155 (4) | −0.0018 (3) | −0.0018 (3) | −0.0018 (3) | |||
| Pb1 | 0.0155 (4) | 0.0155 (4) | 0.0155 (4) | 0.0155 (4) | −0.0018 (3) | −0.0018 (3) | −0.0018 (3) | |||
| Sb1 | 0.00506 (10) | 0.00506 (10) | 0.00506 (10) | 0.00506 (10) | −0.00021 (7) | −0.00021 (7) | −0.00021 (7) | |||
| Ti1 | 0.00506 (10) | 0.00506 (10) | 0.00506 (10) | 0.00506 (10) | −0.00021 (7) | −0.00021 (7) | −0.00021 (7) | |||
| O1 | 0.3237 (2) | 0.0101 (4) | 0.0099 (6) | 0.0106 (9) | 0.0099 (6) | 0 | 0.0049 (8) | 0 | ||
| F1 | 0.0163 (9) | 0.0163 (9) | 0.0163 (9) | 0.0163 (9) | 0 | 0 | 0 |
Table 9.
Atomic coordinates and displacement parameters, sample 2, hydroxycalcioroméite.
| x/a | y/b | z/c | Ueq | U11 | U22 | U33 | U12 | U13 | U23 | |
|---|---|---|---|---|---|---|---|---|---|---|
| Ca1 | 0.0154 (4) | 0.0154 (4) | 0.0154 (4) | 0.0154 (4) | −0.0030 (2) | −0.0030 (2) | −0.0030 (2) | |||
| Ce1 | 0.0154 (4) | 0.0154 (4) | 0.0154 (4) | 0.0154 (4) | −0.0030 (2) | −0.0030 (2) | −0.0030 (2) | |||
| Sb1 | 0.0068 (2) | 0.0068 (2) | 0.0068 (2) | 0.0068 (2) | −0.00026 (14) | −0.00026 (14) | −0.00026 (14) | |||
| Ti1 | 0.0068 (2) | 0.0068 (2) | 0.0068 (2) | 0.0068 (2) | −0.00026 (14) | −0.00026 (14) | −0.00026 (14) | |||
| O1 | 0.3241 (4) | 0.0159 (11) | 0.0152 (13) | 0.017 (2) | 0.0152 (13) | 0 | 0.0063 (15) | 0 | ||
| O2 | 0.028 (3) | 0.028 (3) | 0.028 (3) | 0.028 (3) | 0 | 0 | 0 |
Table 10.
Selected bond lengths and bond valences(s), sample 1.
| Bond | Bond Length | s (v.u.) | Σ | Valence in EPMA 1 |
|---|---|---|---|---|
| A(16d)–X(48f) | 2.5686(16) | 0.1684 (×6) | ||
| A(16d)–Y(8b) | 2.2274(3) | 0.2930 (×2) | ||
| Σ | 1.59 | 1.50 | ||
| B(16c)–X(48f) | 1.9704(9) | 0.8258 (×6) | ||
| Σ | 4.95 | 5.00 | ||
| X(48f)–A(16d) | 2.5686(16) | 0.1684 (×2) | ||
| X(48f)–B(16c) | 1.9704(9) | 0.7780 (×2) | ||
| Σ | −1.89 | −2.00 | ||
| Y(8b)–A(16d) | 2.2274(3) | 0.3036 (×4) | ||
| Σ | −1.21 | −1.05 |
1: Electron Probe Micro-Analysis.
Table 11.
Chemical formulas calculated for sample 1, fluorcalcioroméite. (a) by microanalysis, (b) by refinement, (c) corrected after bond valence.
Table 11.
Chemical formulas calculated for sample 1, fluorcalcioroméite. (a) by microanalysis, (b) by refinement, (c) corrected after bond valence.
| (a) | (Ca1.28Na0.56□0.14Ce0.01Pb0.01)∑ = 2.00(Sb1.70Ti0.30)∑=2.00(O5.87OH0.13)∑ = 6.00(F0.77OH0.23)∑ = 1.00 |
| (b) | (Ca1.29Na0.55□0.11Pb0.05)∑ = 2.00(Sb1.71Ti0.29)∑=2.00(O5.94OH0.06)∑ = 6.00(F0.77OH0.23)∑ = 1.00 |
| (c) | (Ca1.29Na0.55□0.11Pb0.05)∑ = 2.00(Sb1.71Ti0.29)∑=2.00(O5.73OH0.27)∑ = 6.00(F0.77O0.21OH0.02)∑ = 1.00 |
Table 12.
Selected bond lengths and bond valences (s), sample 2.
| Bond | Bond Length | s (v.u.) | Σ | Valence in EMPA |
|---|---|---|---|---|
| A(16d)–X(48f) | 2.568 (3) | 0.2105 (×6) | ||
| A(16d)–Y(8b) | 2.2294(3) | 0.3674 (×2) | ||
| Σ | 2.00 | 2.00 | ||
| B(16c)–X(48f) | 1.9737(16) | 0.7523 (×6) | ||
| Σ | 4.51 | 4.63 | ||
| X(48f)–A(16d) | 2.568 (3) | 0.2061 (×2) | ||
| X(48f)–B(16c) | 1.9737(16) | 0.6721 (×2) | ||
| Σ | −1.76 | −2.00 | ||
| Y(8b)–A(16d) | 2.2294(3) | 0.2363(×4) | ||
| Σ | −0.95 | −1.15 |
Publisher’s Note: MDPI stays neutral with regard to jurisdictional claims in published maps and institutional affiliations. |
© 2021 by the authors. Licensee MDPI, Basel, Switzerland. This article is an open access article distributed under the terms and conditions of the Creative Commons Attribution (CC BY) license (https://creativecommons.org/licenses/by/4.0/).
Share and Cite
MDPI and ACS Style
Lopes, G.A.C.; Atencio, D.; Ellena, J.; Andrade, M.B. Roméite-Group Minerals Review: New Crystal Chemical and Raman Data of Fluorcalcioroméite and Hydroxycalcioroméite. Minerals 2021, 11, 1409. https://doi.org/10.3390/min11121409
AMA Style
Lopes GAC, Atencio D, Ellena J, Andrade MB. Roméite-Group Minerals Review: New Crystal Chemical and Raman Data of Fluorcalcioroméite and Hydroxycalcioroméite. Minerals. 2021; 11(12):1409. https://doi.org/10.3390/min11121409
Chicago/Turabian StyleLopes, Gerson A. C., Daniel Atencio, Javier Ellena, and Marcelo B. Andrade. 2021. "Roméite-Group Minerals Review: New Crystal Chemical and Raman Data of Fluorcalcioroméite and Hydroxycalcioroméite" Minerals 11, no. 12: 1409. https://doi.org/10.3390/min11121409
Note that from the first issue of 2016, this journal uses article numbers instead of page numbers. See further details here.