
Mechanical Properties and Influence Factors of Ordinary Shear Links


1
School of Infrastructure Engineering, Nanchang University, Nanchang 330031, China
2
Zhongmei Engineering Group Co., Ltd., Nanchang 330001, China
*
Author to whom correspondence should be addressed.
Buildings 2024, 14(1), 160; https://doi.org/10.3390/buildings14010160
Submission received: 13 December 2023
/
Revised: 7 January 2024
/
Accepted: 8 January 2024
/
Published: 9 January 2024
(This article belongs to the Special Issue Advanced Studies on Steel Structures)
Abstract
:The current specification requires the same limiting values of inelastic rotation and the overstrength factor for shear links with a length ratio less than 1.6. However, recent studies have shown that the mechanical properties of ordinary shear links with a length ratio ranging from 1.0 to 1.6 are obviously different from those of very short shear links with a length ratio less than 1.0. Additionally, shear links made of different steel materials have differences in mechanical properties. Based on Q345 steel, three ordinary shear links with a length ratio of 1.36 were designed to intensively explore the influence of stiffener configurations and spacing on mechanical properties. Under cyclic loading tests, the failure modes, hysteresis curves, skeleton curves, secant stiffness curves and energy dissipation capacities of shear link specimens were recorded. The results show that the overstrength factor and inelastic rotation of specimens SL-1 and SL-2, which had different stiffener configurations, reached 1.59 and 0.10, while those of specimen SL-3, which had wider stiffener spacing, reached 1.48 and 0.07, which showed that varying the stiffener configuration has no obvious effect, while relaxing stiffener spacing can result in severe buckling of the web. Additionally, its bearing capacity, inelastic rotation, secant stiffness and energy dissipation capacity reduced. Hence, the stiffener spacing should satisfy the requirements of the specification and not be too wide. Based on ABAQUS software, finite element models of ordinary shear links proved to be accurately consistent with test specimens in terms of mechanical properties. On this basis, 114 numerical models of ordinary shear links with different length ratios, stiffener spacings, flange-to-web area ratios, flange strengths, web depth-to-thickness ratios and stiffener thicknesses were designed to study the influence on the overstrength factor.
1. Introduction
Eccentrically braced steel frame structures have been widely applied at home and abroad, and shear links are a typical energy-dissipating component of an eccentrically braced frame [1,2]. Eccentrically braced steel frame structures dissipate seismic energy through inelastic deformation of shear links and effectively ensure that columns, supports, non-energy-dissipating beams and other components are in the elastic stage [3,4,5,6,7]. A significant characteristic of the eccentrically braced steel frame structure is that damage occurs in predesigned shear links, protecting the connecting nodes from damage. Only replacing the shear link can restore the structure to its original function, which brings great convenience to post-earthquake repairs [8,9,10,11]. The overstrength factor and inelastic rotation are used to evaluate the lateral stiffness and energy dissipation capacity of shear links. According to specification [12], shear links are divided into shear type (ρ ≤ 1.6), bending type (1.6 < ρ < 2.6) and bending–shear type (ρ ≥ 2.6) according to the length ratio ρ (as shown in Equation (1)). Studies have shown that shear links have the best ductility and energy-dissipating capacity and are thus used preferentially in eccentrically braced steel frame structures [12]. The current specification requires the same limiting values of inelastic rotation and the overstrength factor for shear links with a length ratio less than 1.6, while the limiting values are 0.08 and 1.50, respectively [12].
Existing research has shown that shear links made of different steel materials have different mechanical properties. Yin [13] studied shear links based on LYP100 steel with a length ratio of 0.4 and pointed out that the overstrength factor could reach 3.29. Zhuang [14] studied shear links based on LYP160 steel with a length ratio of 0.97, and the overstrength factor could reach 2.0. Ghadami [15] studied shear links using LYP225 steel with a length ratio of 1.4, showing that the average overstrength factor was 1.55. Elgammal [16] created numerical models of shear links based on S275 steel with a length ratio of 0.97 and pointed out that the overstrength factor could reach 1.78. Yao [17] studied shear links using Q235 steel with a length ratio of 1.3, showing that the average overstrength factor was 1.85. Hu [18] conducted a study on numerical models of shear links based on Q235 steel with length ratios less than 1.0, and pointed out that the average inelastic rotation and overstrength factor were 0.13 and 1.90, respectively. Liu [19] studied shear links based on Q345 steel with a length ratio of 1.53, and the overstrength factor could reach 1.47. Men [20] studied a shear link whose flange was made of Q345 and whose web was made of Q235 with a length ratio of 1.40 and pointed out that the overstrength factor was 1.97. Mansour [21] studied shear links using CSA G40.21-350W-grade steel with a length ratio of 1.40 and pointed out that the maximum value of the overstrength factor was 1.68, and the average value was 1.50. Okazaki [22] studied shear links using A992 grade steel with a length ratio of 1.49, and the overstrength factor and inelastic rotation were 1.37 and 0.08, respectively.
Existing research [23] has shown that when the length ratio of shear link is higher than 1.0, its mechanical properties are significantly different from those of very short shear links with length ratios less than 1.0. Ozkilic [24] designed shear links with length ratios of 1.0 and 1.43 made of S275, whose overstrength factor could reach 1.76 and 1.58, respectively. Hu [18] recorded the overstrength factor of shear links based on Q235 steel with a length ratio less than 1.0 as 1.90, while Liu [19] studied shear links based on Q345 steel with a length ratio of 1.53 and pointed out that the overstrength factor could reach 1.47. To distinguish it from very short shear links, a shear link with a length ratio higher than 1.0 is defined as an ordinary shear link. In addition, existing research has shown that stiffener spacing [25,26], flange strength [27,28], flange-to-web area ratio [29], etc., have an obvious impacts on the overstrength factor of shear links.
To intensively explore the mechanical properties and influence factors of ordinary shear links made of Q345 steel with length ratios higher than 1.0, this research conducted a series of cyclic loading tests and abundant numerical modeling. Firstly, three ordinary shear link specimens with a length ratio of 1.36 were designed to study the influence of the stiffener configuration and stiffener spacing on the mechanical properties. Secondly, ABAQUS 2021 software was used to simulate the hysteresis curves and failure modes of the experimental specimens. Thirdly, parametric numerical research was performed to study the influencing factors of ordinary shear links on the mechanical properties.
2. Experimental Program
2.1. Basic Definitions of Shear Links
- Length ratio is denoted by ρ as shown in Equation (1), where e is the length of the shear link, Vp is the plastic shear capacity of the shear link, and Mp is the plastic moment capacity of the shear link. See the equations to define these parameters below:
- Overstrength factor: Vu/Vp, where Vu is the ultimate shear capacity of the shear link, and Vp is the plastic shear capacity of the shear link;
- Inelastic rotation: Δu/e, where Δu is the maximum lateral displacement of the shear link.
When the length ratio of a shear link is higher than 1.0, it is defined as an ordinary shear link. The specification stipulates that the overstrength factor and inelastic rotation of shear links shall not be less than 1.50 and 0.08 [12].
2.2. Test Material
In individual ordinary shear link specimens, all plates are made of Q345 steel. The composition of Q345 steel is shown in Table 1. The thicknesses of the web, flange and stiffener are 6 mm, 8 mm and 10 mm, respectively. Based on tensile property tests on steel materials of different thicknesses, the specific material property results are shown in Table 2.
2.3. Test Specimens
Based on Q345 steel, three specimens with different stiffener configurations and stiffener spacings, SL-1, SL-2 and SL-3, were designed to study the influence of stiffener configuration and stiffener spacing on the mechanical properties of ordinary shear links. The dimensions of the three specimens are shown in Figure 1, and the stiffener parameters of the specimens are shown in Table 3.
2.4. Test Protocol
The cyclic loading protocol was displacement-controlled. In Step 1, we used the general moment method [30] to determine the yield load Py and the yield displacement Δy of individual specimens. In Step 2, according to the requirements of the specification, the displacement step-by-step loading method was used to perform the cyclic displacement-controlled loading protocol on the specimens. The loading displacements are the multiples of the yield displacement Δy which are carried out in the order of Δy/4, Δy/2, 3Δy/4, Δy, 2Δy, 3Δy, 4Δy, etc. The loading displacement at each loading level cycles once.
2.5. Test Setup and Instrumentation
This test was conducted in the Structural Laboratory of Nanchang University, Jiangxi Province, China. The test setup and instrumentation are shown in Figure 2. The servo actuator was installed between the reaction wall and the loading beam to provide horizontal cyclic displacement. The upper end plate of the specimen was connected to the loading beam with high-strength friction-type bolts, while the lower end plate was connected to the ground beam with high-strength friction-type bolts. The high-strength bolts were 10.9 M22-grade. The yield strength and ultimate strength of the high-strength bolts were 940 MPa and 1040 MPa, respectively. To eliminate the outward movement, the loading beam and the ground beam were connected with two parallel pin-connected columns, and the loading beam was fixed by two reaction frames.
2.6. Measurement Distribution
This test measurement included the load and displacement in the shear direction and the strain in the dangerous area. The load and displacement in the shear direction were displayed on the monitor of the servo actuator. The measurement schemes of the displacement and strain in the dangerous area are shown in Figure 3.
(1) Displacement measurement. To ensure the displacement value showed by the actuator was close to the actual displacement of the specimen, the vertical and horizontal displacement transducers, D1 and D2, were distributed on the upper end plate of the specimen.
(2) Strain measurement. Based on the stress characteristics and symmetry, the strain gauges S1, S2, S3, and S4 were distributed in the middle of the upper and lower ends of the flange, while the transverse strain gauges S6 and S8 and the longitudinal strain gauges S5 and S7 were set at two corners of the web, respectively. The strain rosettes M1, M2 and M3 were distributed at the end and in the middle areas of the web.
3. Test Results
3.1. Failure Modes
3.1.1. Specimen SL-1
The failure process of SL-1 as determined using the cyclic loading protocol is shown in Figure 4. It mainly went through five stages: shear yielding, flange buckling, micro-cracking at the weld connection between the flange plate and the end plate, micro-crack extension and weld tearing.
As shown in Figure 4a, in the early stage of loading, the horizontal displacement of the specimen was small, and when the yield displacement Δy was reached, the shear strain values at S1, S2, S3 and S4 all reached the expected yield (Figure 4a). When the loading displacement was 22.67 mm, the end of the flange panel buckled (Figure 4b). When the displacement was −30.87 mm, a micro-crack appeared at the weld connection between the flange plate and the end plate (Figure 4c). When the loading displacement reached 44.18 mm, the buckling of the flange intensified, and the micro-crack at the weld extended (Figure 4d). When loaded to 63.31 mm, the maximum load value of the specimen reached 560.02 kN. One side of the weld between the flange plate and the end plate was completely torn, and the flange buckled violently (Figure 4e). The specimen was considered to have lost its bearing capacity. The test was finally stopped (Figure 4f).
3.1.2. Specimen SL-2
The stiffeners of specimen SL-2 were only distributed on the signal side, and stiffener spacing and other parameters were consistent with specimen SL-1. The aim was to explore the influence of stiffener configurations on the mechanical properties of ordinary shear link. Under cyclic loading, the failure mode of specimen SL-2 was basically the same as that of SL-1, which mainly went through five stages: shear yield, flange buckling, micro-cracking at the weld, micro-crack extension and crack tearing.
As shown in Figure 5a, in the early stage of loading, the horizontal displacement of the specimen was small. When the yield displacement Δy was reached, the shear strain values at S1, S2, S3 and S4 all reached the expected yield (Figure 5a). When the loading displacement was −22.21 mm, the end plate of the flange buckled (Figure 5b). When the displacement was 30.57 mm, a micro-crack appeared at the weld connection between the flange plate and the end plate (Figure 5c). When the loading continued until the displacement reached 43.98 mm, the micro-crack extended (Figure 5d). When loaded to 63.12 mm, the maximum load value of the specimen was 556.20 kN, and the crack extended into a 30° diagonal crack (Figure 5e). One side of the weld was completely torn. The flange plate buckled violently and lost its bearing capacity, and the specimen was damaged. The test was finally stopped (Figure 5f).
3.1.3. Specimen SL-3
The stiffeners of specimen SL-3 were distributed on both sides, but the stiffener spacing exceeded the limit of the specification. The aim was to study the impact of relaxing the stiffener spacing on the mechanical properties of ordinary shear links. The early loading stage was basically the same as that of SL-1, but the final damage pattern was different. It mainly went through five stages: shear yield, flange buckling, micro-cracking at the weld connection between the flange plate and the end plate, web buckling and specimen damage.
As shown in Figure 6a, in the early stage of loading, the horizontal displacement of the specimen was small. When the yield displacement Δy was reached, the shear strain values at S1, S2, S3 and S4 all reached the expected yield (Figure 6a). When the loading displacement was 20.71 mm, the end of the flange plate buckled (Figure 6b). When the displacement was 30.75 mm, a micro-crack appeared at the weld connection between the flange plate and the end plate (Figure 6c). When the loading continued until the displacement reached 42.18 mm, the crack extended, and the web plate underwent slight buckling (Figure 6d). When the displacement reached 44.57 mm, the maximum load value was 518.73 kN, and the bearing capacity of specimen SL-3 suddenly decreased, while the displacement continued to increase. With continuous loading, the shear force value instantly dropped to 460.31 kN, the entire shear link experienced a large lateral shift, the web plate severely buckled, and the specimen lost its bearing capacity, so the specimen was damaged. The test was finally stopped (Figure 6e).
To sum up, the failure processes of the three specimens were roughly the same. The failure modes of SL-1 and SL-2 were basically the same, indicating that the stiffener configuration has no significant impact on the mechanical properties of ordinary shear links. However, the crack in SL-2 extended into a 30° diagonal crack, which had a negative impact on the eccentrically braced steel frame. In seismic design, it is recommended that stiffeners be distributed on both sides of the web. Compared with SL-1, SL-3 had a decrease in the bearing capacity and an overall area plastic phenomenon, in which both the web and flange turned plastic, indicating that relaxing stiffener spacing will decrease the bearing capacity and ductility of ordinary shear links. Therefore, whether it is a very short shear link or an ordinary shear link, the stiffener spacing should satisfy the specification requirements and not be too wide.
3.2. Hysteresis Curves
Figure 7 shows the hysteresis curves of individual specimens under the cyclic loading protocol. The hysteresis curves are wide, and the load increased with the increase in displacement. There is an obvious smooth section before the load increased to the maximum value. According to the hysteresis curves, when the shear force reached 70% of the maximum load, the force remained unchanged, and the displacement continued to increase. When the inelastic rotation was 0.03 rad, the shear force slowly increased to the maximum load value as the displacement increased. This phenomenon is caused by the full-section plasticity of the flange end and tearing of the weld at the connection between the flange plate and the end plate. As shown in Figure 7a, when the loading displacement was 26.95 mm, the shear force in the hysteresis curve was delayed in reaching the maximum value. In the experiment (Figure 4), a micro-crack in the weld appeared when the displacement was 30.87 mm, which is consistent with the hysteresis curve. Therefore, the plasticity of the entire flange end will cause the hysteresis curve to be delayed in reaching the maximum value.
The hysteresis curves of SL-1 and SL-2 are always in the strengthening stage, with the ultimate shear forces of specimens SL-1 and SL-2 being 560.02 kN and 556.20 kN, respectively, and the ultimate inelastic rotations were 0.10 rad for both. Therefore, distributing stiffeners on one side or both sides has little impact on the mechanical properties of ordinary shear links, and both specimens have good ductility and energy-dissipating capacity. For specimen SL-3, which had a large stiffener spacing, the ultimate shear force was only 517.31 kN when the inelastic rotation reached 0.07 rad. During the subsequent loading process, the shear force decreased with the increase in displacement, and when the inelastic rotation was 0.08 rad, the shear force was only 436.28 kN, so relaxing the stiffener spacing will cause both the bearing capacity and ductility of ordinary shear links to decrease violently. The corresponding ultimate bearing capacity and inelastic rotation of specimen SL-3 were 517.31 kN and 0.07 rad, respectively. The mechanical properties of individual specimens are shown in Table 4.
To sum up, the overstrength factor and inelastic rotation of SL-1 and SL-2 reached 1.59 and 0.10, while those of SL-3 only reached 1.48 and 0.07, which are lower than the existing design standard values of 1.50 and 0.08. It is necessary to meet the required stiffener spacing. Considering the 30° diagonal crack in the weld of SL-2, distributing stiffeners on one side is not recommended.
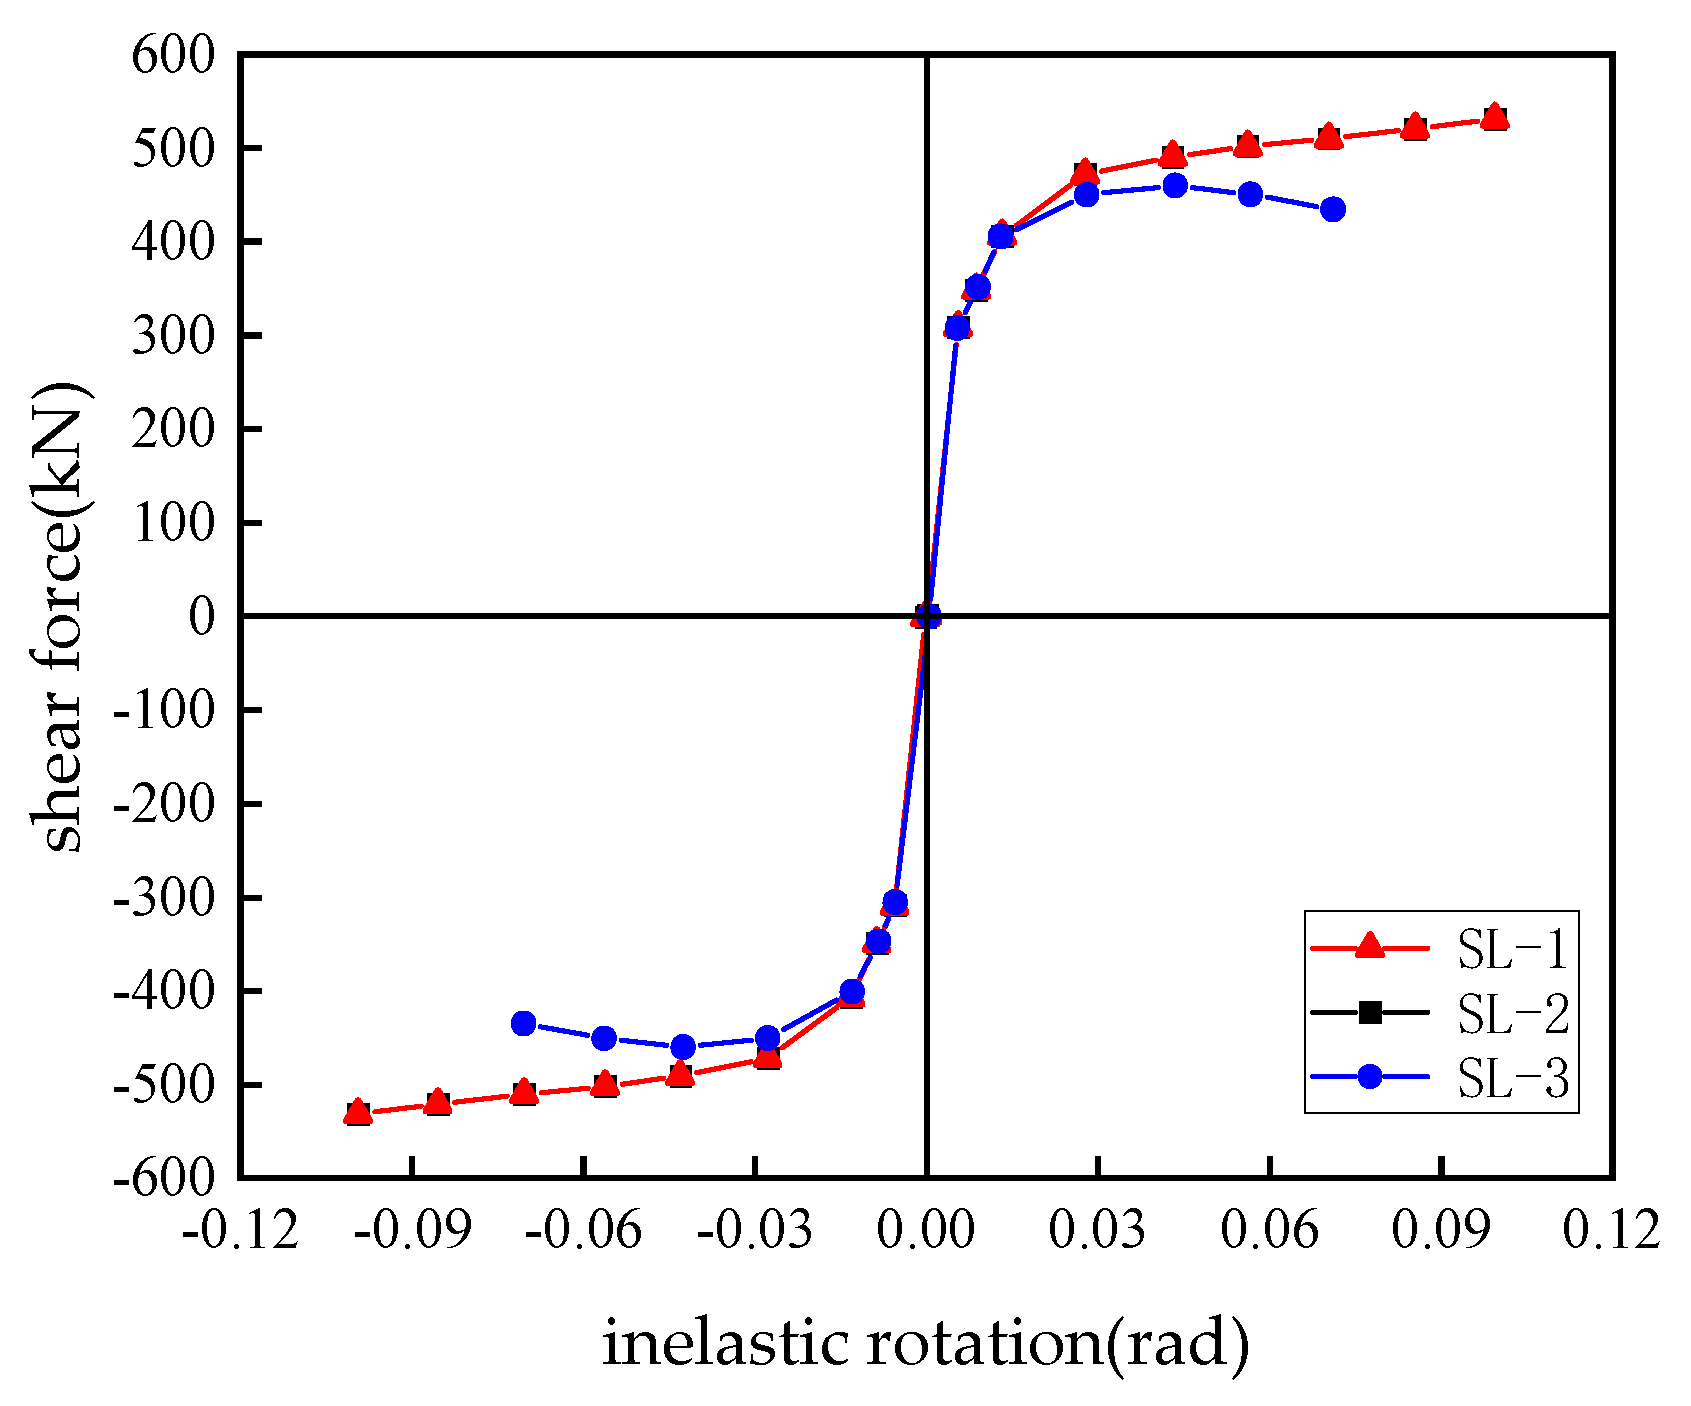
3.3. Skeleton Curves
Figure 8 shows the skeleton curves of each specimen. It can be seen from the figure that the initial stage of the three specimens was the elastic stage, after which all specimens entered the elastic–plastic and plastic stages. The shear force of specimens SL-1 and SL-2 always increased gradually with the increase in displacement, and there was no obvious difference between these two specimens in any loading step; however, the shear force of specimen SL-3 reached a maximum when the inelastic rotation was 0.07 rad, followed by a sharp decrease in the load-bearing capacity due to the buckling of the web and flange. Compared with SL-1, SL-3 had a decreased load-bearing capacity after reaching the maximum shear force. Therefore, the distribution of stiffeners has no significant impact on the mechanical properties of ordinary shear links, but relaxing the stiffener spacing will significantly affect their bearing capacity and ductility.
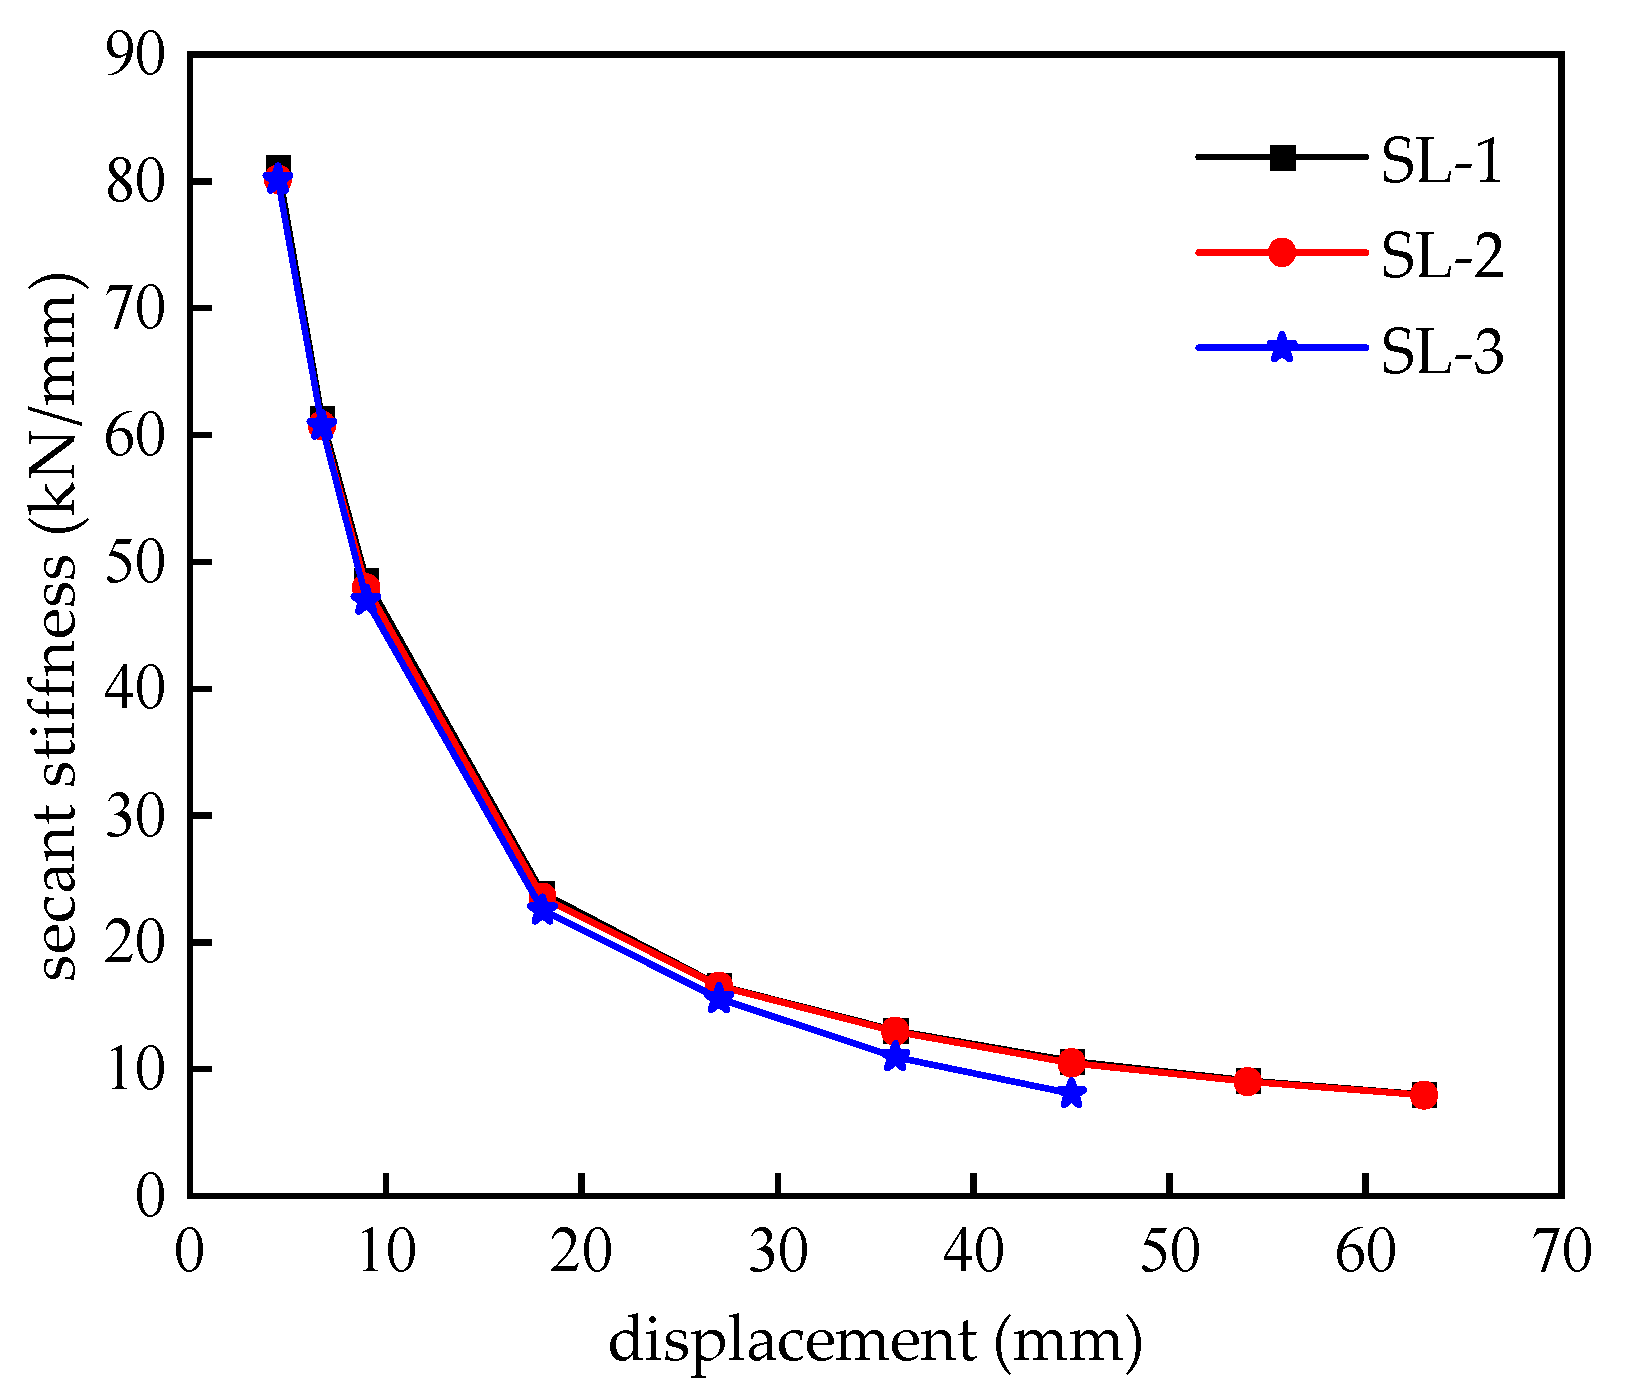
3.4. Secant Stiffness Curves
The secant stiffness refers to the stiffness of a structure when it reaches the maximum load point from the origin when subjected to external forces. The decrease in the secant stiffness will cause the structure to deform greatly during the stress process, which may exceed the allowable deformation range and lead to damage to the function of the structure, so it is vital to investigate the secant stiffness of ordinary shear links.
Figure 9 shows the secant stiffness curves of individual specimens. During the entire loading process, the secant stiffness values of individual specimens showed gradually decreasing trends. At the beginning of loading, the secant stiffness values of individual specimens were basically the same. As the displacement increased, the secant stiffness values of specimens SL-1 and SL-2 were basically equal, but the secant stiffness value of specimen SL-3 decreased, which was mainly caused by relaxing the stiffener spacing of the ordinary shear link, leading to greater buckling of the web and flange.
3.5. Energy-Dissipating Capacity
The energy dissipation value is an important indicator for evaluating the energy dissipation capacity. When the energy dissipation capacity of a structure is insufficient, it cannot effectively absorb and dissipate the energy of external loads, causing the remaining energy to be concentrated in a certain part of the structure. This will cause the structure to undergo greater stress and deformation under earthquakes or other loads, increasing the severity of the structure’s damage, so it is vital to investigate the energy dissipation capacity of ordinary shear links.
Figure 10 shows the energy dissipation values of each specimen. As the displacement increased, the energy dissipation values of three specimens all increased steadily, indicating that the three specimens all show good energy dissipation capacities. The energy dissipation values of SL-1 and SL-2 at the maximum displacement of 63 mm were 99.84 kJ and 97.92 kJ, respectively, with only a 3% decrease. However, the energy dissipation value of SL-3 at the maximum displacement 45 mm was only 66.62 kJ, while the energy dissipation value of SL-1 under the same displacement was 75.36 kJ, with a decrease of 13%, which shows that distributing stiffeners on one side will reduce the energy dissipation capacity by 3%, while relaxing the stiffeners will reduce the energy dissipation capacity by 13%.
4. Numerical Modeling of Ordinary Shear Links
4.1. Basic Procedure of Numerical Modeling
(1) Material properties. The material properties of the steel plates of the numerical shear link models are shown in Table 2. The material constitutive curves of the numerical models are shown in Figure 11.
(2) Boundary conditions. The specimen was in the loading environment described in Section 2.5. In the horizontal direction, the loading beam and ground beam were connected with two parallel pin-connected columns, and the loading beam was fixed by two reaction frames to eliminate outward movement, and the in-plane displacement was provided by the actuator. In the vertical direction, the shear link was connected to the loading beam and ground beam through friction high-strength bolts. Therefore, in finite element models, the displacement of the lower end plate of the shear link is restricted in all directions, and the horizontal in-plane displacement of the upper end plate of the shear link is allowed.
(3) Loading protocol. In finite element models, where horizontal displacement is induced on the upper end plate of the shear link, the moment and shear force at the end plate of the shear link can be simulated in the same way as the actual shear force in the eccentrically frame structure. The specific loading method is the same as that used in the experiment, as described in Section 2.4.
4.2. Comparison of Finite Element and Test Results
The SL-1, SL-2 and SL-3 models were established using ABAQUS software. The parameters and boundary conditions were consistent with those used in the test.
4.2.1. Ultimate Shear Force and Overstrength Factor
The ultimate shear force and overstrength factor obtained by finite element models are shown in Table 5. The errors between the test and finite element analysis results were less than 5%. Therefore, the finite element model is reliable to simulate actual specimens.
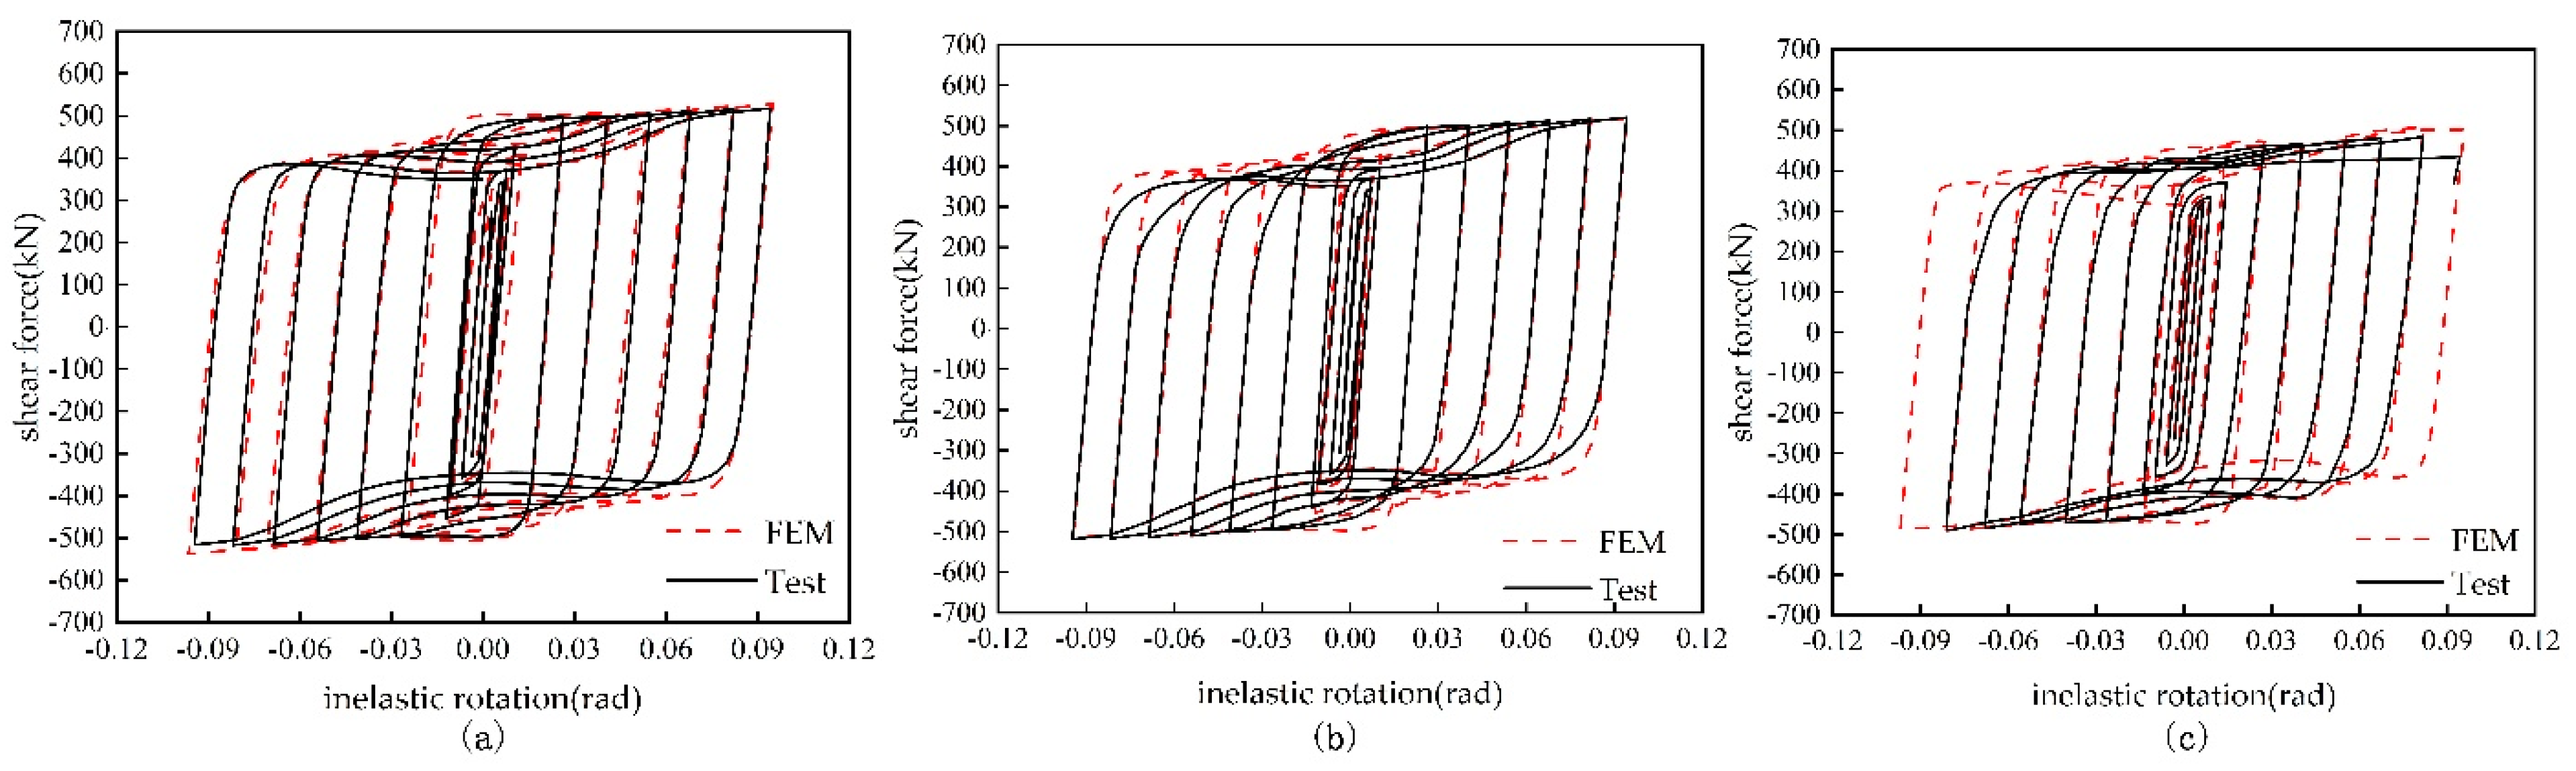
4.2.2. Hysteresis Curves
The hysteresis curves are shown in Figure 12. The hysteresis curves of the test specimens are in good agreement with the hysteresis curves of the finite element models, and both had good energy dissipation capabilities. Additionally, the hysteresis curves of finite element models indicate that shear force led to a delay in reaching the maximum load, which is consistent with the test results.
4.2.3. Failure Process
During the test, the flange of specimen SL-1 buckled; then, the weld between the flange and the end plate was torn, and finally, the specimen lost its bearing capacity. As shown in Figure 13, the flange first buckled after the web experienced shear yielding. As the displacement continued to increase, the stress between the flange and the end plate of specimen SL-1 reached the maximum, indicating that the weld tearing phenomenon occurs between the flange and the end plate, which is consistent with the failure mode during the test. The finite element results of specimen SL-2 are basically the same as those of SL-1. The finite element results of specimen SL-3 showed the most severe flange buckling, and the ultimate displacement was only 5Δy, which is consistent with the test, proving the finite element model is correct.
From Figure 13 and Figure 14, it can be observed that the full-section stress at the connection between the flange plate and the end plate reached the maximum, which resulted in the tearing of the weld between the flange plate and the end plate of the ordinary shear link. For very short shear links, the connection between the flange and the end plate of the did not reach full-section maximum stress initially [13]. Therefore, the control section of an ordinary shear link with a length ratio close to 1.6 was the weld connection between the flange plate and the end plate, and the failure characteristic was the tearing of the weld between the flange and the end plate.
4.3. Parametric Study on the Factors Influencing the Overstrength of Ordinary Shear Links
In order to intensively explore the influencing factors and changing rules of the overstrength factors of ordinary shear links made of Q345 steel, multiple sets of ordinary shear link models were designed to study the influence of six parameters on the overstrength factor. The research models were all based on two basic sections: the narrow flange section (H300 × 150 × 6 × 8) and middle flange section (H362 × 250 × 14 × 20). The finite element models adopted the cyclic loading protocol in the seismic specification for steel structures, and the boundary conditions were the same as those of the finite element models in Section 4.1. The properties of Q235 and Q345 steel are shown in Table 2. All stiffeners were distributed on both sides, and the stiffener spacing of all shear link sections met the specification requirements. The stiffener thickness of the basic section H300 × 150 × 6 × 8 was 10 mm, and the stiffener thickness of the basic section H362 × 250 × 14 × 20 was 14 mm.
4.3.1. Length Ratio
An existing study showed that the overstrength factor of shear links was significantly affected by the length ratio. As shown in Table 6, overstrength factors of different length ratios were obtained by changing the length of the ordinary shear links while keeping the cross-section unchanged. The web, flange and stiffeners were all made of Q345 steel, and the stiffener thicknesses were 10 mm and 14 mm, respectively. There were four stiffeners equidistantly distributed on both sides.
It can be seen from Figure 15 that the overstrength factor has an obvious relationship with the length ratio. The overstrength factor of the models decreased with the increase in the length ratio; that is, the ultimate shear force decreased with the increase in the length ratio.
4.3.2. Stiffener Spacing
Existing research showed that the stiffener spacing has a significant impact on the mechanical properties of shear links. In order to intensively explore the impact of stiffener spacing on the overstrength factor of ordinary shear links with length ratios higher than 1.0, 24 finite element models were designed. The length-to-stiffener spacing ratio is denoted by ns:
where e is the length of shear links, and a is the stiffener spacing. The flange, web and stiffeners were all made of Q345, and the stiffener thicknesses were 10 mm and 14 mm, respectively. Other dimensions of the finite element models are shown in Table 7.
In Figure 16, the solid square represents ns = 6, and the hollow triangle represents ns = 5. Whether it is Figure 16a or Figure 16b, as ns changes from 6 to 5, the overstrength factor significantly decreases. Hence, relaxing the stiffener spacing will significantly reduce the overstrength factor of ordinary shear links.
4.3.3. Flange-to-Web Area Ratio
On the basis of sections H300 × 150 × 6 × 8 and H362 × 250 × 14 × 20, except for changing the flange extension width and link length, other conditions remained unchanged. For sections H300 × bf × 6 × 8 and H362 × bf × 14 × 20, 24 finite element models with different flange extension widths and link lengths were designed to study the influence of the flange-to-web area ratio on the overstrength factor of ordinary shear links. Their parameters are shown in Table 8. The flange width-to-thickness ratio of all models meet the 10ε value proposed by Hu [16], and the stiffener spacing meets the specification requirements. The web, flange and stiffeners were all made of Q345 steel, and the stiffener thicknesses were 10 mm and 14 mm, respectively.
As shown in Figure 17, the solid square, triangle and circle represent H300 × bf × 6 × 8 sections with lengths of 710 mm, 730 mm and 750 mm, respectively. The hollow square, triangle and circle represent H362 × bf × 14 × 20 sections with lengths of 1170 mm, 1200 mm and 1230 mm, respectively. The abscissa is the flange-to-web area ratio, as shown in Table 8. From the analysis in the figure, it can be seen that changing the flange-to-web area ratio has a significant impact on the overstrength factor of ordinary shear links. Two sections all show that increasing the flange-to-web area ratio will increase the overstrength factor.
4.3.4. Flange Strength
On the basis of the sections H300 × 150 × 6 × 8 and H362 × 250 × 14 × 20, the flanges were made of Q235 and Q345 steel, respectively, the web and stiffeners were made of Q345 steel, and the stiffener thicknesses were 10 mm and 14 mm, respectively. The remaining parameters are shown in Table 9.
As shown in Figure 18, the solid square represents the models whose flanges are made of Q345 steel, and the hollow triangle represents the models whose flanges are made of Q235 steel. From the figure, it can be seen that the flange strength has a clear relationship with the overstrength factor of ordinary shear links. As the flange strength decreased, the overstrength factor dropped violently to below 1.50. Therefore, for ordinary shear links, increasing the flange strength will increase the overstrength factor, and it is not recommended that the flange strength be lower than the web strength.
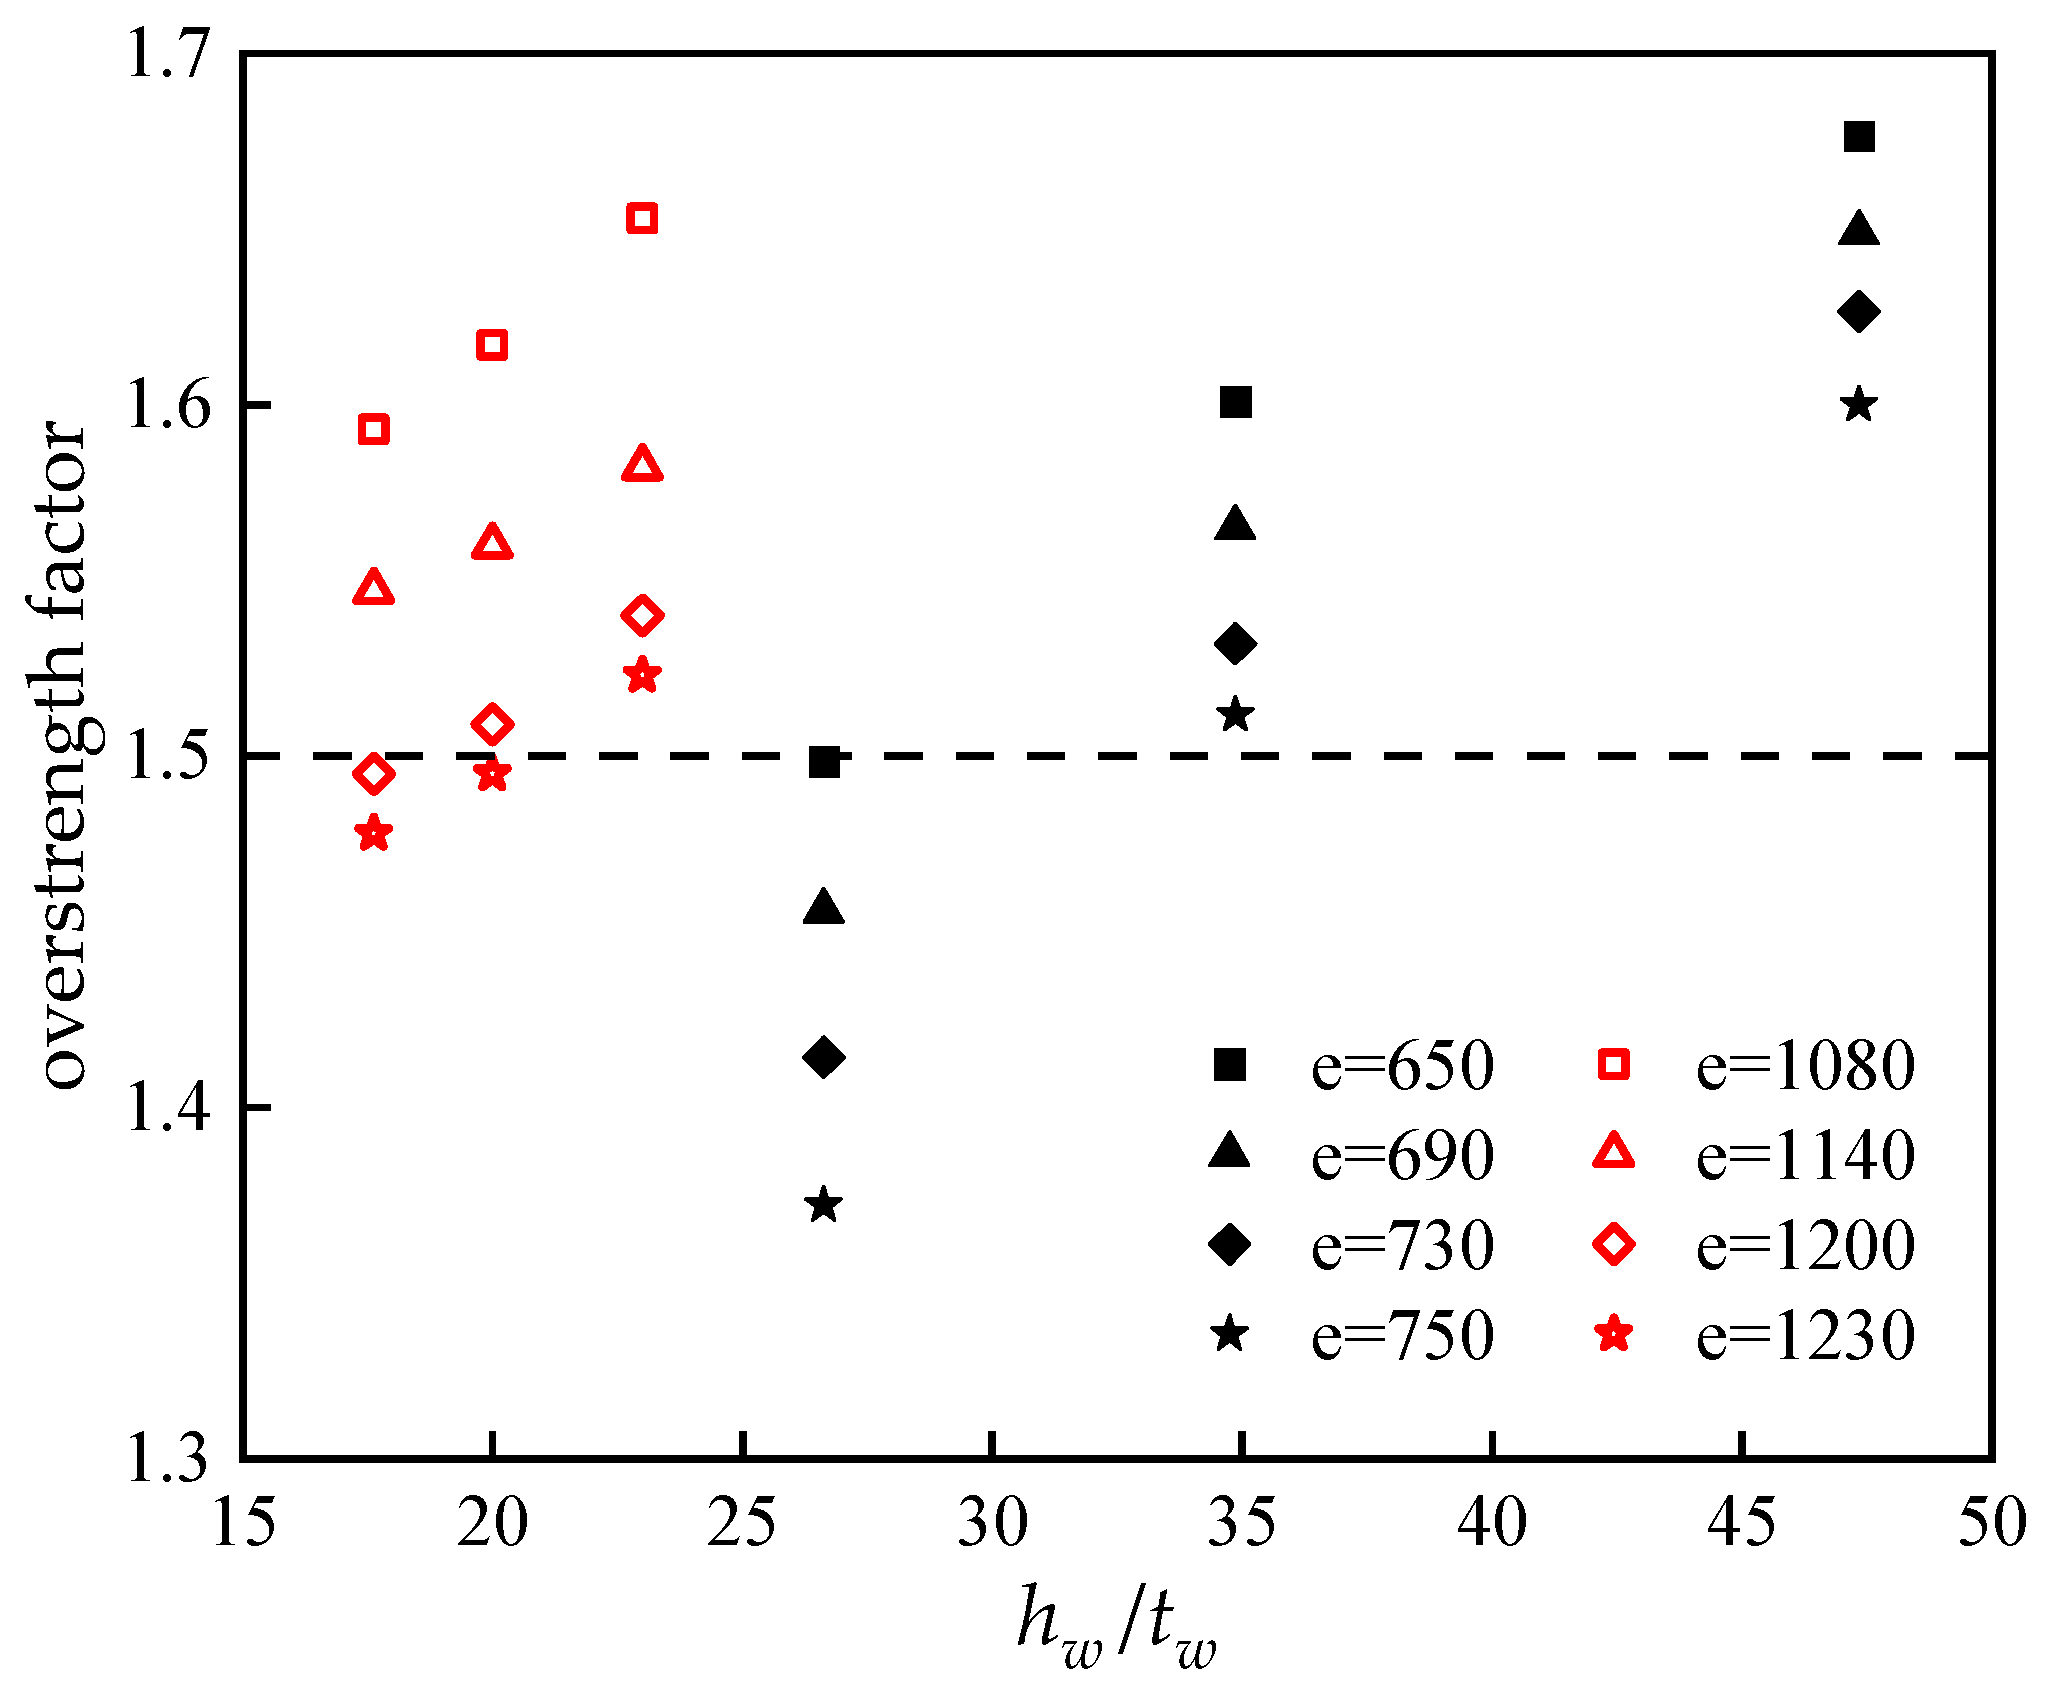
4.3.5. Web Depth-to-Thickness Ratio
On the basis of the sections H300 × 150 × 6 × 8 and H362 × 250 × 14 × 20, the web area remained unchanged, while the depth-to-thickness ratio of the web was changed, as shown in Table 10. The flange, web and stiffeners were made of Q345 steel, and the thicknesses of the stiffeners were 10 mm and 14 mm, respectively.
As shown in Figure 19, the solid shapes represent the h × 150 × tw × 8 section with lengths of 650 mm, 690 mm, 730 mm and 750 mm, respectively, while the hollow shapes represent the h × 250 × tw × 20 section with lengths of 1080 mm, 1140 mm, 1200 mm and 1230 mm, respectively. It can be seen from Figure 19 that reducing the web depth-to-thickness ratio can increase the overstrength factor of ordinary shear links, but the web cannot be too thin. Hence, there must be a suitable value to make the most use of materials. Corresponding research can be conducted to decide the most suitable depth-to-thickness ratio.
4.3.6. Stiffener Thickness
On the basis of the sections H300 × 150 × 6 × 8 and H362 × 250 × 14 × 20, the stiffener thickness was changed, and other parameters remained unchanged. As shown in Table 11, ts is the stiffener thickness of ordinary shear links. The flange, web and stiffeners were made of Q345 steel.
As shown in Figure 20a, when the stiffener thickness was changed from 10 mm to 6 mm, the overstrength factor was only reduced by 1.08%. As can be seen in Figure 20b, the stiffener thickness was changed from 14 mm to 10 mm, but the overstrength factor was only reduced by 1.87%. The error is negligible. Therefore, changing the stiffener thickness has little influence on the overstrength factor of ordinary shear links, but the stiffener thickness should still meet the structural requirements.
5. Conclusions
To investigate the cyclic behavior of ordinary shear links made of Q345 steel, this research designed three ordinary shear link specimens, each having different stiffener spacings and configuration patterns, with length ratios higher than 1.0 for experimental research and finite element analysis. In addition, 114 finite element models were designed to study the factors affecting the mechanical properties of ordinary shear links. The following conclusions are drawn:
- (1)
- The failure modes of the three specimens were basically the same. They all experienced four stages: shear yielding, flange buckling, micro-cracking in the weld between the flange plate and the end plate and weld extension, while the damage was failures in all shear yield. Specimens SL-1 and SL-2 experienced weld tearing and lost their bearing capacities. Specimen SL-3 experienced severe web buckling and lost its bearing capacity.
- (2)
- Distributing stiffeners on one side or both sides has no significant impact on the mechanical properties of ordinary shear links, while relaxing stiffener spacing would significantly increase the buckling phenomenon of the web and decrease its ultimate shear force and ultimate displacement.
- (3)
- The overstrength factor and inelastic rotation of Specimens SL-1 and SL-2 were almost the same, at 1.59 and 0.10, respectively, while those of Specimen SL-3 were 1.48 and 0.07, significantly lower than the specification values. Stiffener spacing should meet the specification requirements in engineering design.
- (4)
- The results of the 114 parameter numerical models of ordinary shear links made of Q345 steel indicated that the length ratio, stiffener spacing, flange-to-web area ratio, flange strength and web depth-to-thickness ratio have significant influences on the overstrength factor of ordinary shear links.
- (5)
- The main failure mode of causing the tearing of ordinary shear links is weld tearing between the flange plate and the end plate; the process of weld tearing is slow, and the specimen still plays a connecting role and can withstand a certain shear force after damage. In the K-type eccentrically braced steel frame, the small ultimate displacement of the ordinary shear link is beneficial to protect the floor from damage, and slow damage allows the frame to have good ductility. The application of ordinary shear links in the K-type eccentrically braced frame can be intensively studied in the future.
- (6)
- The failure process of the specimens includes large steel plate deformation, and this deformation was observed with the naked eye. Visualization software could be used to monitor tiny deformations in future research.
Author Contributions
Conceptualization, S.H. and S.L.; methodology, S.H.; software, S.L. and T.S.; validation, S.H. and T.S.; formal analysis, S.L.; investigation, S.L.; resources, S.Z.; data curation, T.S.; writing—original draft preparation, S.L.; writing—review and editing, S.H. and T.S.; visualization, S.Z.; supervision, T.S.; project administration, S.H.; funding acquisition, S.H. and S.Z. All authors have read and agreed to the published version of the manuscript.
Funding
This research was funded by the Natural Science Foundation of China (Grant No. 51908268), Young Leader of Science and Technology Research Project for Jiangxi Province (Grant No. 20232BCJ23065), Natural Science Foundation of Jiangxi Province (Grant No. 20224BAB204062), Young Leader of Science and Technology Research Project for Jiangxi Bureau of Geology (Grant No. 2022JXDZKJRC09) and Jiangxi Postgraduate Innovative Foundation (Grant No. YC2023-S078).
Data Availability Statement
The data used to support the findings of this study are available from the authors upon request. The data are not publicly available due to privacy.
Conflicts of Interest
Author Sizhi Zeng was employed by the company Zhongmei Engineering Group Co. Ltd. The remaining authors declare that the research was conducted in the absence of any commercial or financial relationships that could be construed as a potential conflict of interest.
References
- Volynkin, D.; Dusicka, P.; Clifton, G.C. Intermediate web stiffener spacing evaluation for shear links. J. Struct. Eng. 2019, 145, 04018257. [Google Scholar] [CrossRef]
- Hu, S.J.; Liao, Y.; Zeng, S.Z.; Huang, H.; Yu, Y.J. Cyclic shear test and stiffness study of a cross-section-type shear connector connection. J. Constr. Steel Res. 2024, 212, 108318. [Google Scholar] [CrossRef]
- Tashakori, J.; Razzaghi, J.; Ansari, S. Reassessment of current design criteria of plastic hinges in shear links. J. Constr. Steel Res. 2019, 158, 350–365. [Google Scholar] [CrossRef]
- Chen, Q.D.; Xu, L.Y.; Liu, Y.; Wu, Y.X. Application and analysis of seismic isolation design for a high-rise residential building in high seismic fortification intensity area. J. Nanchang Univ., Eng. Technol. 2021, 43, 22–29. [Google Scholar] [CrossRef]
- Xu, R.R.; Tao, Z.; Dai, B.H.; Dai, J.S.; Zhao, C.; Yang, L. Finite element analysis of sectoral viscoelastic dampers applied to tenon joint reinforcement. J. Nanchang Univ. Eng. Technol. 2022, 44, 344–350. [Google Scholar] [CrossRef]
- Minh, P.N.; Uyen, T.M.T.; Do, T.T.; Nguyen, V.-T.; Nguyen, V.T.T. Enhancing the fatigue strength of the weld line in advanced polymer injection molding: Gas-assisted mold temperature control for thermoplastic polyurethane (TPU) composites. Polymers 2023, 15, 2440. [Google Scholar] [CrossRef] [PubMed]
- Hu, S.J.; Zeng, S.Z.; Zhou, Q.; Zhi, Q.; He, K. Mechanism and seismic performance of a novel precast concrete beam-to-very short shear link joint Experimental and numerical simulation. Structures 2023, 56, 104938. [Google Scholar] [CrossRef]
- Vetr, M.G.; Ghamari, A.; Bouwkamp, J.A. Investigating the nonlinear behavior of eccentrically braced frame with vertical shear links (V-EBF). J. Build. Eng. 2017, 10, 47–59. [Google Scholar] [CrossRef]
- Bozkurt, M.B.; Azad, S.K.; Topkaya, C. Development of detachable replaceable links for eccentrically braced frames. Earthq. Eng. Struct. Dyn. 2019, 48, 1134–1155. [Google Scholar] [CrossRef]
- Ghadami, A.; Al-Mazaidh, R. Simple truss model to estimate the shear strength of short links in the eccentrically braced frame (EBF) steel system. Thin Wall Struct. 2023, 188, 110811. [Google Scholar] [CrossRef]
- Hu, S.J.; Chang, L.Q.; Zhang, B.; Zeng, S.Z.; Tang, F.H.; Zhi, Q. Seismic response of resilient steel frame with self-centering SMA brace. Int. J. Steel Struct. 2023, 23, 1587–1601. [Google Scholar] [CrossRef]
- GB 50011-2010; Code for Seismic Design of Buildings. Chinese Building Industry Press: Beijing, China, 2016.
- Yin, W.H.; Sun, F.F.; Jin, H.J.; Hu, D.Z. Experimental and analytical study on plastic overstrength of shear links covering the full range of length ratio. Eng. Struct. 2022, 220, 110961. [Google Scholar] [CrossRef]
- Zhuang, L.D.; Wang, J.J.; Nie, X.; Wu, Z.H. Experimental study on the cyclic behaviour of shear links made of BLY160 steel. Thin Wall Struct. 2022, 174, 109072. [Google Scholar] [CrossRef]
- Ghadami, A.; Pourmoosavi, G.H.; Talatahari, S.; Azar, B.F. Overstrength factor of short low- yield-point steel shear links. Thin Wall Struct. 2021, 161, 107473. [Google Scholar] [CrossRef]
- Elgammal, A.; Hassanein, M.F.; Seleemah, A. Enhancing the cyclic performance of shear links using longitudinal stiffeners. J. Constr. Steel Res. 2023, 211, 108200. [Google Scholar] [CrossRef]
- Yao, Z.C.; Wang, W.; Fang, C.; Zhang, Z.Y. An experimental study on eccentrically braced beam-through steel frames with replaceable shear links. Eng. Struct. 2020, 206, 110185. [Google Scholar] [CrossRef]
- Hu, S.J.; Xiong, J.G.; Zhou, Q.; Lin, Z.B. Analytical and numerical investigation of overstrength factors for very short shear links in EBFs. KSCE J. Civ. Eng. 2018, 22, 4473–4482. [Google Scholar] [CrossRef]
- Liu, X.G.; Fan, J.S.; Liu, Y.F.; Yue, Q.R.; Nie, J.G. Experimental research of replaceable Q345GJ steel shear links considering cyclic buckling and plastic overstrength. J. Constr. Steel Res. 2017, 134, 160–179. [Google Scholar] [CrossRef]
- Men, J.J.; Xiong, L.Q.; Wang, J.C.; Zhang, Q.; He, P.J. An experimental study on the seismic behavior and replaceability of the replaceable steel shear links. Structures 2021, 33, 2334–2348. [Google Scholar] [CrossRef]
- Mansour, N.; Christopoulos, C.; Tremblay, R. Experimental validation of replaceable shear links for eccentrically braced steel frames. J. Struct. Eng. 2011, 137, 1141–1152. [Google Scholar] [CrossRef]
- Okazaki, T.; Engelhardt, M.D. Cyclic loading behavior of EBF links constructed of ASTM A992 steel. J. Constr. Steel Res. 2007, 63, 751–765. [Google Scholar] [CrossRef]
- Hu, S.J.; Wang, X.F.; Xiong, J.G.; Zeng, S.Z.; Dong, X.W. Analysis on influence factors and change rules of overstrength coefficient for shear links. J. Build. Struct. 2020, 50, 89–96. [Google Scholar] [CrossRef]
- Ozkilic, Y.O.; Topkaya, C. Extended end-plate connections for replaceable shear links. Eng. Struct. 2021, 240, 112385. [Google Scholar] [CrossRef]
- Singh, M.; Sharma, S.; Muniappan, A.; Pimenov, D.Y.; Wojciechowski, S.; Jha, K.; Dwivedi, S.P.; Li, C.; Królczyk, J.B.; Walczak, D.; et al. In situ micro-observation of surface roughness and fracture mechanism in metal microforming of thin copper sheets with newly developed compact testing apparatus. Materials 2022, 15, 1368. [Google Scholar] [CrossRef] [PubMed]
- Özkiliç, Y.O. Interaction of flange and web slenderness, overstrength factor and proposed stiffener arrangements for long links. J. Constr. Steel Res. 2022, 190, 107150. [Google Scholar] [CrossRef]
- Ghadami, A.; Pourmoosavi, G.H. Numerical investigation on the flange contribution in the shear strength of short LYP I-shaped links without intermediate stiffeners. Structures 2022, 40, 485–497. [Google Scholar] [CrossRef]
- Yin, Z.Z.; Feng, D.Z.; He, Y.L. Restoring force model of end-plate bolted shear links in eccentrically braced frames. J. Constr. Steel Res. 2022, 199, 107623. [Google Scholar] [CrossRef]
- Corte, G.D.; D’Aniello, M.; Landolfo, R. Analytical and numerical study of plastic overstrength of shear links. J. Constr. Steel Res. 2013, 82, 19–32. [Google Scholar] [CrossRef]
- Xue, J.Y.; Liu, Y.; Zhao, H.T.; Chen, Z.P.; Sui, Y. Experimental study on seismic behavior of steel reinforced concrete special-shaped column-beam joints. J. Build. Struct. 2009, 30, 69–77. [Google Scholar] [CrossRef]
Figure 1.
Dimensions of the test specimens: (a) specimen SL-1; (b) specimen SL-2; (c) specimen SL-3.
Figure 1.
Dimensions of the test specimens: (a) specimen SL-1; (b) specimen SL-2; (c) specimen SL-3.

Figure 2.
Experiment setup.

Figure 3.
Measurement distribution: (a) SL-1 and SL-2; (b) SL-3.

Figure 4.
Failure process of SL-1: (a) shear yield; (b) flange buckling; (c) micro-crack appearing at the weld connection between the flange plate and the end plate; (d) micro-crack extension; (e) a crack was torn; (f) failure mode of SL-1.
Figure 4.
Failure process of SL-1: (a) shear yield; (b) flange buckling; (c) micro-crack appearing at the weld connection between the flange plate and the end plate; (d) micro-crack extension; (e) a crack was torn; (f) failure mode of SL-1.

Figure 5.
Failure process of SL-2: (a) shear yield; (b) flange buckling; (c) rear view of flange buckling; (d) micro-crack appearing at the weld connection between the flange plate and the end plate; (e) a crack was torn; (f) failure mode of SL-2.
Figure 5.
Failure process of SL-2: (a) shear yield; (b) flange buckling; (c) rear view of flange buckling; (d) micro-crack appearing at the weld connection between the flange plate and the end plate; (e) a crack was torn; (f) failure mode of SL-2.

Figure 6.
Failure process of SL-3: (a) shear yield; (b) flange buckling; (c) micro-crack appearing at the weld connection between the flange plate and the end plate; (d) web buckling; (e) failure mode of SL-3.
Figure 6.
Failure process of SL-3: (a) shear yield; (b) flange buckling; (c) micro-crack appearing at the weld connection between the flange plate and the end plate; (d) web buckling; (e) failure mode of SL-3.

Figure 7.
Hysteresis curves of the specimens: (a) specimen SL-1; (b) specimen SL-2; (c) specimen SL-3.
Figure 7.
Hysteresis curves of the specimens: (a) specimen SL-1; (b) specimen SL-2; (c) specimen SL-3.

Figure 8.
Skeleton curves of all test specimens.

Figure 9.
Secant stiffness curves of all test specimens.

Figure 10.
Energy dissipation curves of all test specimens.

Figure 11.
Material constitutive curves of the numerical models.

Figure 12.
Hysteresis curves of the finite element models: (a) specimen SL-1; (b) specimen SL-2; (c) specimen SL-3.
Figure 12.
Hysteresis curves of the finite element models: (a) specimen SL-1; (b) specimen SL-2; (c) specimen SL-3.

Figure 13.
Comparison of the failure processes of specimens SL-1 and SL-2 with finite element models: (a) FEM: Δ = 27 mm; (b) FEM: Δ = 63 mm; (c) test: Δ = 63 mm.
Figure 13.
Comparison of the failure processes of specimens SL-1 and SL-2 with finite element models: (a) FEM: Δ = 27 mm; (b) FEM: Δ = 63 mm; (c) test: Δ = 63 mm.

Figure 14.
Comparison of the failure process of specimen SL-3 with the finite element models: (a) FEM: Δ = 27 mm; (b) FEM: Δ = 45 mm; (c) test: Δ = 45 mm.
Figure 14.
Comparison of the failure process of specimen SL-3 with the finite element models: (a) FEM: Δ = 27 mm; (b) FEM: Δ = 45 mm; (c) test: Δ = 45 mm.

Figure 15.
Relationship between overstrength factor and length ratio.

Figure 16.
Relationships between overstrength factor and stiffener spacing: (a) Section H300 × 150 × 6 × 8; (b) Section H362 × 250 × 14 × 20.
Figure 16.
Relationships between overstrength factor and stiffener spacing: (a) Section H300 × 150 × 6 × 8; (b) Section H362 × 250 × 14 × 20.

Figure 17.
Relationships between overstrength factor and flange-to-web area ratio.

Figure 18.
Relationships between overstrength factor and flange strength.

Figure 19.
Relationships between overstrength factor and web depth-to-thickness ratio.

Figure 20.
Relationships between overstrength factor and stiffener thickness: (a) section H300 × 150 × 6 × 8; (b) section H362 × 250 × 14 × 20.
Figure 20.
Relationships between overstrength factor and stiffener thickness: (a) section H300 × 150 × 6 × 8; (b) section H362 × 250 × 14 × 20.


Table 1.
Composition of Q345 steel.
| Element | C | Mn | Si | P | S | Nb | V | Ti | Ni | Cr | Mo |
|---|---|---|---|---|---|---|---|---|---|---|---|
| Content | ≤0.20 | ≤1.70 | ≤0.50 | ≤0.35 | ≤0.35 | ≤0.07 | ≤0.15 | ≤0.20 | ≤0.012 | ≤0.30 | ≤0.10 |
Table 2.
Mechanical properties of steel plates used in the specimens.
| Part | Thickness t (mm) | Yield Strength fy (MPa) | Ultimate Tensile Strength fu (MPa) | Elastic Modulus Es (GPa) | Elongation δ (%) |
|---|---|---|---|---|---|
| Web | 6 | 356 | 535 | 203 | 21.7 |
| Flange | 8 | 361 | 547 | 206 | 22.2 |
| Stiffener | 10 | 368 | 552 | 208 | 23.3 |
Table 3.
Design parameters of the test specimens.
| Specimen | Length Ratio ρ | Section (mm) | Stiffener Spacing (mm) | Stiffener Configuration |
|---|---|---|---|---|
| SL-1 | 1.36 | 300 × 150 × 6 × 8 | 4@130 | Both sides |
| SL-2 | 1.36 | 300 × 150 × 6 × 8 | 4@130 | One side |
| SL-3 | 1.36 | 300 × 150 × 6 × 8 | 2@220 | Both sides |
Table 4.
Mechanical properties of the specimens.
| Specimen | Ultimate Shear Force Vu (kN) | Yield Shear Force Vp (kN) | Overstrength Factor | Inelastic Rotation | ||
|---|---|---|---|---|---|---|
| Test | Specification | Test | Specification | |||
| SL-1 | 560.02 | 350.85 | 1.60 | 1.50 | 0.10 | 0.08 |
| SL-2 | 556.20 | 350.85 | 1.59 | 1.50 | 0.10 | 0.08 |
| SL-3 | 517.73 | 350.85 | 1.48 | 1.50 | 0.07 | 0.08 |
Table 5.
Comparison of the mechanical properties.
| Specimen | Yield Shear Force Fy (kN) | Yield Displacement Δy (mm) | Ultimate Shear Force Fu (kN) | Overstrength Factor | Errors (%) | |
|---|---|---|---|---|---|---|
| SL-1 | Test | 340.97 340.97 | 8.93 9.10 | 560.02 564.31 | 1.59 1.60 | 0.71 |
| FEM | ||||||
| SL-2 | Test | 340.97 340.97 | 8.87 9.01 | 556.20 560.09 | 1.58 1.60 | 0.69 |
| FEM | ||||||
| SL-3 | Test | 340.97 340.97 | 8.72 8.93 | 518.73 525.40 | 1.49 1.51 | 1.29 |
| FEM | ||||||
Table 6.
Section properties for investigating effect of length ratio.
| Section (mm) | Length e (mm) | Length Ratio |
|---|---|---|
| H300 × 150 × 6 × 8 | 650, 670, 690, 710, 730, 750 | 1.36, 1.40, 1.45, 1.49, 1.53, 1.57 |
| H362 × 250 × 14 × 20 | 1080, 1110, 1140, 1170, 1200, 1230 | 1.36, 1.40, 1.44, 1.48, 1.51, 1.55 |
Table 7.
Section properties for investigating the effect of stiffener spacing.
| Section (mm) | Length e (mm) | ns |
|---|---|---|
| H300 × 150 × 6 × 8 | 650, 670, 690, 710, 730, 750 | 5 |
| 6 | ||
| H362 × 250 × 14 × 20 | 1080, 1110, 1140, 1170, 1200, 1230 | 5 |
| 6 |
Table 8.
Section properties for investigating the effect of flange-to-web area ratio.
| Section (mm) | bf (mm) | Af/Aw | Length e (mm) | ns |
|---|---|---|---|---|
| H300 × bf × 6 × 8 | 150, 170, 190, 210 | 1.41, 1.60, 1.78, 1.97 | 710, 730, 750 | 5 |
| H362 × bf × 14 × 20 | 230, 250, 270, 290 | 1.66, 1.71, 1.75, 1.77 | 1170, 1200, 1230 | 5 |
Table 9.
Section properties for investigating the effect of flange strength.
| Section (mm) | Length e (mm) | Flange Strength | ns |
|---|---|---|---|
| H300 × 150 × 6 × 8 | 650, 670, 690, 710, 730, 750 | Q235 Q345 | 5 |
| H362 × 250 × 14 × 20 | 1080, 1110, 1140, 1170, 1200, 1230 | Q235 Q345 | 5 |
Table 10.
Section properties for investigating the effect of web depth-to-thickness ratio.
| Section (mm) | Web Depth-to-Thickness Ratio | Length e (mm) | ns |
|---|---|---|---|
| 300 × 150 × 6 × 8 260 × 150 × 7 × 8 229 × 150 × 8 × 8 | 47.33 34.87 26.63 | 650, 690, 730, 750 | 5 |
| 362 × 250 × 14 × 20 340 × 250 × 15 × 20 322 × 250 × 16 × 20 | 23.00 20.00 17.63 | 1080, 1140, 1200, 1230 | 5 |
Table 11.
Section properties for investigating the effect of stiffener thickness.
| Section (mm) | ts (mm) | Length e (mm) | ns |
|---|---|---|---|
| H300 × 150 × 6 × 8 | 6, 8, 10 | 650, 690, 730, 750 | 5 |
| H362 × 250 × 14 × 20 | 14, 12, 10 | 1080, 1140, 1200, 1230 | 5 |
Disclaimer/Publisher’s Note: The statements, opinions and data contained in all publications are solely those of the individual author(s) and contributor(s) and not of MDPI and/or the editor(s). MDPI and/or the editor(s) disclaim responsibility for any injury to people or property resulting from any ideas, methods, instructions or products referred to in the content. |
© 2024 by the authors. Licensee MDPI, Basel, Switzerland. This article is an open access article distributed under the terms and conditions of the Creative Commons Attribution (CC BY) license (https://creativecommons.org/licenses/by/4.0/).
Share and Cite
MDPI and ACS Style
Hu, S.; Liu, S.; Zeng, S.; Shao, T. Mechanical Properties and Influence Factors of Ordinary Shear Links. Buildings 2024, 14, 160. https://doi.org/10.3390/buildings14010160
AMA Style
Hu S, Liu S, Zeng S, Shao T. Mechanical Properties and Influence Factors of Ordinary Shear Links. Buildings. 2024; 14(1):160. https://doi.org/10.3390/buildings14010160
Chicago/Turabian StyleHu, Shujun, Shangwen Liu, Sizhi Zeng, and Tiefeng Shao. 2024. "Mechanical Properties and Influence Factors of Ordinary Shear Links" Buildings 14, no. 1: 160. https://doi.org/10.3390/buildings14010160
Note that from the first issue of 2016, this journal uses article numbers instead of page numbers. See further details here.