

Possible Approaches to Studying the Influence of Magnetic Fields and Mechanical Effects on the Physicochemical Properties of Aqueous IgG Colloids


 ,
,  , , , and
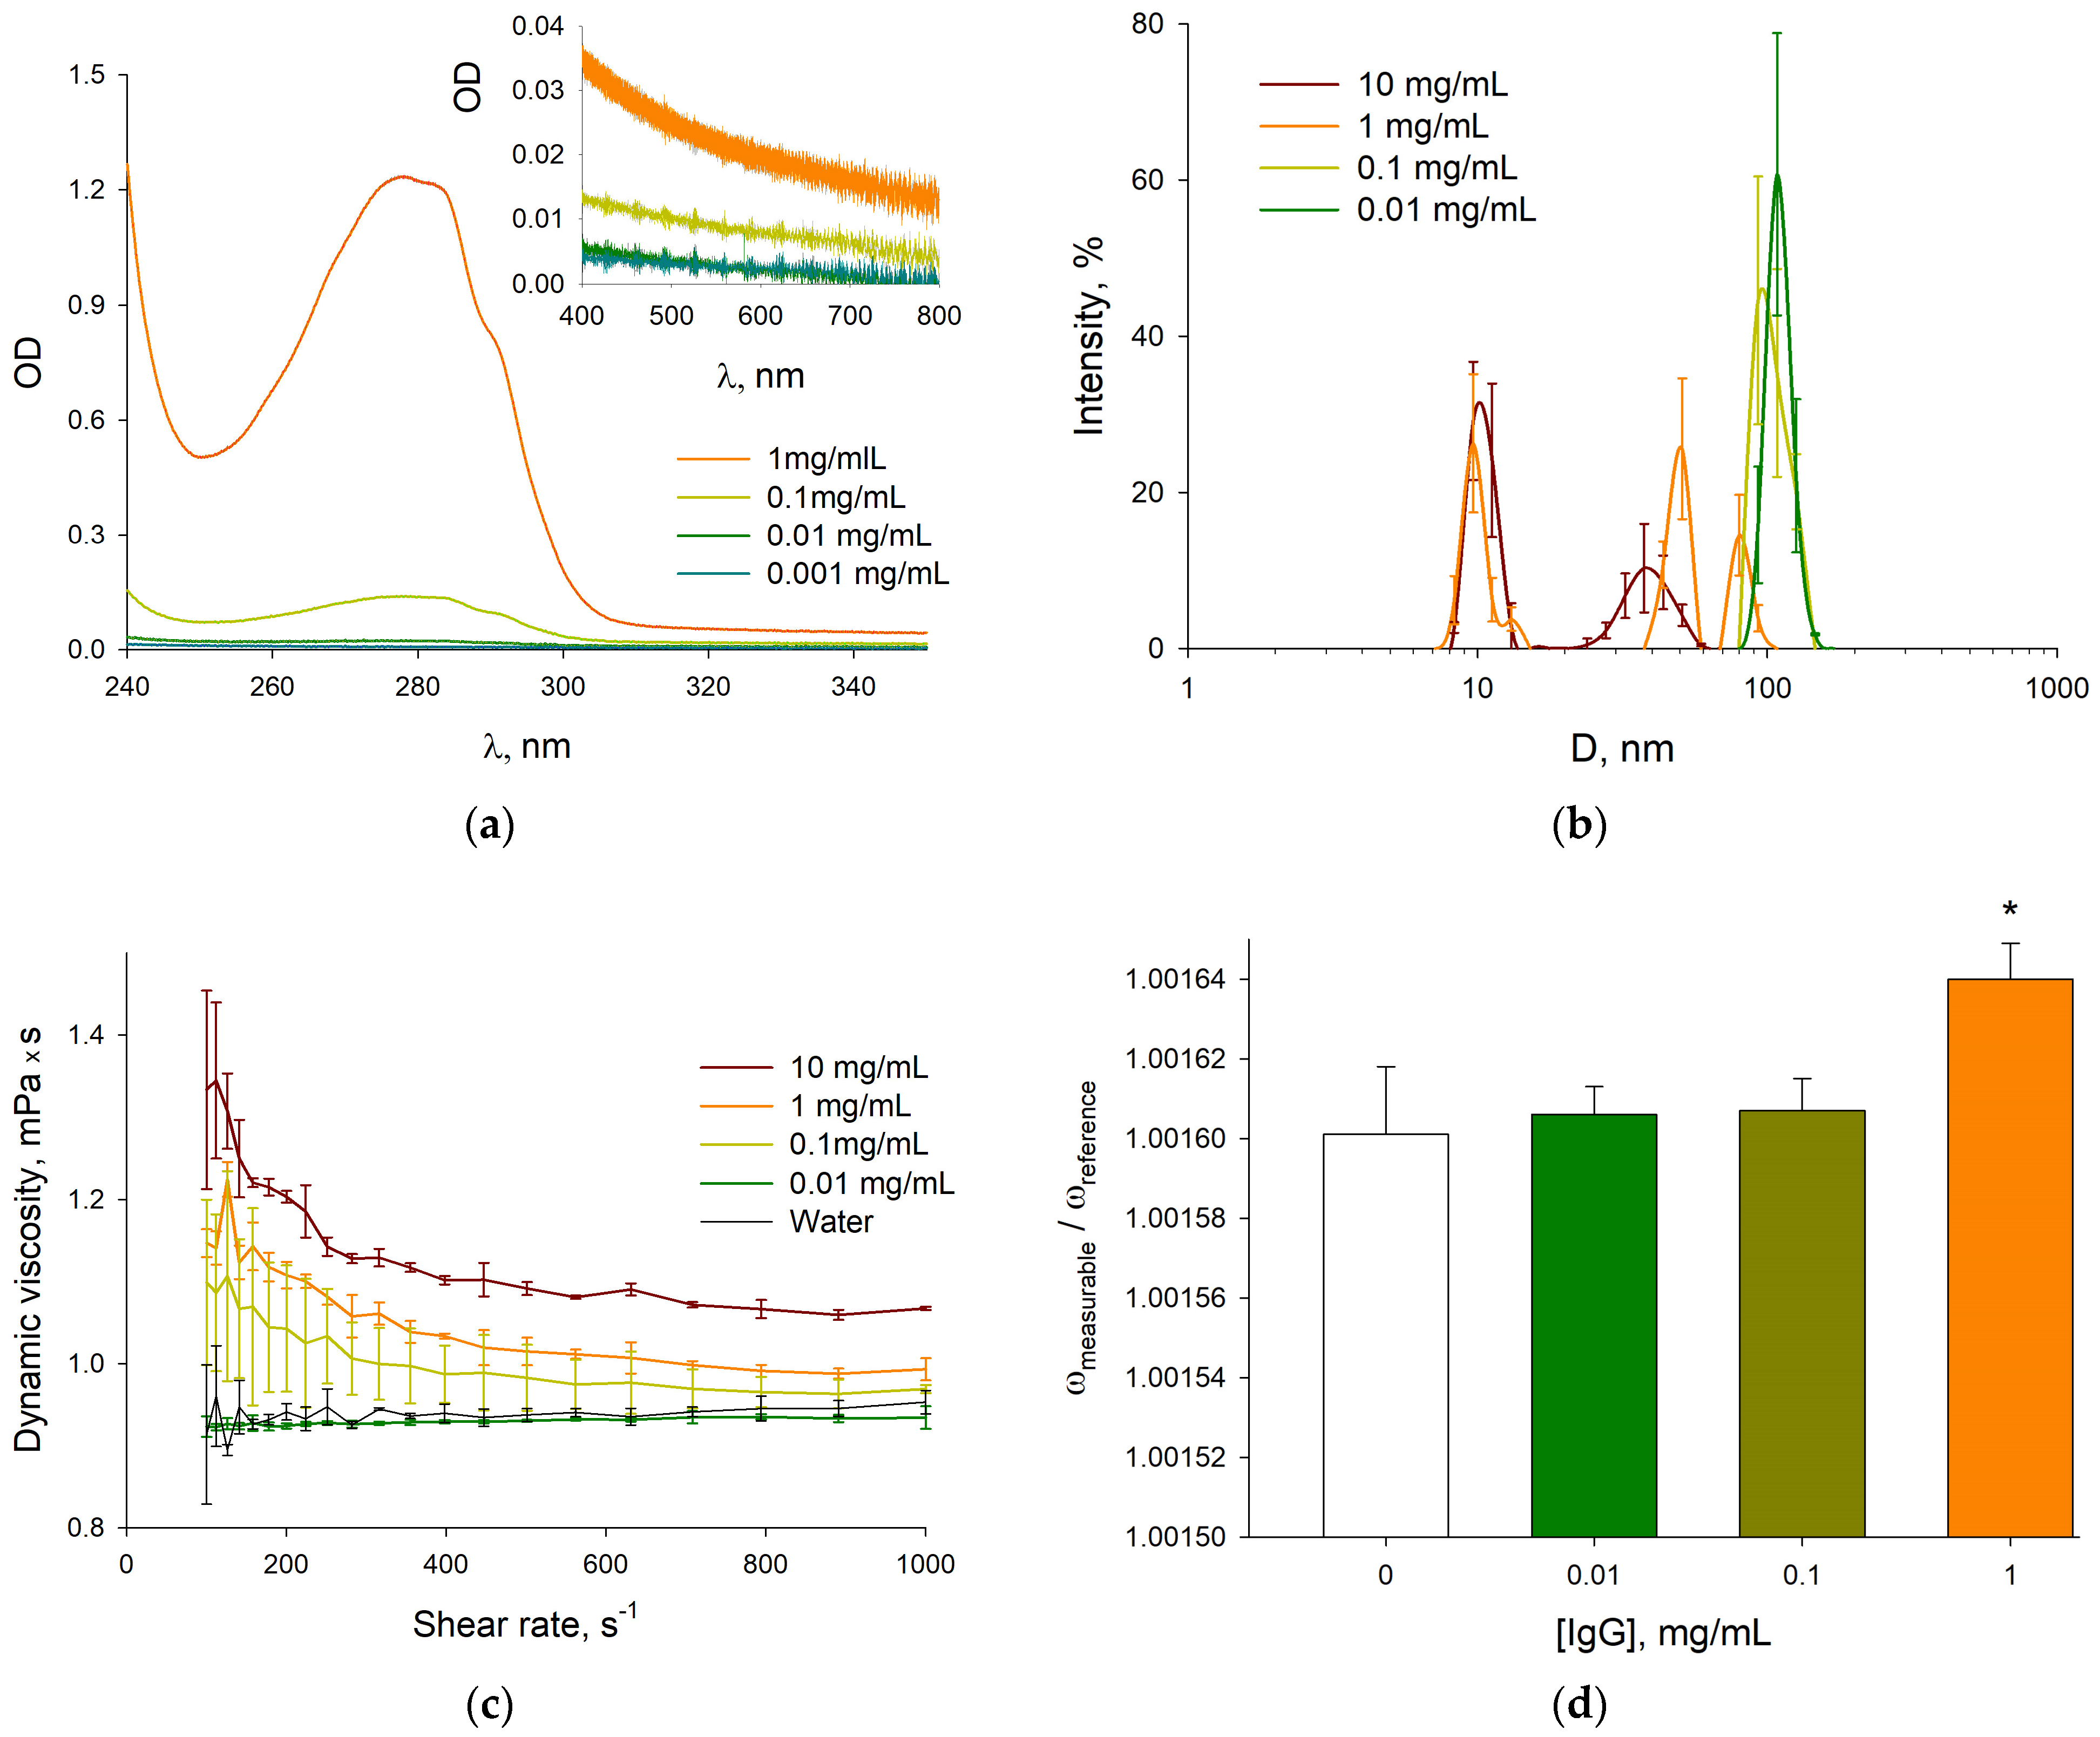
Abstract
:1. Introduction
2. Materials and Methods
2.1. Aqueous Immunoglobulin G Colloids
2.2. Potentiometric Measurements
2.3. Optical Methods
2.4. Ultrasonic Spectroscopy
2.5. Dynamic Viscosity Measurement
2.6. Mechanical Vibration Effect
2.7. Exposure to Magnetic Fields
- Vertical axis: alternating magnetic field induction of 55 µT at a frequency of 8 Hz, and a constant MF of 0 µT (residual field < 20 nT). All other axes are 0 µT, both in constant MF and in alternating.
- Vertical axis: alternating magnetic field induction of 55 µT at a frequency of 50 Hz, and a constant MF of 0 µT. All other axes are 0 µT, both in constant MF and in alternating.
2.8. Statistic Calculations
3. Results and Discussion
3.1. Study of the Physicochemical Properties of Aqueous IgG Colloid of Different Concentrations
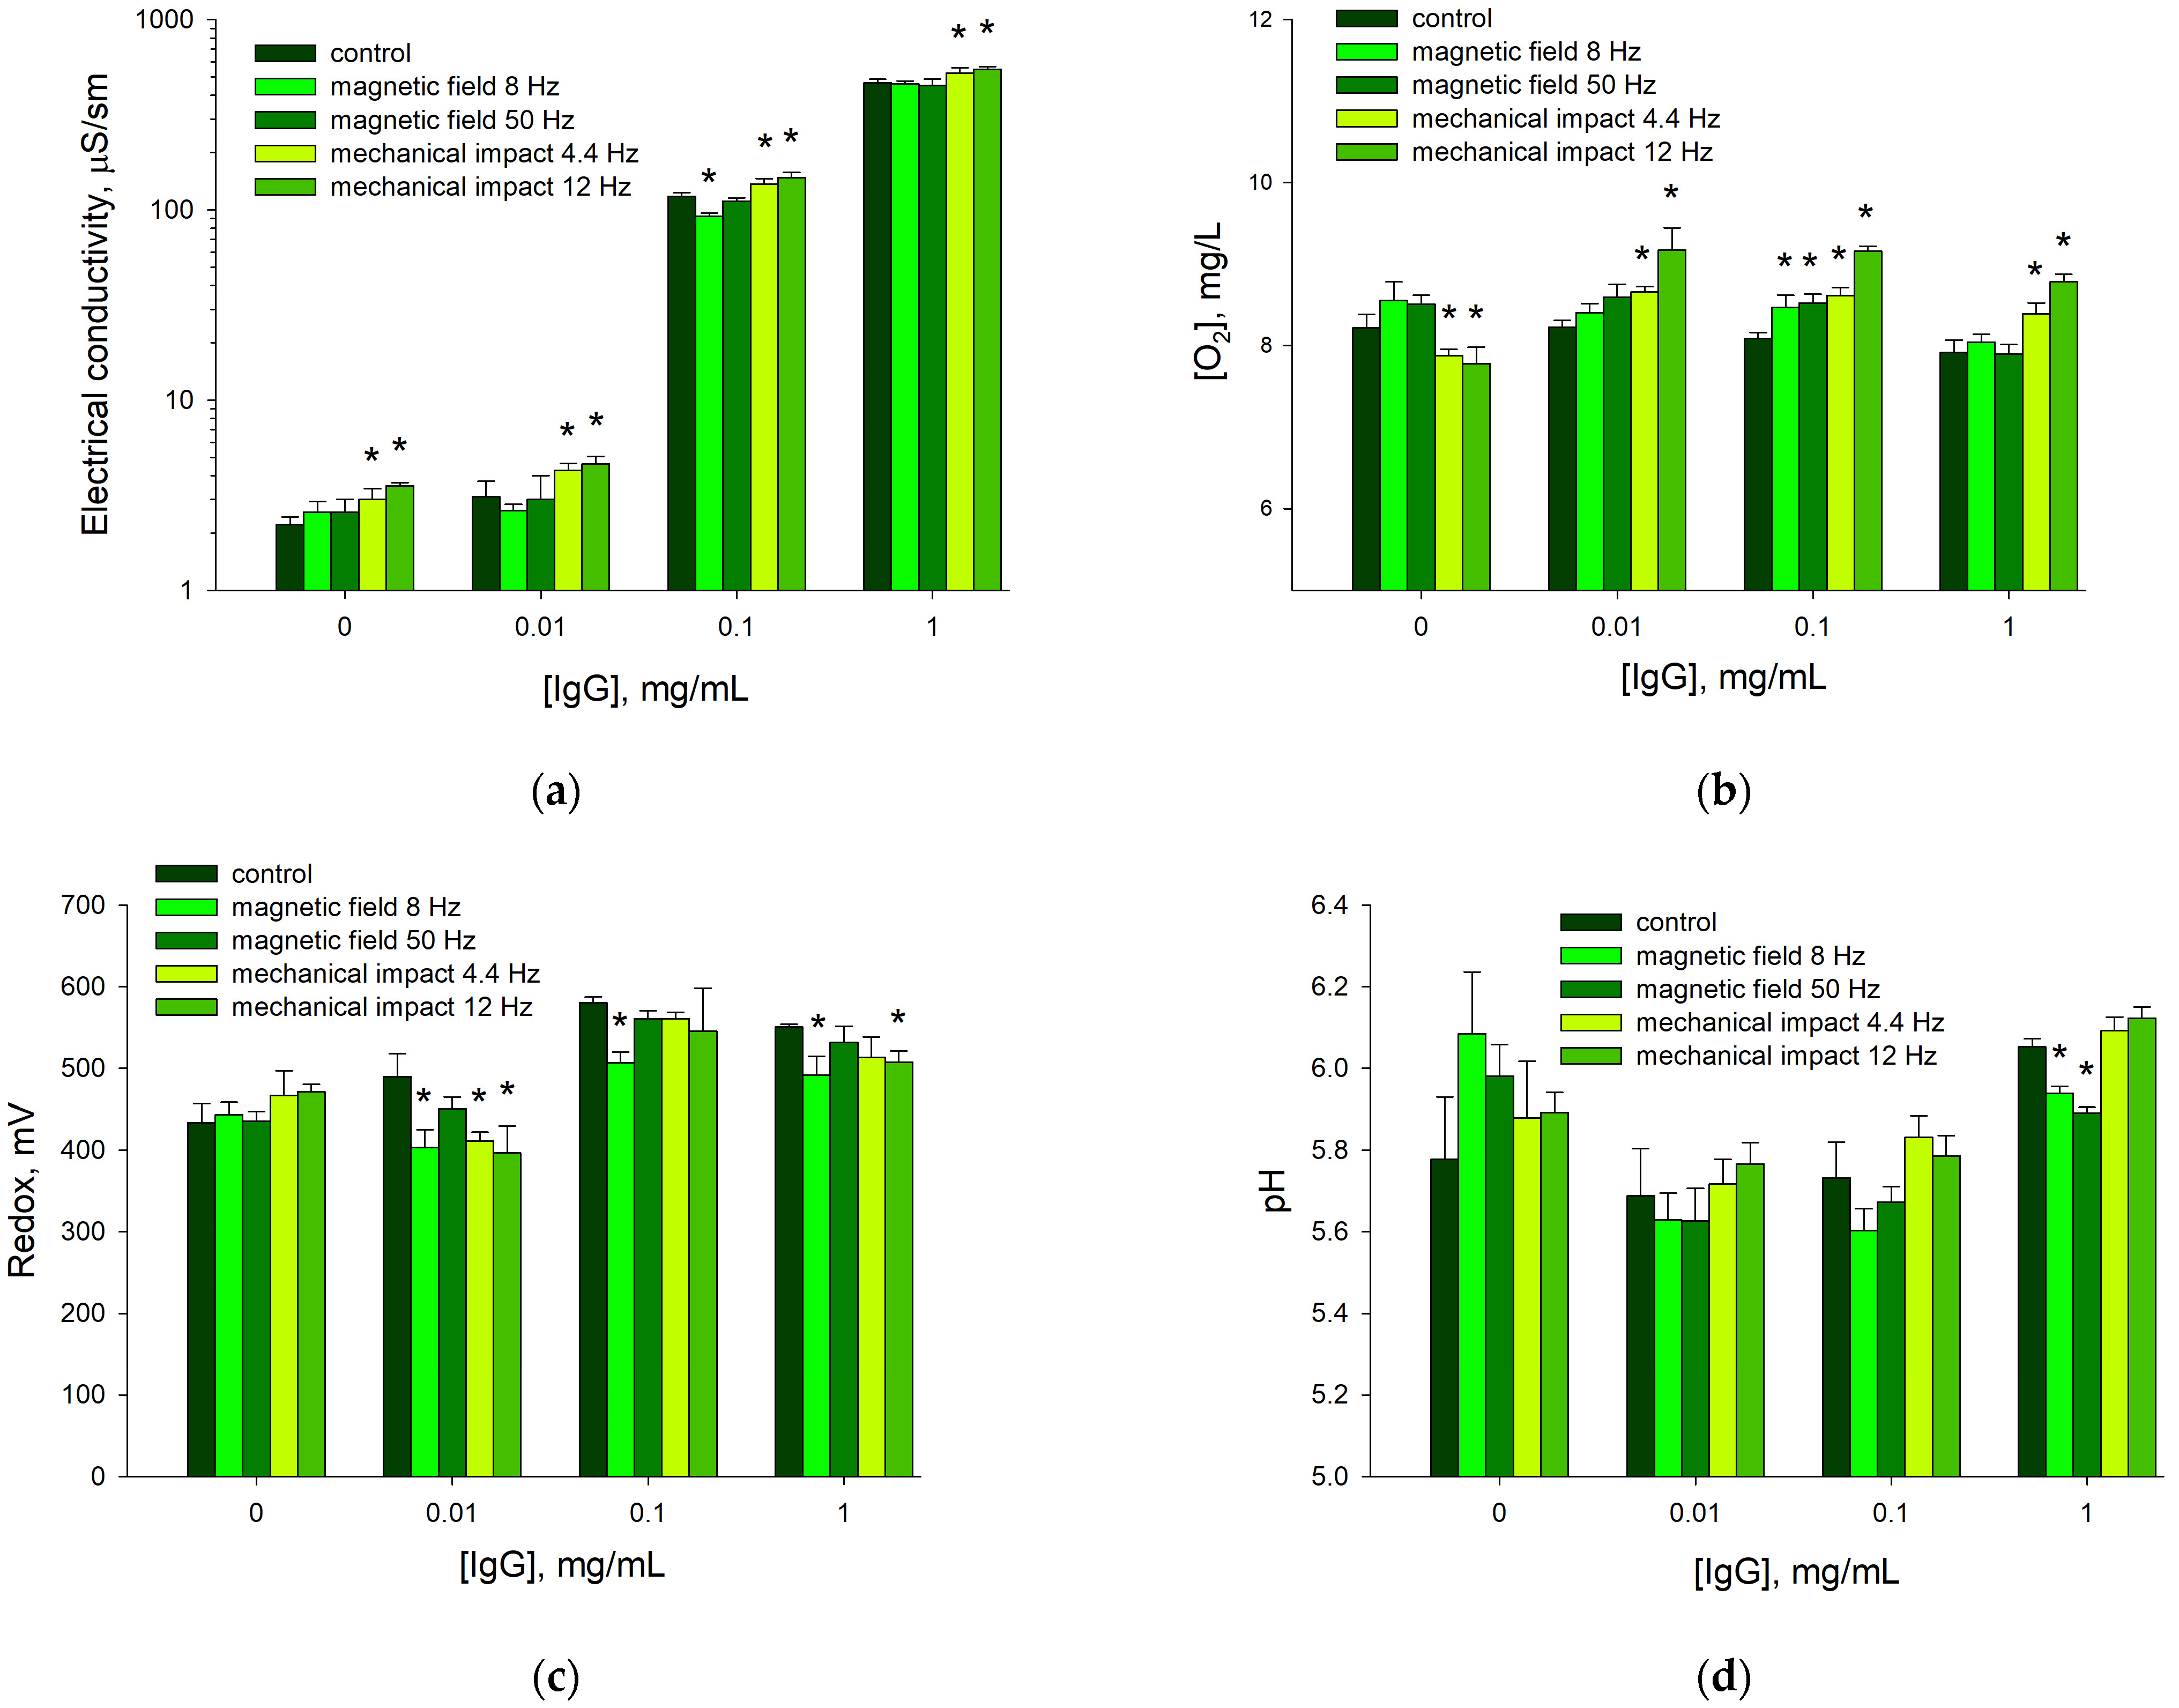
3.2. Influence of Magnetic Field and Mechanical Action on the Physicochemical Properties of Aqueous IgG Colloids
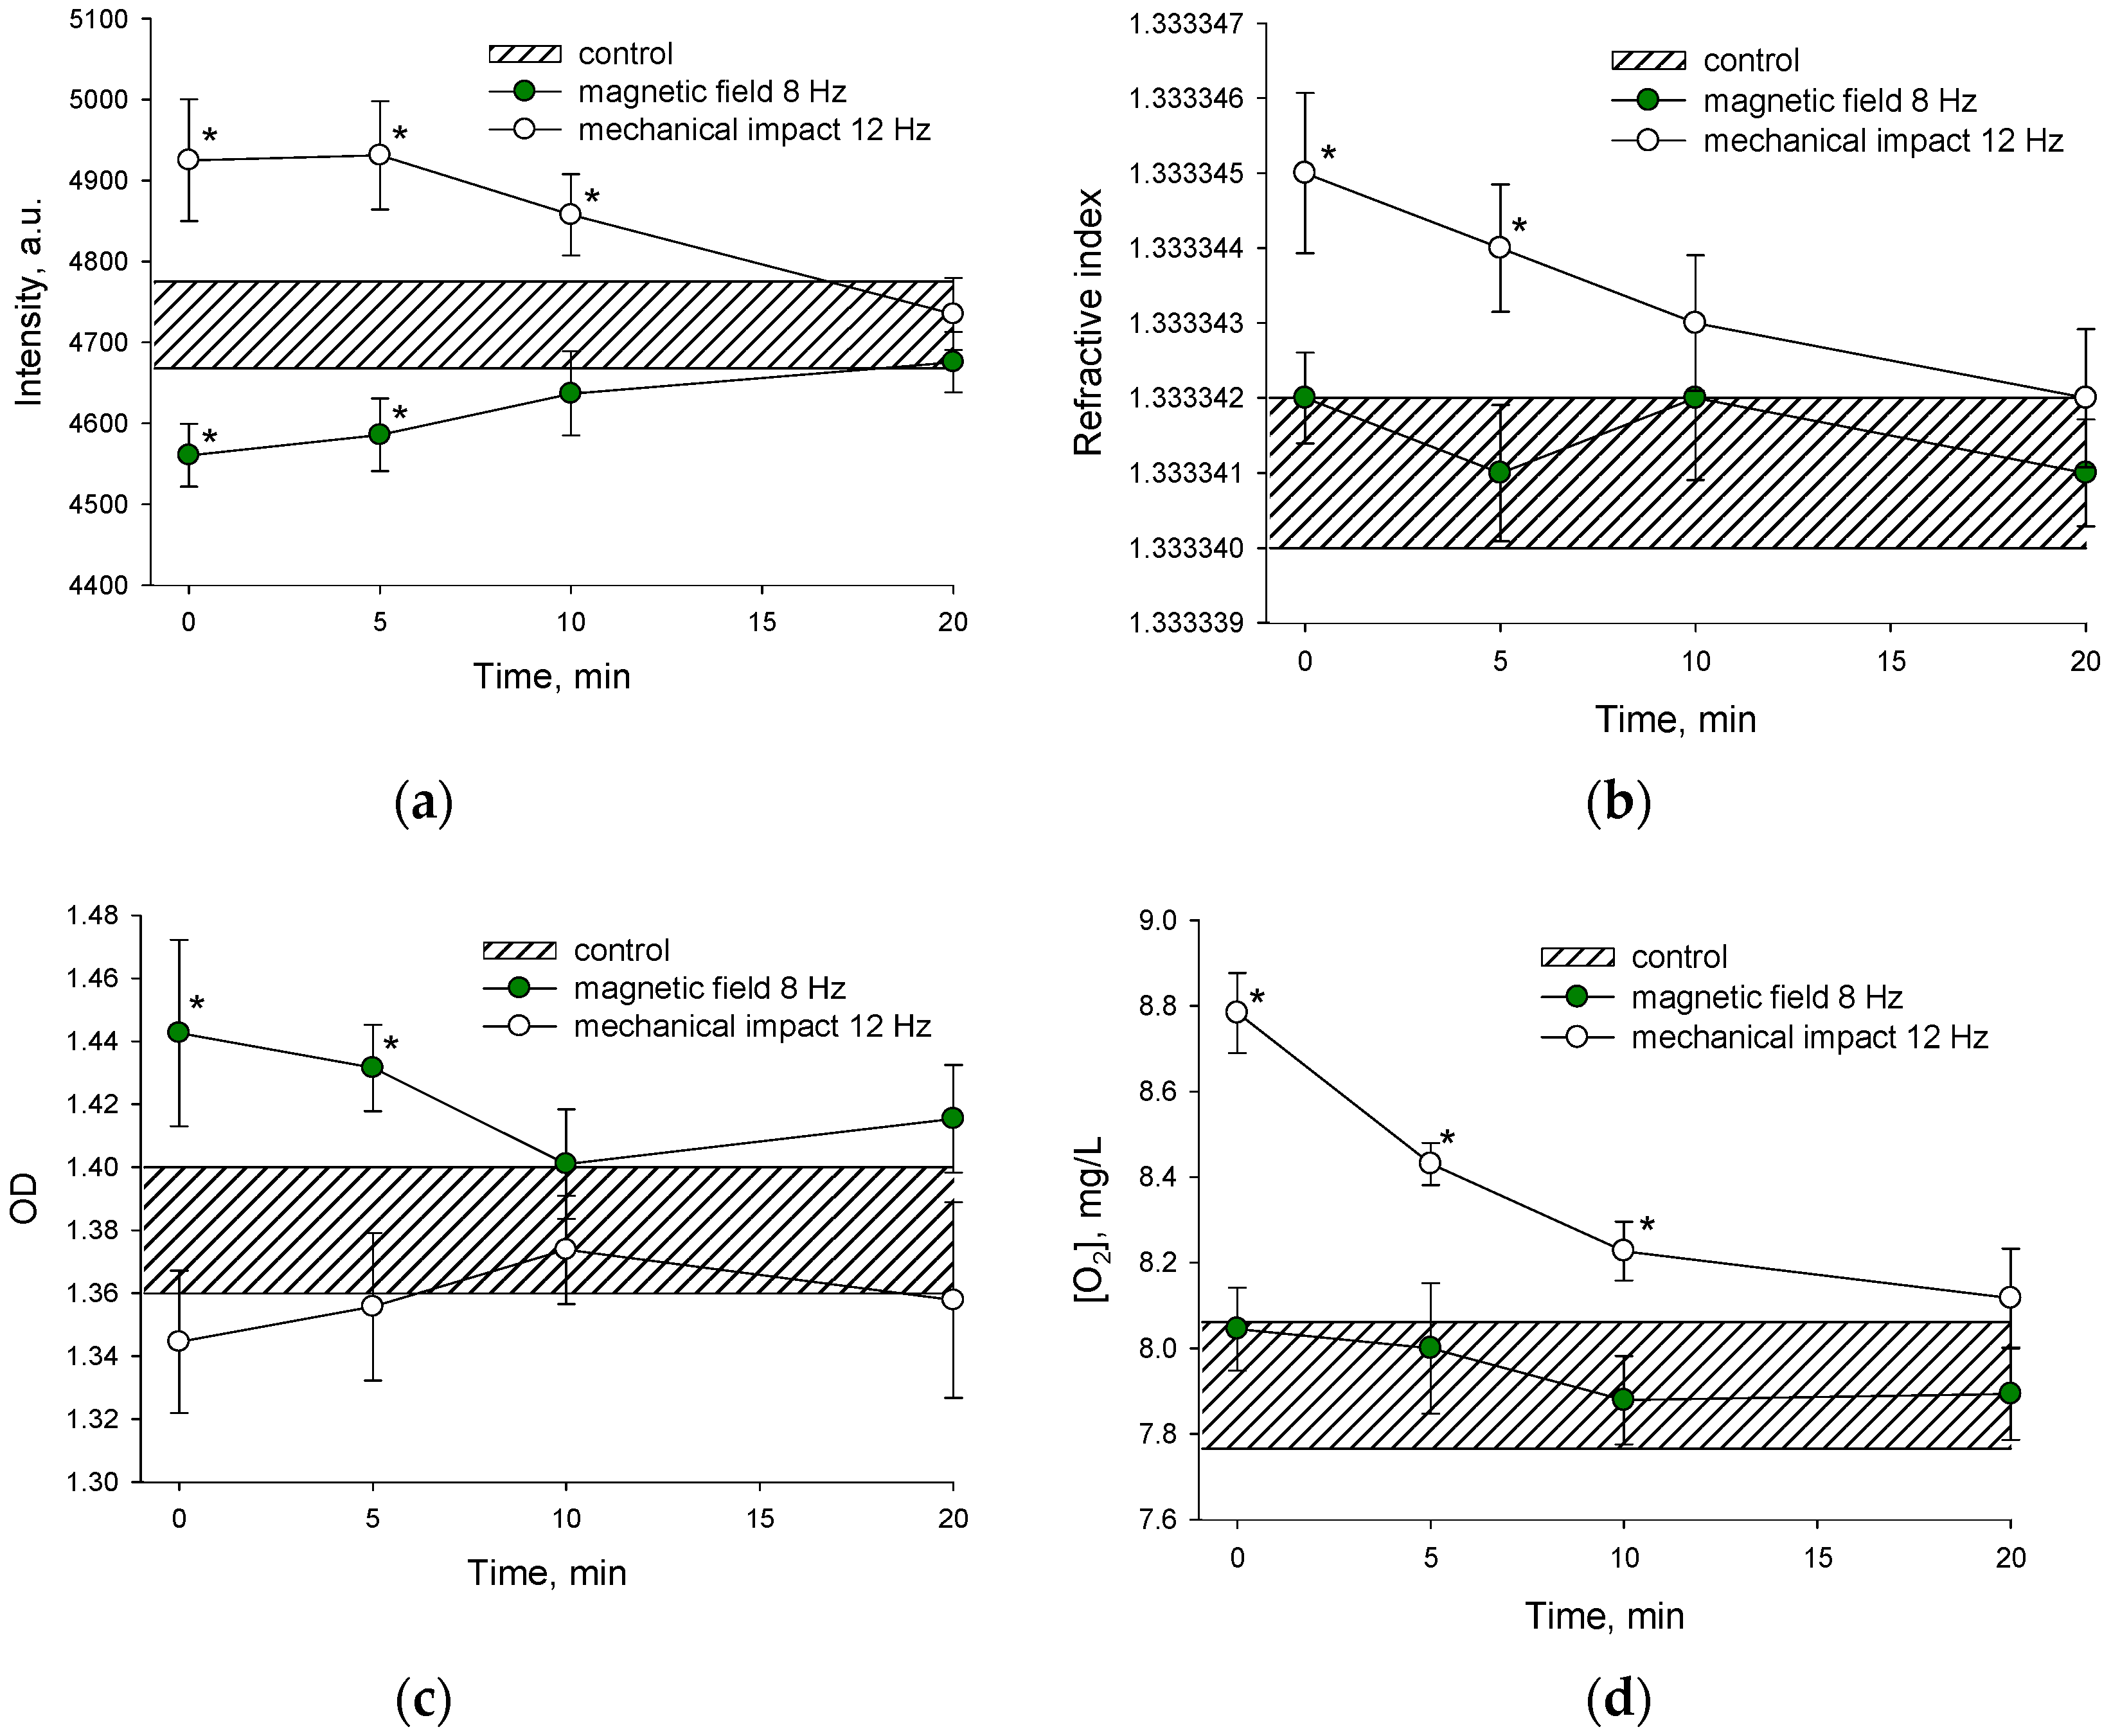
3.3. Duration of Changes in the Physicochemical Properties of Aqueous IgG Colloids after Exposure to a Magnetic Field and Mechanical Impact
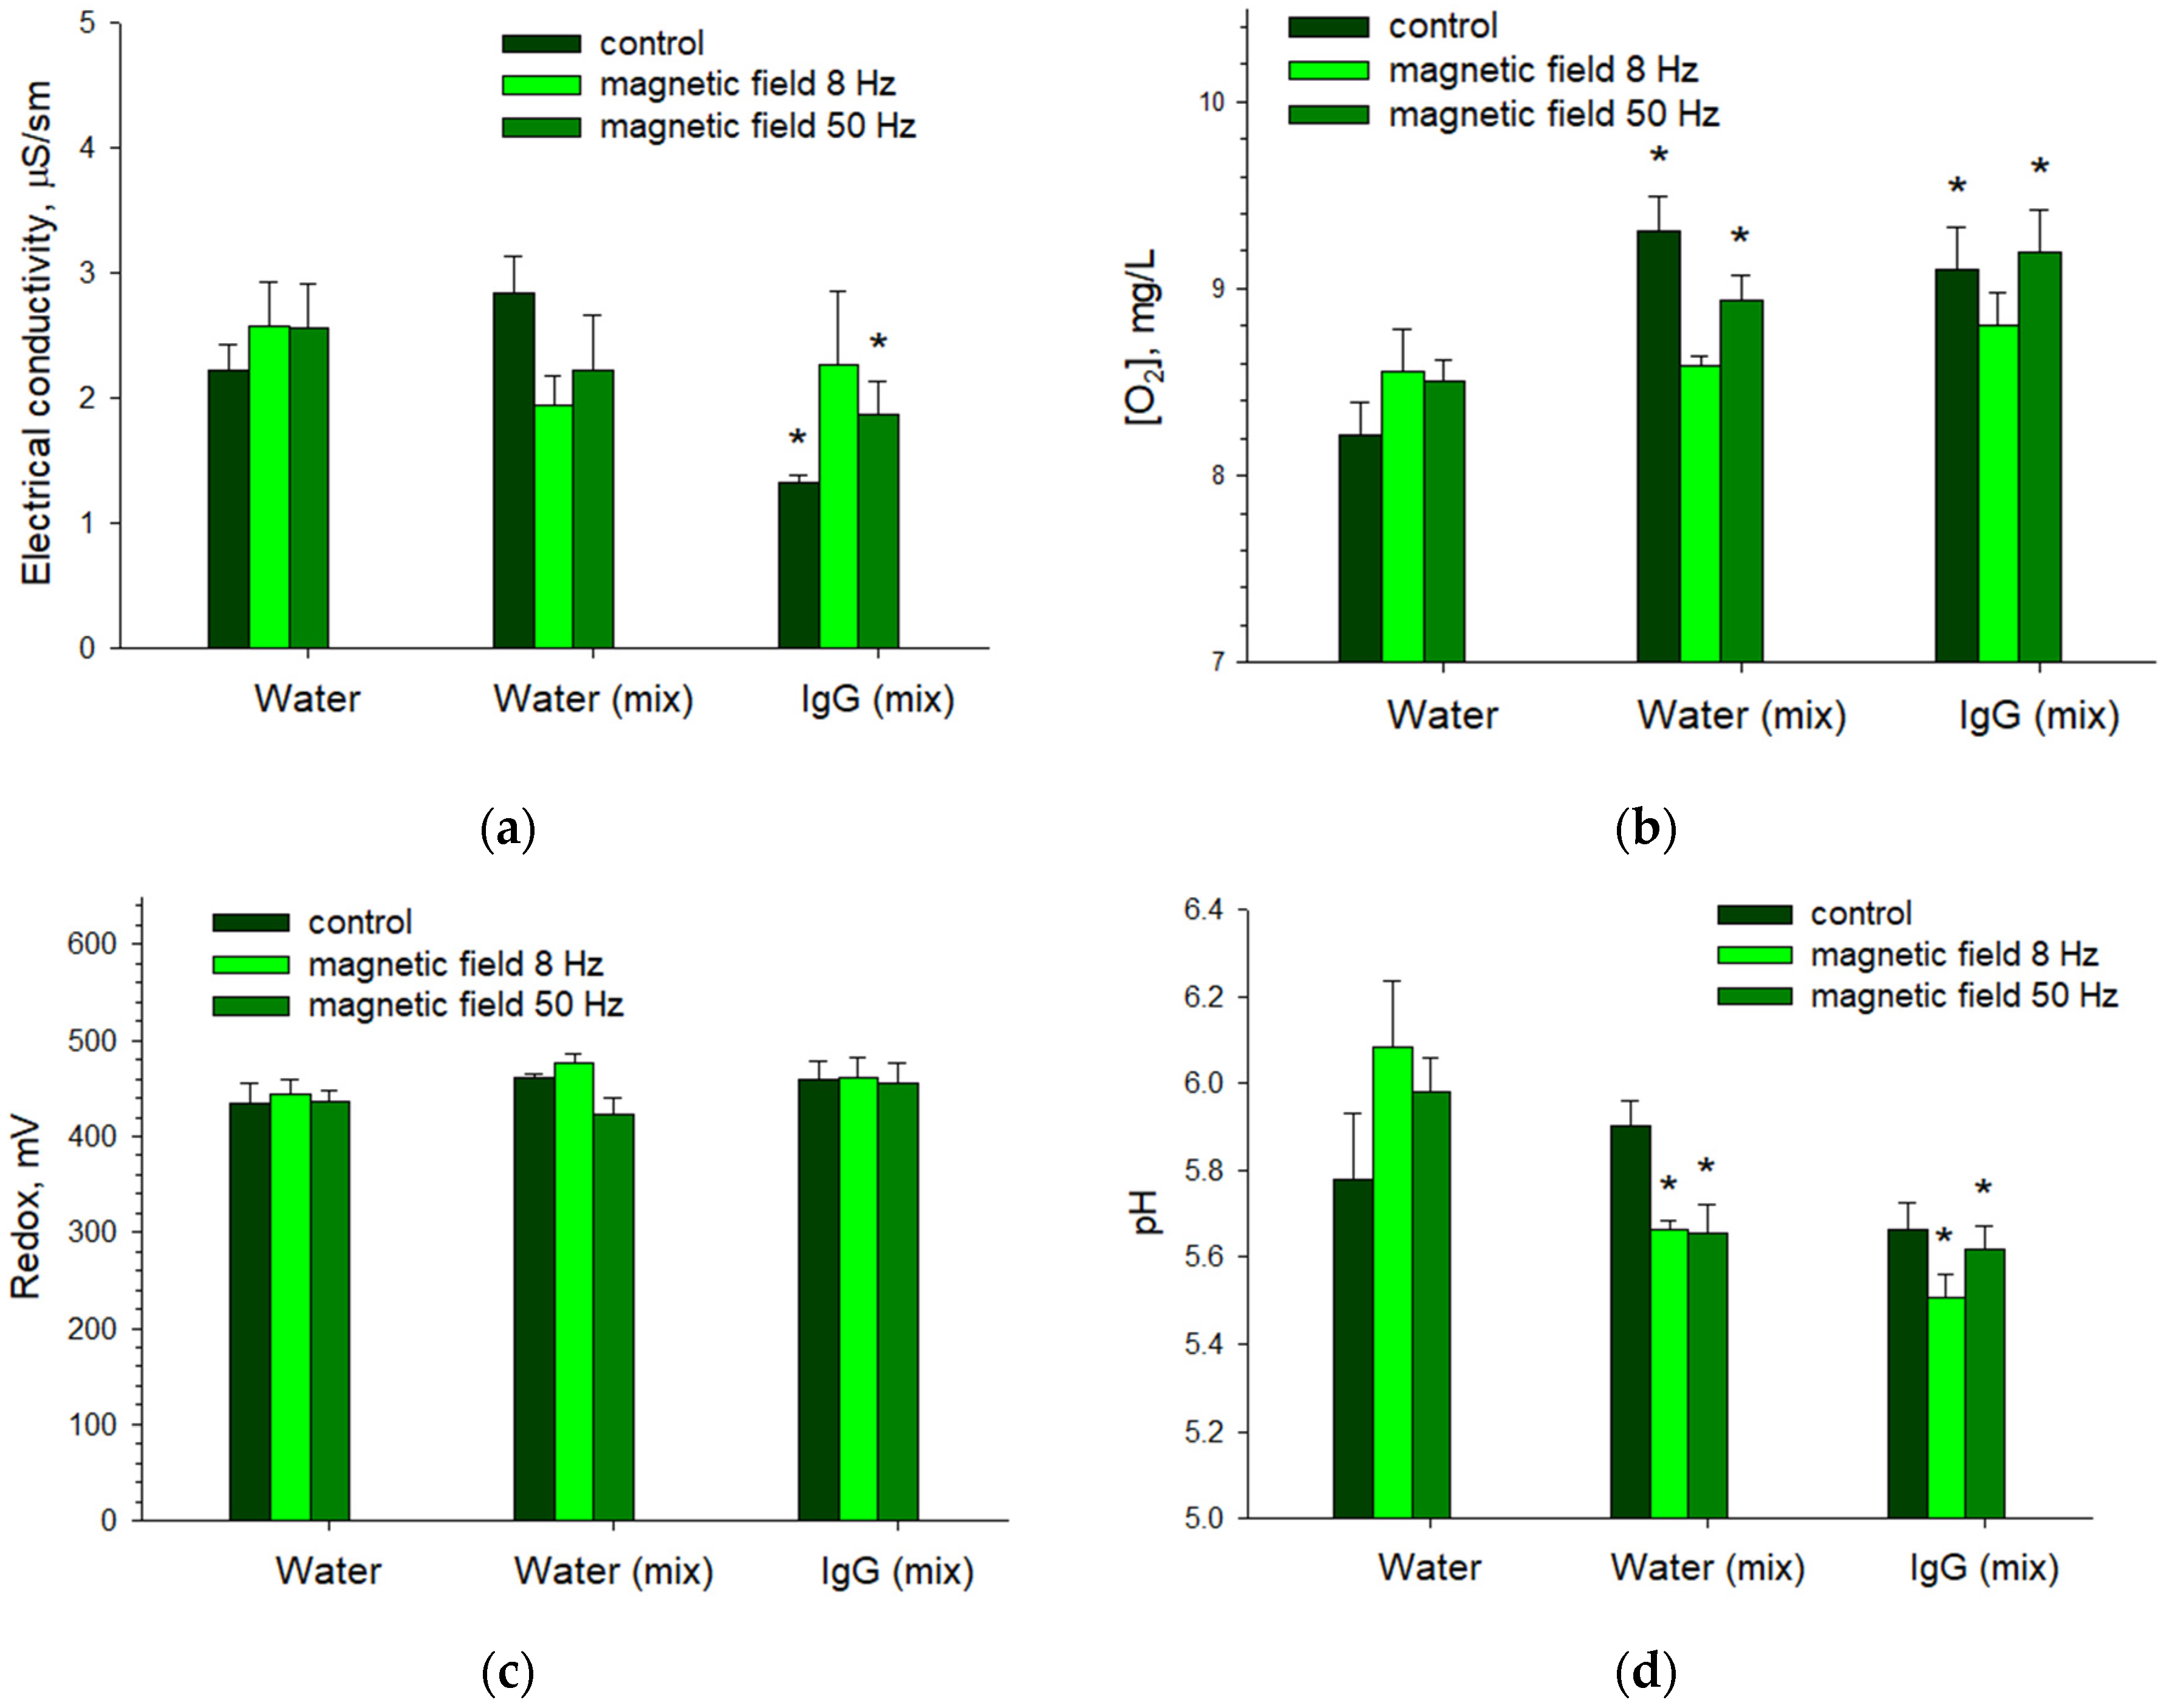
3.4. Influence of Magnetic Field and Mechanical Action by Pipettingon the Physicochemical Properties of Water
Supplementary Materials
Author Contributions
Funding
Institutional Review Board Statement
Informed Consent Statement
Data Availability Statement
Acknowledgments
Conflicts of Interest
Appendix A

References
- Aszmann, O.C. The life and work of Theodore Schwann. J. Reconstr. Microsurg. 2000, 16, 291–295. [Google Scholar] [CrossRef]
- Maksimenko, A.V. Approximation of new generation pharmacological enzyme researches to clinical practice. Russ. Cardiol. Bull. 2018, 13, 41–49. [Google Scholar] [CrossRef]
- Caldevilla, R.; Morais, S.L.; Cruz, A.; Delerue-Matos, C.; Moreira, F.; Pacheco, J.G.; Santos, M.; Barroso, M.F. Electrochemical Chemically Based Sensors and Emerging Enzymatic Biosensors for Antidepressant Drug Detection: A Review. Int. J. Mol. Sci. 2023, 24, 8480. [Google Scholar] [CrossRef] [PubMed]
- Ioannou, E.; Labrou, N.E. Development of Enzyme-Based Cosmeceuticals: Studies on the Proteolytic Activity of Arthrospira platensis and Its Efficient Incorporation in a Hydrogel Formulation. Cosmetics 2022, 9, 106. [Google Scholar] [CrossRef]
- Hamid, B.; Bashir, Z.; Yatoo, A.M.; Mohiddin, F.; Majeed, N.; Bansal, M.; Poczai, P.; Almalki, W.H.; Sayyed, R.Z.; Shati, A.A.; et al. Cold-Active Enzymes and Their Potential Industrial Applications—A Review. Molecules 2022, 27, 5885. [Google Scholar] [CrossRef] [PubMed]
- Castañeda Ruiz, A.J.; Shetab Boushehri, M.A.; Phan, T.; Carle, S.; Garidel, P.; Buske, J.; Lamprecht, A. Alternative Excipients for Protein Stabilization in Protein Therapeutics: Overcoming the Limitations of Polysorbates. Pharmaceutics 2022, 14, 2575. [Google Scholar] [CrossRef] [PubMed]
- Mozhaeva, V.; Kudryavtsev, D.; Prokhorov, K.; Utkin, Y.; Garnov, S.V.; Kasheverov, I.; Tsetlin, V. Toxins’ classification through Raman spectroscopy with principal component analysis. Spectrochim. Acta Part A 2022, 278, 121276. [Google Scholar] [CrossRef]
- Mukhina, I.V.; Kazantsev, V.B.; Khaspeckov, L.G.; Zakharov, Y.N.; Vedunova, M.V.; Mitroshina, E.V.; Korotchenko, S.A.; Koryagina, E.A. Multielectrode Matrices—New Possibilities in Investigation of the Neuronal Network Plasticity. Sovrem. Tehnol. V Med. 2009, 1, 8–15. [Google Scholar]
- Vedunova, M.B.; Mishchenko, T.A.; Mitroshina, E.V.; Ponomareva, N.V.; Yudintsev, A.V.; Generalova, A.N.; Deyev, S.M.; Mukhina, I.V.; Semyanov, A.V.; Zvyagin, A.V. Cytotoxic effects of upconversion nanoparticles in primary hippocampal cultures. RSC Adv. 2016, 6, 33656–33665. [Google Scholar] [CrossRef]
- Jao, D.; Xue, Y.; Medina, J.; Hu, X. Protein-Based Drug-Delivery Materials. Materials 2017, 10, 517. [Google Scholar] [CrossRef]
- Zhang, H.; Zhang, Y.; Zhang, C.; Yu, H.; Ma, Y.; Li, Z.; Shi, N. Recent Advances of Cell-Penetrating Peptides and Their Application as Vectors for Delivery of Peptide and Protein-Based Cargo Molecules. Pharmaceutics 2023, 15, 2093. [Google Scholar] [CrossRef] [PubMed]
- Cui, J.; Wen, Z.; Zhang, W.; Wu, W. Recent Advances in Oral Peptide or Protein-Based Drug Liposomes. Pharmaceuticals 2022, 15, 1072. [Google Scholar] [CrossRef] [PubMed]
- Mitroshina, E.V.; Mishchenko, T.A.; Usenko, A.V.; Epifanova, E.A.; Yarkov, R.S.; Gavrish, M.S.; Babaev, A.A.; Vedunova, M.V. AAV-Syn-BDNF-EGFP Virus Construct Exerts Neuroprotective Action on the Hippocampal Neural Network during Hypoxia In Vitro. Int. J. Mol. Sci. 2018, 19, 2295. [Google Scholar] [CrossRef] [PubMed]
- State Pharmacopoeia of the Russian Federation XV edition. General Pharmacopoeial Article “Biological Medicinal Products Obtained on the Basis of Gradual Technology” (OFS.1.7.00001). Available online: https://pharmacopoeia.regmed.ru/pharmacopoeia/izdanie-15/1/1-9/biologicheskie-lekarstvennye-preparaty-poluchennye-na-osnove-gradualnoy-tekhnologii/ (accessed on 6 December 2023).
- Epstein, O. The Supramolecular Matrix Concept. Symmetry 2023, 15, 1914. [Google Scholar] [CrossRef]
- Epstein, O. The Spatial Homeostasis Hypothesis. Symmetry 2018, 10, 103. [Google Scholar] [CrossRef]
- Goncharov, R.G.; Rogov, K.A.; Temnov, A.A.; Novoselov, V.I.; Sharapov, M.G. Protective role of exogenous recombinant peroxiredoxin 6 under ischemia-reperfusion injury of kidney. Cell Tissue Res. 2019, 378, 319–332. [Google Scholar] [CrossRef] [PubMed]
- Sharapov, M.; Novoselov, V.; Samygina, V.; Konarev, P.; Molochkov, A.; Sekirin, A.; Balkanov, A.; Gudkov, S. A chimeric recombinant protein with peroxidase and superoxide dismutase activities: Physico-chemical characterization and applicability to neutralize oxidative stress caused by ionizing radiation. Biochem. Eng. J. 2020, 159, 107603. [Google Scholar] [CrossRef]
- Palomares, L.A.; Estrada-Moncada, S.; Ramírez, O.T. Production of Recombinant Proteins. In Recombinant Gene Expression. Methods in Molecular Biology; Balbás, P., Lorence, A., Eds.; Humana Press: Totowa, NJ, USA, 2004; Volume 267, pp. 15–51. [Google Scholar] [CrossRef]
- Neurath, H.; Bull, H.B. The Surface Activity of Proteins. Chem. Rev. 1938, 23, 391–435. [Google Scholar] [CrossRef]
- Chamorro, J.R.; McQueen, T.M.; Tran, T.T. Chemistry of Quantum Spin Liquids. Chem. Rev. 2021, 121, 2898–2934. [Google Scholar] [CrossRef]
- Sarimov, R.M.; Serov, D.A.; Gudkov, S.V. Biological effects of magnetic storms and ELF magnetic fields. Biology 2023, 12. accepted manuscript. [Google Scholar]
- Sarimov, R.M.; Serov, D.A.; Gudkov, S.V. Hypomagnetic conditions and their biological action (Review). Biology 2023, 12. accepted manuscript. [Google Scholar]
- Baymler, I.V.; Gudkov, S.V.; Sarimov, R.M.; Simakin, A.V.; Shcherbakov, I.A. Concentration Dependences of Molecular Oxygen and Hydrogen in Aqueous Solutions. Dokl. Phys. 2020, 65, 5–7. [Google Scholar] [CrossRef]
- Shcherbakov, I.A.; Baimler, I.V.; Lyakhov, G.A.; Mikhailova, G.N.; Pustovoy, V.I.; Sarimov, R.M.; Simakin, A.V.; Troitsky, A.V. Influence of a Constant Magnetic Field on Some Properties of Water Solutions. Dokl. Phys. 2020, 65, 273–275. [Google Scholar] [CrossRef]
- Gudkov, S.V.; Simakin, A.V.; Bunkin, N.F.; Shafeev, G.A.; Astashev, M.E.; Glinushkin, A.P.; Grinberg, M.A.; Vodeneev, V.A. Development and application of photoconversion fluoropolymer films for greenhouses located at high or polar latitudes. J. Photochem. Photobiol. B Biol. 2020, 213, 112056. [Google Scholar] [CrossRef] [PubMed]
- Shkirin, A.V.; Ignatenko, D.N.; Chirikov, S.N.; Vorobev, A.V. Application of Laser Polarimetric Scatterometry in the Study of Water-Based Multicomponent Bioorganic Systems on the Example of Cow Milk. Phys. Wave Phenom. 2022, 30, 186–195. [Google Scholar] [CrossRef]
- Yanykin, D.V.; Astashev, M.E.; Khorobrykh, A.A.; Paskhin, M.O.; Serov, D.A.; Gudkov, S.V. Application of Fixed-Length Ultrasonic Interferometry to Determine the Kinetics of Light-/Heat-Induced Damage to Biological Membranes and Protein Complexes. Inventions 2022, 7, 87. [Google Scholar] [CrossRef]
- Gudkov, S.V.; Simakin, A.V.; Sarimov, R.M.; Kurilov, A.D.; Chausov, D.N. Novel Biocompatible with Animal Cells Composite Material Based on Organosilicon Polymers and Fullerenes with Light-Induced Bacteriostatic Properties. Nanomaterials 2021, 11, 2804. [Google Scholar] [CrossRef] [PubMed]
- Astashev, M.E.; Serov, D.A.; Sarimov, R.M.; Gudkov, S.V. Influence of the Vibration Impact Mode on the Spontaneous Chemiluminescence of Aqueous Protein Solutions. Phys. Wave Phenom. 2023, 31, 189–199. [Google Scholar] [CrossRef]
- Masi, A.; Cicchi, R.; Carloni, A.; Pavone, F.S.; Arcangeli, A. Optical Methods in the Study of Protein-Protein Interactions. In Integrins and Ion Channels. Advances in Experimental Medicine and Biology; Becchetti, A., Arcangeli, A., Eds.; Springer: New York, NY, USA, 2010; Volume 674. [Google Scholar] [CrossRef]
- Sarimov, R.M.; Binhi, V.N.; Matveeva, T.A.; Penkov, N.V.; Gudkov, S.V. Unfolding and Aggregation of Lysozyme under the Combined Action of Dithiothreitol and Guanidine Hydrochloride: Optical Studies. Int. J. Mol. Sci. 2021, 22, 2710. [Google Scholar] [CrossRef]
- Sarimov, R.M.; Nagaev, E.I.; Matveyeva, T.A.; Binhi, V.N.; Burmistrov, D.E.; Serov, D.A.; Astashev, M.E.; Simakin, A.V.; Uvarov, O.V.; Khabatova, V.V.; et al. Investigation of Aggregation and Disaggregation of Self-Assembling Nano-Sized Clusters Consisting of Individual Iron Oxide Nanoparticles upon Interaction with HEWL Protein Molecules. Nanomaterials 2022, 12, 3960. [Google Scholar] [CrossRef]
- Tan, Y.H.; Liu, M.; Nolting, B.; Go, J.G.; Gervay-Hague, J.; Liu, G. A Nanoengineering Approach for Investigation and Regulation of Protein Immobilization. ACS Nano 2008, 2, 2374–2384. [Google Scholar] [CrossRef] [PubMed]
- Wong, K.S.; Chew, N.S.L.; Low, M.; Tan, M.K. Plasma-Activated Water: Physicochemical Properties, Generation Techniques, and Applications. Processes 2023, 11, 2213. [Google Scholar] [CrossRef]
- Bunkin, N.F.; Bunkin, F.V. Bubston structure of water and electrolyte aqueous solutions. Phys. Uspekhi 2016, 59, 846. [Google Scholar] [CrossRef]
- Zhou, Y.; Han, Z.; He, C.; Feng, Q.; Wang, K.; Wang, Y.; Luo, N.; Dodbiba, G.; Wei, Y.; Otsuki, A.; et al. Long-Term Stability of Different Kinds of Gas Nanobubbles in Deionized and Salt Water. Materials 2021, 14, 1808. [Google Scholar] [CrossRef] [PubMed]
- Yadav, S.; Shire, S.J.; Kalonia, D.S. Factors Affecting the Viscosity in High Concentration Solutions of Different Monoclonal Antibodies. J. Pharm. Sci. 2010, 99, 4812–4829. [Google Scholar] [CrossRef] [PubMed]
- Cheng, W.; Joshi, S.B.; Jain, N.K.; He, F.; Kerwin, B.A.; Volkin, D.V.; Middaugh, C.R. Linking the Solution Viscosity of an IgG2 Monoclonal Antibody to Its Structure as a Function of pH and Temperature. J. Pharm. Sci. 2013, 102, 4291–4304. [Google Scholar] [CrossRef] [PubMed]
- Yadav, S.; Liu, J.; Shire, S.J.; Kalonia, D.S. Specific interactions in high concentration antibody solutions resulting in high viscosity. J. Pharm. Sci. 2010, 99, 1152–1168. [Google Scholar] [CrossRef]
- Salinas, B.A.; Sathish, H.A.; Bishop, S.M.; Harn, N.; Carpenter, J.F.; Randolph, T.W. Understanding and Modulating Opalescence and Viscosity in a Monoclonal Antibody Formulation. J. Pharm. Sci. 2010, 99, 82–93. [Google Scholar] [CrossRef]
- Zidar, M.; Rozman, P.; Belko-Parkel, K.; Ravnik, M. Control of viscosity in biopharmaceutical protein formulations. J. Colloid Interface Sci. 2020, 580, 308–317. [Google Scholar] [CrossRef]
- Mosca, I.; Pounot, K.; Beck, C.; Colin, L.; Matsarskaia, O.; Grapentin, C.; Seydel, T.; Schreiber, F. Biophysical Determinants for the Viscosity of Concentrated Monoclonal Antibody Solutions. Mol. Pharm. 2023, 20, 4698–4713. [Google Scholar] [CrossRef]
- Prass, T.M.; Garidel, P.; Blech, M.; Schäfer, L.V. Viscosity Prediction of High-Concentration Antibody Solutions with Atomistic Simulations. J. Chem. Inf. Model. 2023, 63, 6129–6140. [Google Scholar] [CrossRef] [PubMed]
- Zhang, Z.; Liu, Y. Recent progresses of understanding the viscosity of concentrated protein solutions. Curr. Opin. Chem. Eng. 2017, 16, 48–55. [Google Scholar] [CrossRef]
- Nagaev, E.I.; Baimler, I.V.; Baryshev, A.S.; Astashev, M.E.; Gudkov, S.V. Effect of Laser-Induced Optical Breakdown on the Structure of Bsa Molecules in Aqueous Solutions: An Optical Study. Molecules 2022, 27, 6752. [Google Scholar] [CrossRef] [PubMed]
- Simakin, A.V.; Sarimov, R.M.; Smirnova, V.V.; Astashev, M.E.; Serov, D.A.; Yanykin, D.V.; Chausov, D.N.; Shkirin, A.V.; Uvarov, O.V.; Rotanov, E.; et al. New Structural Nanocomposite Based on PLGA and Al2O3 NPs as a Balance between Antibacterial Activity and Biocompatibility with Eukaryotic Cells. J. Compos. Sci. 2022, 6, 298. [Google Scholar] [CrossRef]
- Zhao, H.; Brown, P.H.; Schuck, P. On the distribution of protein refractive index increments. Biophys. J. 2011, 100, 2309–2317. [Google Scholar] [CrossRef]
- Ball, V.; Ramsden, J.J. Buffer dependence of refractive index increments of protein solutions. Biopolymers 1998, 46, 489–492. [Google Scholar] [CrossRef]
- Carlson, T. The diffusion of oxygen in water. J. Am. Chem. Soc. 1911, 33, 1027–1032. [Google Scholar] [CrossRef]
- Abraham, G.N. Human triclonal anti-IgG gammopathy. I. Iso-electric focusing characteristics of the IgG, IgA and IgM anti-IgG and their heavy and light chains. Immunology 1978, 35, 429–436. [Google Scholar]
- Abdelraheem, E.M.M.; Busch, H.; Hanefeld, U.; Tonin, F. Biocatalysis explained: From pharmaceutical to bulk chemical production. React. Chem. Eng. 2019, 4, 1878–1894. [Google Scholar] [CrossRef]
- Besser, B.P. Synopsis of the historical development of Schumann resonances. Radio Sci. 2007, 42, 20. [Google Scholar] [CrossRef]
- Matveeva, T.A.; Baimler, I.V.; Artemiev, K.V.; Gorudko, I.V.; Sarimov, R.M. Laser Optical Breakdown Modified Physical Properties of Lysozyme in Aqueous Solution. Opera Medica Physiol. 2022, 9, 126–136. [Google Scholar] [CrossRef]
- Yu, Z.; Reid, J.C.; Yang, Y.P. Utilizing dynamic light scattering as a process analytical technology for protein folding and aggregation monitoring in vaccine manufacturing. J. Pharm. Sci. 2013, 102, 4284–4290. [Google Scholar] [CrossRef] [PubMed]
- Bobylev, A.G.; Penkov, N.V.; Troshin, P.A.; Gudkov, S.V. The effect of dilution on the aggregation of polycarboxylated C60 fullerene nanoparticles. Biophysics 2015, 60, 30–34. [Google Scholar] [CrossRef]
- Biswas, B.; Muttathukattil, A.N.; Reddy, G.; Singh, P.C. Contrasting Effects of Guanidinium Chloride and Urea on the Activity and Unfolding of Lysozyme. Acs Omega 2018, 3, 14119–14126. [Google Scholar] [CrossRef] [PubMed]
- Wu, K.; Yu, L.; Zheng, X.; Wang, Y.; Feng, Y.; Tu, L.; Wang, J.P. Viscosity effect on the brownian relaxation based detection for immunoassay applications. IEEE Eng. Med. Biol. Soc. 2014, 2769–2772. [Google Scholar] [CrossRef]
- Jyoti, D.; Gordon-Wylie, S.W.; Reeves, D.B.; Paulsen, K.D.; Weaver, J.B. Distinguishing Nanoparticle Aggregation from Viscosity Changes in MPS/MSB Detection of Biomarkers. Sensors 2022, 22, 6690. [Google Scholar] [CrossRef]
- Astashev, M.E.; Belosludtsev, K.N.; Kharakoz, D.P. Method for digital measurement of phase-frequency characteristics for a fixed-length ultrasonic spectrometer. Acoust. Phys. 2014, 60, 335–341. [Google Scholar] [CrossRef]
- Shcherbakov, I.A. Influence of External Impacts on the Properties of Aqueous Solutions. Phys. Wave Phenom. 2021, 29, 89–93. [Google Scholar] [CrossRef]
- Shcherbakov, I.A. Current Trends in the Studies of Aqueous Solutions. Phys. Wave Phenom. 2022, 30, 129–134. [Google Scholar] [CrossRef]
- Bruskov, V.I.; Karmanova, E.E.; Chernikov, A.V.; Usacheva, A.M.; Ivanov, V.E.; Emel’yanenko, V.I. Formation of Hydrated Electrons in Water under Thermal Electromagnetic Exposure. Phys. Wave Phenom. 2021, 29, 94–97. [Google Scholar] [CrossRef]
- Gudkov, S.V.; Penkov, N.V.; Baimler, I.V.; Lyakhov, G.A.; Pustovoy, V.I.; Simakin, A.V.; Sarimov, R.M.; Scherbakov, I.A. Effect of Mechanical Shaking on the Physicochemical Properties of Aqueous Solutions. Int. J. Mol. Sci. 2020, 21, 8033. [Google Scholar] [CrossRef]
- Chernikov, A.V.; Gudkov, S.V.; Shtarkman, I.N.; Bruskov, V.I. Oxygen effect in heat-mediated damage to DNA. Biofizika 2007, 52, 244–251. [Google Scholar] [PubMed]
- Bruskov, V.I.; Chernikov, A.V.; Gudkov, S.V.; Masalimov, Z.K. Thermal Activation of the Reducing Properties of Seawater Anions. Biofizika 2003, 48, 1022–1029. [Google Scholar] [PubMed]
- Chen, B.; Xia, Y.; He, R.; Sang, H.; Zhang, W.; Li, J.; Chen, L.; Wang, P.; Guo, S.; Yin, Y.; et al. Water-solid contact electrification causes hydrogen peroxide production from hydroxyl radical recombination in sprayed microdroplets. Proc. Natl. Acad. Sci. USA 2022, 119, e2209056119. [Google Scholar] [CrossRef] [PubMed]
- Sarimov, R.M.; Simakin, A.V.; Matveeva, T.A.; Lyakhov, G.A.; Pustovoy, V.I.; Troitskii, A.V.; Shcherbakov, I.A. Influence of Magnetic Fields with Induction of 7 T on Physical and Chemical Properties of Aqueous NaCl Solutions. Appl. Sci. 2021, 11, 11466. [Google Scholar] [CrossRef]
- Bunkin, N.F.; Shkirin, A.V.; Ninham, B.W.; Chirikov, S.N.; Chaikov, L.L.; Penkov, N.V.; Kozlov, V.A.; Gudkov, S.V. Shaking-induced aggregation and flotation in immunoglobulin dispersions: Differences between water and water-ethanol mixtures. ACS Omega 2020, 5, 14689–14701. [Google Scholar] [CrossRef] [PubMed]
- Privalov, P.L.; Gill, S.J. Stability of Protein Structure and Hydrophobic Interaction. Adv. Protein Chem. 1988, 39, 191–234. [Google Scholar] [CrossRef] [PubMed]
- Goncharuk, V.V.; Bagrii, V.A.; Mel’nik, L.A.; Chebotareva, R.D.; Bashtan, S.Y. The use of redox potential in water treatment processes. J. Water Chem. Technol. 2010, 32, 1–9. [Google Scholar] [CrossRef]
- Sarimov, R.M.; Matveyeva, T.A.; Binhi, V.N. Laser interferometry of the hydrolytic changes in protein solutions: The refractive index and hydration shells. J. Biol. Phys. 2018, 44, 345–360. [Google Scholar] [CrossRef]
- Ptitsyn, O.B. Protein folding: Hypotheses and experiments. J. Protein Chem. 1987, 6, 273–293. [Google Scholar] [CrossRef]
- Pandey, S.; Garg, T.; Singh, K.; Rai, S. Effect of magnetically induced water structure on the oestrous cycles of albino female mice Musmusculus. Electro-Magnetobiol. 1996, 15, 133–140. [Google Scholar] [CrossRef]
- Rai, S.; Garg, T.; Vashistha, H. Possible Effect of Magnetically Induced Water Structures on Photosynthetic Electron Transport Chains of a Green Alga Chlorella Vulgarts. Electro-Magnetobiol. 1996, 15, 49–55. [Google Scholar] [CrossRef]
- Devyatkov, N.D.; Kislov, V.Y.; Kislov, V.V.; Kolesov, V.V.; Smirnov, V.F.; Chigin, E.P. Detection of the effect of normalisation of the functional state of human internal organs under the influence of water activated by millimetre radiation. Millimetre Waves Biol. Med. 1996, 8, 65–68. [Google Scholar]
- Ružič, R.; Jerman, I. Influence of Ca2+ in biological effects of direct and indirect ELF magnetic field stimulation. Electro-Magnetobiol. 1998, 17, 205–216. [Google Scholar]
- Colic, M.; Morse, D. Mechanism of the long-term effects of electromagnetic radiation on solutions and suspended colloids. Langmuir 1998, 14, 783–787. [Google Scholar] [CrossRef]
- Binhi, V.N. Magnetobiology: Underlying Physical Problems; Academic Press: San Diego, CA, USA, 2002. [Google Scholar]
- Keene, J.P. Absorption spectra in irradiated water and some solutions. Part II. Optical absorptions in irradiated water. Nature 1963, 197, 47–48. [Google Scholar] [CrossRef]
- Patil, P.N.; Sawant, D.V.; Deshmukh, R.N. Physico-chemical parameters for testing of water—A review. Int. J. Environ. Sci. 2012, 3, 1194–1207. [Google Scholar]
- Gonella, G.; Backus, E.H.G.; Nagata, Y.; Bonthuis, D.J.; Loche, P.; Schlaich, A.; Netz, R.R.; Kühnle, A.; McCrum, I.T.; Koper, M.T.M.; et al. Water at charged interfaces. Nat. Rev. Chem. 2021, 5, 466–485. [Google Scholar] [CrossRef]
- Wang, H.; Liu, R.; Tu, T.; Xie, L.; Sheng, K.; Chen, Y.; Tang, X. Properties of Radicals Formed by the Irradiation of Wool Fibers. J. Radiat. Res. 2004, 45, 77–81. [Google Scholar] [CrossRef]
- Chikramane, P.S.; Kalita, D.; Suresh, A.K.; Kane, S.G.; Bellare, J.R. Why extreme dilutions reach non-zero asymptotes: A nanoparticulate hypothesis based on froth flotation. Langmuir 2012, 28, 15864–15875. [Google Scholar] [CrossRef]
- Tytik, D.L.; Souvorova, O.V.; Kuz’min, V.I.; Revina, A.A. Relaxation of Aqueous Solutions in Successive Dilutions of Antibodies to S100 Protein According to Luminescence Data. Phys. Wave Phenom. 2023, 31, 200–205. [Google Scholar] [CrossRef]
- Calabrese, E.J.; Baldwin, L.A. Hormesis: The Dose-Response Revolution. Annu. Rev. Pharmacol. Toxicol. 2023, 43, 175–197. [Google Scholar] [CrossRef] [PubMed]
- Zaichkina, S.I.; Rozanova, O.M.; Dyukina, A.R.; Simonova, N.B.; Romanchenko, S.P.; Sorokina, S.S.; Aptikaeva, G.F.; Yusupov, V.I. Influence of low-dose-rate red and near-infrared radiations on the level of reactive oxygen species, the genetic apparatus and the tumor growth in mice in vivo. Biophysics 2013, 58, 712–717. [Google Scholar] [CrossRef]
- Xu, H.; Takashi, E.; Liang, J.; Chen, Y.; Yuan, Y.; Fan, J. Effect of Heat Shock Preconditioning on Pressure Injury Prevention via Hsp27 Upregulation in Rat Models. Int. J. Mol. Sci. 2022, 23, 8955. [Google Scholar] [CrossRef]
- Delatorre-Castillo, J.P.; Delatorre-Herrera, J.; Lay, K.S.; Arenas-Charlín, J.; Sepúlveda-Soto, I.; Cardemil, L.; Ostria-Gallardo, E. Preconditioning to Water Deficit Helps Aloe vera to Overcome Long-Term Drought during the Driest Season of Atacama Desert. Plants 2022, 11, 1523. [Google Scholar] [CrossRef] [PubMed]
- Leurcharusmee, P.; Sawaddiruk, P.; Punjasawadwong, Y.; Sugundhavesa, N.; Klunklin, K.; Tongprasert, S.; Sitilertpisan, P.; Jaiwongkam, T.; Apaijai, N.; Chattipakorn, N.; et al. CoenzymeQ10 and Ischemic Preconditioning Potentially Prevent Tourniquet-Induced Ischemia/Reperfusion in Knee Arthroplasty, but Combined Pretreatment Possibly Neutralizes Their Beneficial Effects. Antioxidants 2022, 11, 419. [Google Scholar] [CrossRef] [PubMed]
- Xie, R.; Zeng, X.; Yan, H.; Huang, X.; Deng, C. Effects and Mechanisms of Exosomes from Different Sources in Cerebral Ischemia. Cells 2022, 11, 3623. [Google Scholar] [CrossRef]
- Belity, T.; Horowitz, M.; Hoffman, J.R.; Epstein, Y.; Bruchim, Y.; Todder, D.; Cohen, H. Heat-Stress Preconditioning Attenuates Behavioral Responses to Psychological Stress: The Role of HSP-70 in Modulating Stress Responses. Int. J. Mol. Sci. 2022, 23, 4129. [Google Scholar] [CrossRef]
- Cheng, Y.-H.; Chen, K.-H.; Sung, Y.-T.; Yang, C.-C.; Chien, C.-T. Intrarenal Arterial Transplantation of Dexmedetomidine Preconditioning Adipose Stem-Cell-Derived Microvesicles Confers Further Therapeutic Potential to Attenuate Renal Ischemia/Reperfusion Injury through miR-122-5p/Erythropoietin/Apoptosis Axis. Antioxidants 2022, 11, 1702. [Google Scholar] [CrossRef]
- Ogundele, O.M.; Gbashi, S.; Oyeyinka, S.A.; Kayitesi, E.; Adebo, O.A. Optimization of Infrared Heating Conditions for Precooked Cowpea Production Using Response Surface Methodology. Molecules 2021, 26, 6137. [Google Scholar] [CrossRef]
- Shishkina, A.V.; Ksenofontov, A.A.; Penkov, N.V.; Vener, M.V. Diclofenac Ion Hydration: Experimental and Theoretical Search for Anion Pairs. Molecules 2022, 27, 3350. [Google Scholar] [CrossRef] [PubMed]


Disclaimer/Publisher’s Note: The statements, opinions and data contained in all publications are solely those of the individual author(s) and contributor(s) and not of MDPI and/or the editor(s). MDPI and/or the editor(s) disclaim responsibility for any injury to people or property resulting from any ideas, methods, instructions or products referred to in the content. |
© 2023 by the authors. Licensee MDPI, Basel, Switzerland. This article is an open access article distributed under the terms and conditions of the Creative Commons Attribution (CC BY) license (https://creativecommons.org/licenses/by/4.0/).
Share and Cite
Nagaev, E.I.; Molkova, E.A.; Pustovoy, V.I.; Matveeva, T.A.; Zakharov, D.A.; Simakin, A.V.; Stepanova, E.V.; Semenova, N.A.; Reut, V.E.; Kalinitchenko, V.P.; et al. Possible Approaches to Studying the Influence of Magnetic Fields and Mechanical Effects on the Physicochemical Properties of Aqueous IgG Colloids. Appl. Sci. 2023, 13, 13055. https://doi.org/10.3390/app132413055
Nagaev EI, Molkova EA, Pustovoy VI, Matveeva TA, Zakharov DA, Simakin AV, Stepanova EV, Semenova NA, Reut VE, Kalinitchenko VP, et al. Possible Approaches to Studying the Influence of Magnetic Fields and Mechanical Effects on the Physicochemical Properties of Aqueous IgG Colloids. Applied Sciences. 2023; 13(24):13055. https://doi.org/10.3390/app132413055
Chicago/Turabian StyleNagaev, Egor I., Elena A. Molkova, Vladimir I. Pustovoy, Tatyana A. Matveeva, Dmitry A. Zakharov, Alexander V. Simakin, Evgenia V. Stepanova, Natalia A. Semenova, Veronika E. Reut, Valery P. Kalinitchenko, and et al. 2023. "Possible Approaches to Studying the Influence of Magnetic Fields and Mechanical Effects on the Physicochemical Properties of Aqueous IgG Colloids" Applied Sciences 13, no. 24: 13055. https://doi.org/10.3390/app132413055