Article

Nutritional Value of New Sweet Pepper Genotypes Grown in Organic System

by
Creola Brezeanu
1,
Petre Marian Brezeanu
1,
Vasile Stoleru
2,
Liviu Mihai Irimia
2,
Florin Daniel Lipșa
3,
Gabriel-Ciprian Teliban
2,
Marius Mihai Ciobanu
3,
Florin Murariu
4,
Ioan Puiu
5,
Ferdinando Branca
6,* and
Otilia Cristina Murariu
3,*
1
Vegetable Research Development Station of Bacau, 600388 Bacau, Romania
2
Department of Horticulture Technologies, “Ion Ionescu de la Brad” University of Life Sciences, 700490 Iasi, Romania
3
Department of Food Technology, “Ion Ionescu de la Brad” University of Life Sciences, 700490 Iasi, Romania
4
Department of Agroeconomy, “Ion Ionescu de la Brad” University of Life Sciences, 700490 Iasi, Romania
5
Department of Plant Science, “Ion Ionescu de la Brad” University of Life Sciences, 700490 Iasi, Romania
6
Department of Agriculture, Food and Environment, University of Catania, 95131 Catania, Italy
*
Authors to whom correspondence should be addressed.
Agriculture 2022, 12(11), 1863; https://doi.org/10.3390/agriculture12111863
Submission received: 17 September 2022 / Revised: 28 October 2022 / Accepted: 3 November 2022 / Published: 6 November 2022
(This article belongs to the Section Agricultural Product Quality and Safety)

Abstract

:
The market request for organic vegetables has grown recently for their positive impact on healthy diets. Consumers have progressively shown preferences for various combinations of color, size, and shape of pepper fruits. Facilitating communication, collaboration, and participation in the selection of cultivars with superior performance, flavor, texture, and culinary attributes can represent a key tool in breeding for nutritional and culinary traits. The current research started from the premise that organic production involves achieving adequate nutritional and culinary quality of pepper fruits. The study was conducted to investigate traits related culinary quality of pepper genotypes, especially in the ripening phase of fruits, to select the best resources with a high antioxidant content for breeding programs. The biological material represented by nine genotypes of sweet pepper was cultivated in the open fields during 2019 and 2020 at the experimental stations of the Vegetable Research Development Station of Bacau and of Iasi University of Life Sciences. Agricultural practices and intensive breeding focused on yield and stress tolerance have indirectly led to a reduction in the nutrition and flavor of the produce. Complex approaches, including screening of consumer preferences, phenotyping, and use of modern genomics and analytical chemistry tools in breeding, together with participatory farmer-breeder-chef-consumer collaborations, can represent a strategy to facilitate the development of the next generation of crops aimed to meet the growing demands of safe and nutritionally vegetables featured by culinary standards as good flavor, color, and texture.

1. Introduction

The pepper (Capsicum annuum L. ssp. annuum) is a species of the Capsicum genus, which belongs to the Solanaceae family. Sweet pepper is one of the most important vegetable crops grown worldwide for fresh consumption, culinary art, and processing [1]. Sweet pepper is a species of thermophilic vegetable that produces over 38 million tons of fruit worldwide [2]. It requires a low level of labor in field cultivation and doesn’t have a high susceptibility to diseases and pests compared to other plants in the Solanaceae [1].
Numerous pieces of information from the scientific literature shows the beneficial effects of sweet pepper varieties of food components on human health [3]. In view of the increasing consumer demand for healthy products and current policies on sustainable crop systems, organic production is a viable alternative to conventional agricultural practices [4] based on chemical inputs [5]. Therefore, some fruits and vegetables are highly valued, not only for their nutritional value but also for their potential health functionality against cardiovascular diseases, cancer, diabetes, neurodegenerative disease, or cataract [4]. This direct relationship between diet and health has attracted the attention of plant breeders who are directing their research to breed genotypes with high content of antioxidants [6]. Thus, it becomes relevant to study the variations in different genotypes during maturity in different geographical areas [7] to select the best genotypes and practices for health benefits.
Sweet pepper is a species with high nutritional value due to its antioxidant qualities, adding to its qualitative characteristics such as flavor, color, and texture.
Pepper fruits contain a high amount of substances beneficial to human health, for example, ascorbic acid, carotenoids, tocopherols [8], and phenolic compounds, especially flavonoids [9]. Among these compounds, anthocyanin, phenolic compounds, ascorbic acid, capsaicinoids, and carotenoids stand out as substances that play an important role in protecting against oxidative damage caused by free radicals.
Levels of these antioxidants can vary with genotype, stage of maturity, plant part consumed, and conditions during growth and postharvest handling [10]. In addition, their flavor and nutritional value are influenced by organic acids and sugars [11]. This direct and positive relationship between human health and diet has attracted the attention of plant breeders and biotechnologists, who are directing their efforts to breed genotypes with high content of phytochemicals [10]. Sweet pepper is a very popular vegetable, which can be eaten raw, cooked, pickled, pasta, or in sauce. Due to its high perishability rate, it is processed to extend its shelf life. In the food industry, sweet pepper is usually added in the dry form as a spice or flavoring ingredient [12]. Moreover, sweet peppers and their extracted compounds can be used as a coloring agent for food and cosmetics, pharmaceuticals, and nutraceuticals. However, nowadays, dried fruits and vegetables eaten as a snack are becoming very popular [13].
Current agricultural systems have focused mainly on yields rather than on ecosystem sustainability and food production. It is well known that the intensive use of fertilizers, machinery, and agricultural practices as a whole contributes to high greenhouse gas emissions (GHG). Thus, farmers have to balance between carrying out their activities and maintaining or increasing their income or adapting to climate change scenarios and reducing GHG emissions. Whatever strategies for feeding the world in a more sustainable way, we are currently witnessing a huge expansion of organic farming, based mainly on environmental awareness and concerns about food security, despite the critics of some authors [14].
Organic sweet peppers have been shown to contain much more vitamin C, carotenoids, and polyphenols than conventional fruits [15].
Therefore, the aim of this study was to investigate traits-related nutritive values of pepper genotypes, especially in the fruit ripening phase, with the aim of selecting the best resources for breeding programs. Moreover, the sustainability aspects of the organic system of sweet pepper cultivation have been assessed by evaluation of the quality obtained products, determined by spectrometric methods. Several fruit quality traits, like total soluble solids, vitamin C, color (carotene, lycopene, xanthophyll, and chlorophyll content), total dry matter, pH, and titratable acidity, all responsible for nutritive properties will be explored further in this study.

2. Materials and Methods

2.1. Plant Material and Growth Conditions

The improvement of the pepper varieties, with high ecological plasticity in the context of climate change, considers the culinary use of some varieties with high concentrations of antioxidant compounds, respectively β–carotene, lycopene, vitamin C, and chlorophyll.
The study was carried out over the period 2019–2020 (the weather conditions are detailed in Table 1) in two different locations respectively “Vegetable Research and Development Station (VRDS), Bacau, Romania (46°580577″ N, 26°953322″ E, 158.96) and “Ion Ionescu de la Brad” University of Life Sciences of Iasi, Romania (I.U.L.S.) (47°11’30″ N, 27°33′27″ E) V. Adamachi farm. The weather conditions are detailed in Table 1.
The weather data were monitored and recorded throughout the pepper cultivation period. The characteristics were monitored in Bacau and Iasi crop cultures fields between May and October.
The seeds of the 9 pepper genotypes were sown in the middle of February for both years in plastic trays, which were 51 × 32 cm in pot size and 4 × 4 cm in cell size.
The seedlings were performed in the greenhouse where the vegetation factors can be controlled to have an optimal seedling from a qualitative point of view, and the temperature was maintained at 24/18 °C (day/night), and relative humidity was 60–70%. 10 days before transplanting, the temperature in the greenhouse was lowered to 18/15 °C (day/night) to help the pepper seedlings adapt to the new environmental conditions. Transplanting seedlings in the open field was performed in the second decade of May during the two years. In this study, the soil used in Bacau had the following characteristics: clay soil of chambic chernozem (pH 6.8; 2.6% organic matter; 0.150% N, 116 ppm P2O5, 195 ppm K2O and the soil used in Iasi was alluvial cambic chernozem (31% clay; 3.2% organic matter; 28 mg kg−1 N; 1.83% K2O; 1.13% CaO; 0.19% P2O5; 0.16 MgO; 0.46%Na2O; 3.96% Fe2O3; 0.11%MnO; 49 PPM Cu; 103 ppm Zn and pH 7.2.
The fertilization program consisted of two foliar applications with Organofert®: 5% N, 4.2% P2O5, 8.2% K2O, 2% Fe, 2,1% Mg, 5% Ca, and three foliar fertilization with Cropmax®, 100% natural foliar fertilizer with: 0.2% N, 0.4% P2O5, 0.2% K2O, 220 mg/l Fe, 550 mg/L Mg and 10mg/L Ca.
Pest controls have been carried out with: Bactospeine DF® against Helicoverpa armigera (Active substance 54% Bacillus thuringiensis, subsp Kurstaki ABTS 351) by spraying (foliar application) with a dose of 0.5 kg per hectare; Treatments with Konflic® 0.3%, Bionid® 0.5% and Neemex® 0.3% were applied against the attack of Aphids (green peach aphid-Myzus persicae Sulz., potato striated aphid-Aulacorthum solani Kalt., potato aphid-Macrosiphum euphorbiae Th.) by spraying (foliar application).

2.2. Experimental Design
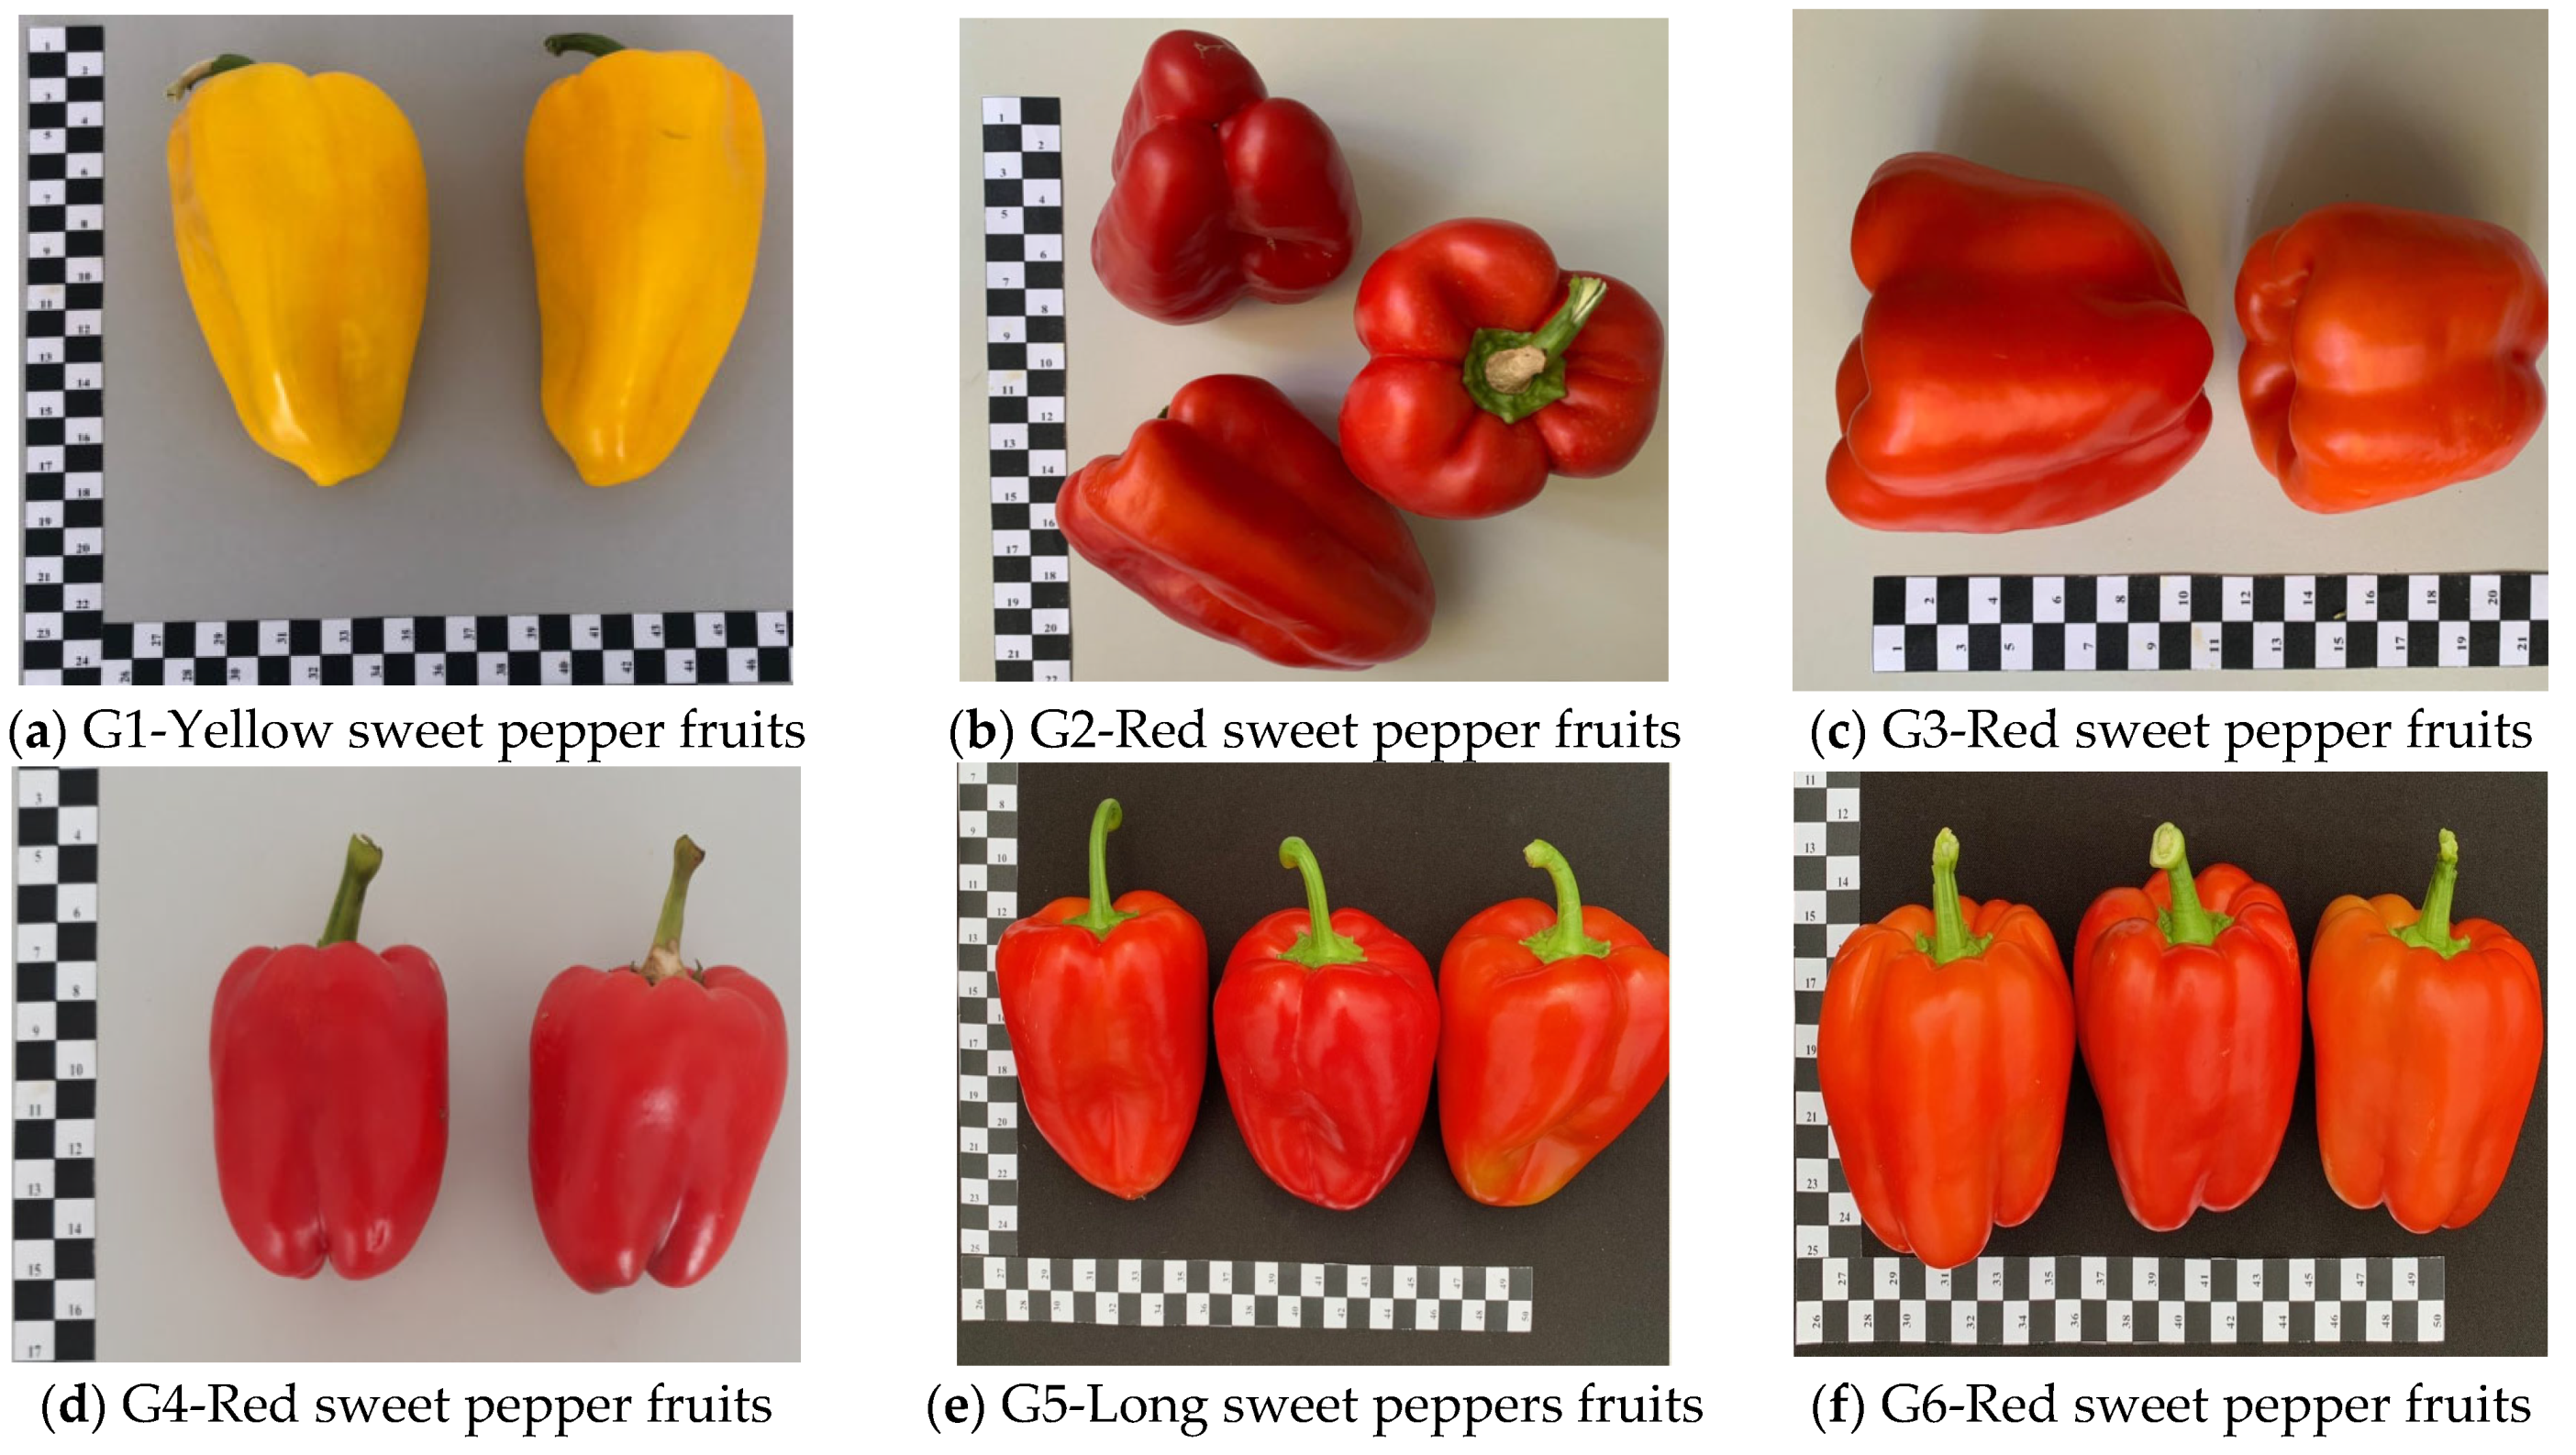
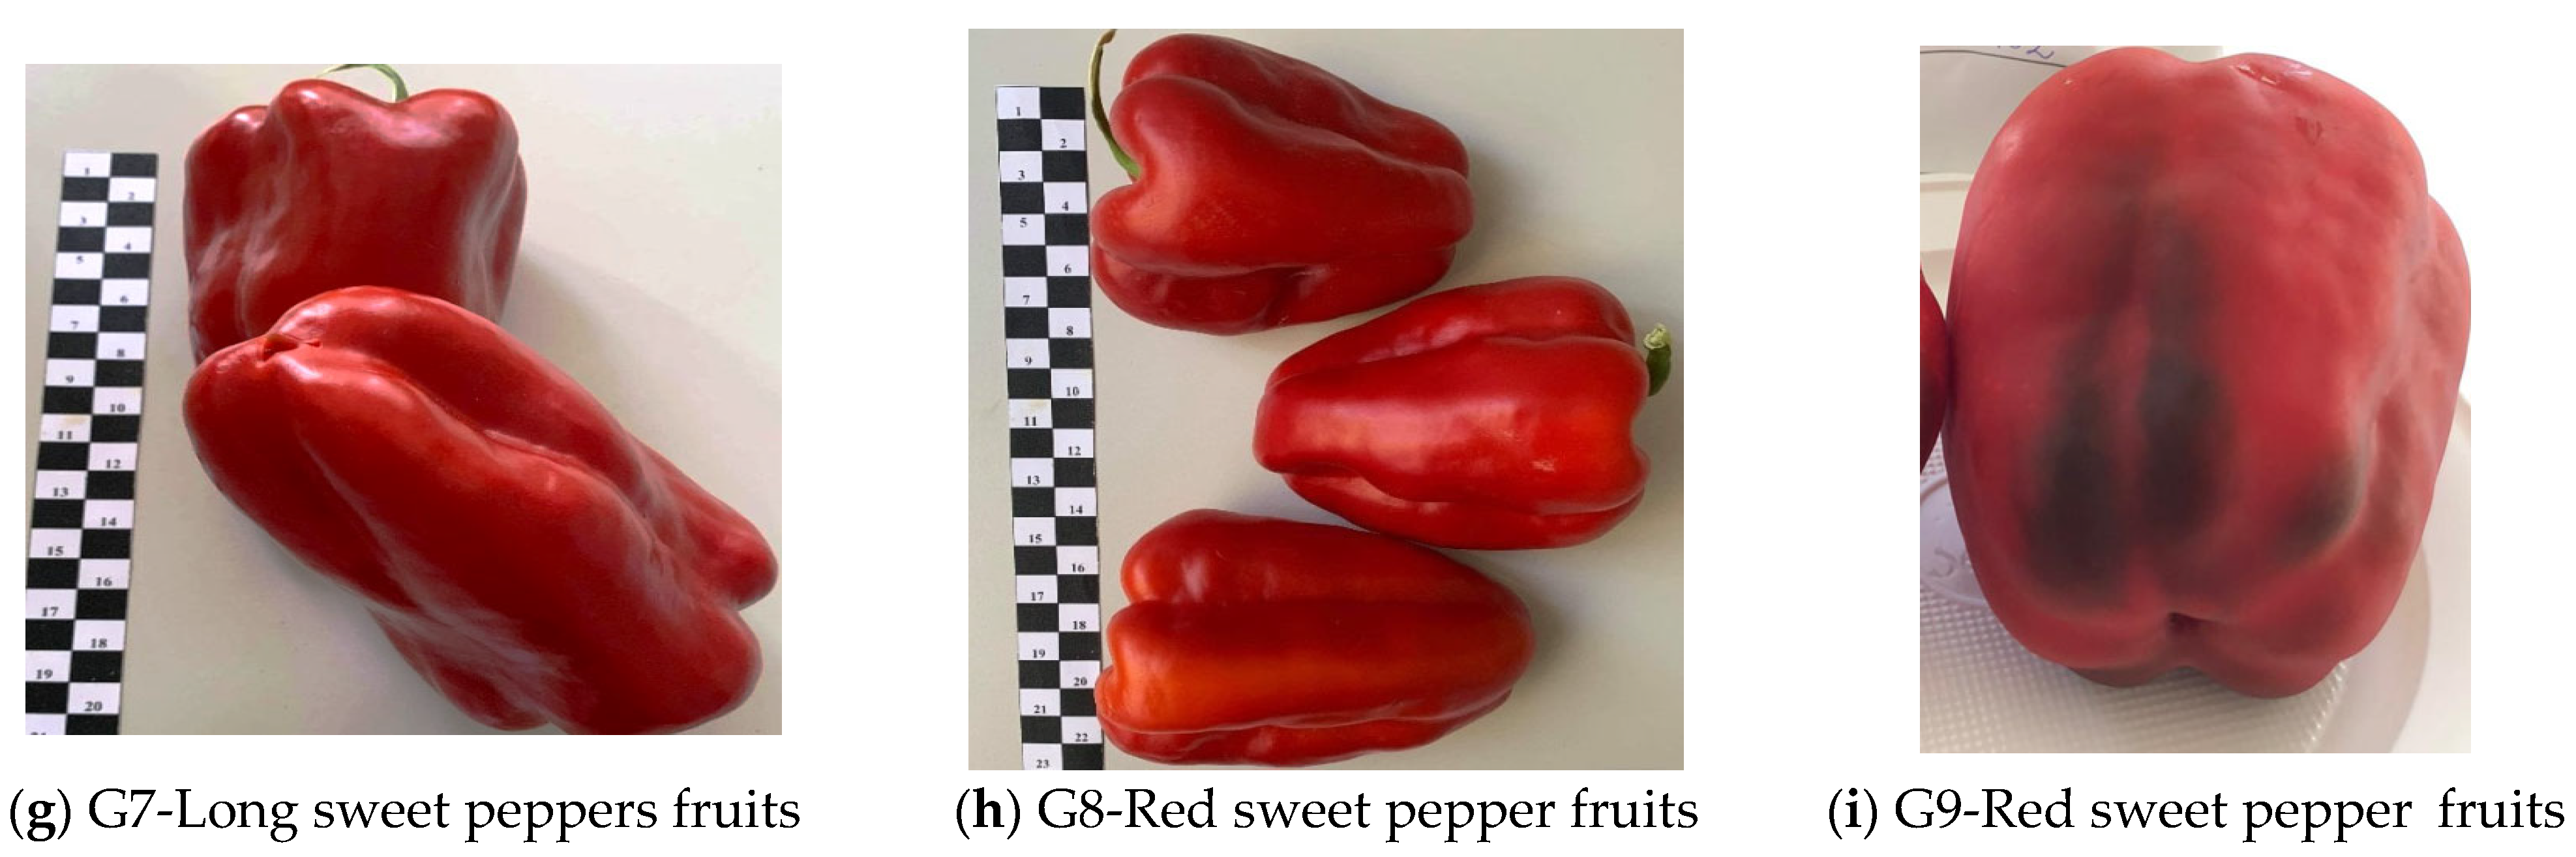
The certification of organic culture is in accordance with art. 27 of Regulation (EC) no. 834/2007 [16].
The randomized experimental field was displayed in four replicas, 9 m2 for each replicate, ensuring a density of 6.5 plants per square meter. In the experimental fields, it was mulched with black plastic film, and drip irrigation was ensured from May to September. It was used as a watering tape with a flow rate of 2 L/h with an irrigation norm/vegetation period of 113.6 m3 and 28.4 m3·h-1. Practical works were applied according to the scientific literature and usually applied by organic farming [17]. The experimental factors were as follows: A. Crop location; Iasi (Is) and Bacau (Bc); B. Genotypes (G1, G2, G3, G4, G5, G6, G7, G8 and G9) (Figure 1).

2.3. Fruit Material

In the experiments, it was used a total of 9 pepper breeding lines (Capsicum annum L.), including long-form sweet peppers (G1, G5, and G7) and sweet bell peppers (G2, G3, G4, G6, G8, and G9) (Figure 1) grown in the organic system in the open field.
A total of 18 fruits were chosen from each genotype, at random, harvested at full physiological maturity (BBCH 809), for the evaluation of the quality of pepper fruits for analysis of antioxidant components, chlorophyll, sugars, dry matter, and acidity. Three replicates, each using six fruits, were analyzed. Before the analysis was performed, the sweet pepper fruits were stored in controlled cooling conditions at a temperature of 4 ± 1° and relative humidity of 85 ± 5%.
Sample preparation for Analyses: from sweet peppers harvested, randomly mixed samples were prepared for each genotype for analytical analysis of the nutritive properties carried out in 3 replicates. Determinations of antioxidant components were carried out on the day of harvest for the three replicates, especially the antioxidant compounds that are very affected by oxidation processes, such as vitamin C. The replicates samples were packed in aerobic conditions, in white biodegradable open paper bags, without the presence of visible light, being stored in refrigerated conditions from harvest moment to analyzing moment for about 3 h.

2.4. The Analytical Methodology Used

2.4.1. Determination of β–Carotene and Lycopene

The pigments represented by β–carotene and lycopene from organic peppers genotypes were extracted from 1 g of fruit using petroleum ether (1:50). This component’s quantitative dosing was performed by a spectrophotometric method using the DLAB® SP-UV 1100 spectrophotometer, China against them blank represented by petroleum ether. Spectrophotometric readings were performed at 452 nm for β–carotene and 472 nm for lycopene. In order to obtain the total β–carotene fractions, the absorbance values were multiplied by 19.96 and for lycopene by 17.6. All carotenoid determinations were carried out in triplicate. Results were expressed as mg·100 g−1 F.W. [18,19].

2.4.2. Determination of Acid L-ascorbic

Vitamin C was quantitatively determined by using a relatively simple method using 2,6-Dichlorophenolindophenol as described by [20]. Vitamin C from fresh samples was extracted with meta-Phosphoric acid using a pinch of acid-washed quartz sand. The supernatant was titrated against standard 2,6-Dichlorophenolindophenol, which had already been standardized with ascorbic acid. Results were expressed as mg·100 g−1 on F.W.

2.4.3. Determination of Chlorophyll

Chlorophyll pigments in fresh pepper were determined by the spectrophotometric method using the Shimandzu® UV–1800 spectrophotometer. The chlorophyll from 1 g of fresh sample was extracted with 80% acetone obtaining a concentration of 1%. The peaks of the light absorption curve characterize both chlorophylls a (663 and 470 nm, respectively) and chlorophyll b (646 and 470 nm, respectively). The results are calculated based on the formula developed by Mackiney [21] and the values expressed in mg·100 g−1 F.W.:
Chlorophyll a = ((12.21 × DO663) − (2.81 × DO646)) × 5
Chlorophyll b = ((20.13 × DO646) − (5.03 × DO663)) × 5
Carotene and xanthophylls = ((1000 × DO470)−(3.27 × Chlorophyll a) − (1.04 × Chlorophyll b)) × 5/229

2.4.4. Determination of Total Dry Matter (TDM, %)

The dry matter content of the fresh peppers was determined by drying about 5 g of raw and ground homogenized fruits without seeds in a forced air-drying oven (Biobase®, Jinan, China) at 105 °C for 12 h. The differences in weight before and after drying were reported at sample weight. The results were expressed as water loss, being expressed into the percentage of dry matter [19,22].

2.4.5. Determination of Total Soluble Solids (TSS, °Bx)

The total soluble solids content was quantified with a handheld portable refractometer with high precision, using homogenized juice obtained by pressing the fresh fruit. The results are expressed in °Brix, according to 932.12 methods [19,23]. Two measurements were performed for each of the three replicas.

2.4.6. pH Value Determination

The pH value was determined with potentiometer Hanna Instruments® from juice obtained by pressing the fresh fruit, according to method 982.12 of the Association of Official Analytical Chemistry. The pH meter was calibrated in the range 4.01, 7.01, 4.01, and the determination was performed at a temperature of 20 °C [22].

2.4.7. Titratable Acidity Analysis

For the determination of titratable acidity (TA), the samples were homogenized with distilled water and titrated with 0.1 N NaOH until reaching 7.1 pH, according to method No. 942.15 of the [22]. The results were expressed in g acid citric per 100 g of pulp [19].

2.5. Statistical Analysis

The differences in the analyzed parameters were highlighted by the ANOVA test, which showed the statistical significance among genotypes and crop places. Duncan’s test (p ˂ 0.05) multiple comparison tests were used when the differences were significant. The SPSS v21 software was used (IBM® Corp., Armonk, NY, USA).

3. Results

Levels of β–Carotene, Lycopene, and Ascorbic Acid Compounds

Related to established benefits of antioxidants due to their free radical scavenging activities in the human organism, it is necessary to quantify them and to identify the species and genotypes grown in organic conditions with a high level of antioxidants in order to target the increased functional properties in food products [10].
Β–carotene is considered an anti-inflammatory agent and also a compound with a positive impact on the metabolism of the eyes, osteoblasts, and osteoclasts. It exerts a beneficial effect on the bone system, probably by modulating the oxidative state [24].
Comparing the average values of β–carotene and lycopene content for the nine genotypes studied, it is noticeable that there are no statistical differences between them. The place of cultivation (Is/ Bc) determined statistically significant differences with higher average values of β–carotene (4.79 mg·100 g−1 F.W. vs. 0.68 mg·100 g−1 F.W.) and lycopene (2.21 mg·100 g−1 F.W. vs. 0.51 mg·100 g−1 F.W.) for genotypes grown in the Bacau area (Table 2). The genotype and crop location present a significant impact for β–carotene, lycopene, and vitamin C, underlining that both factors are determinants of those constituents in sweet peppers.
Appropriate values have already been reported [25] for organically grown sweet pepper, which shows there is a relevant trend of higher values of carotenoid compounds than in conventionally grown fruits at the red ripening stage. Lopez, 2007 found the highest carotenoid concentrations in red peppers with values of 3.23 mg·100 g−1 F.W. vs. 1.73 mg·100 g−1 F.W. for organic/conventional fruits, in this case, the carotenoid content was 50% higher for organic fruits. In the current research, carotenoids compounds reached average values of 4.78 mg·100 g−1 F.W. It should be emphasized that the studied genotypes responded differently to the management system of organic soil fertilization, and the absorption mechanism of the different nutrients from the soil varied, aspects highlighted by the variation of the nutritional parameters evaluated in the present research.
Lycopene reduces protein oxidation, inhibits the production of free radicals, and stops the formation of tartrate-resistant multinuclear cells [24]. In this context, lycopene is a powerful antioxidant present mainly in sweet pepper, with the average daily consumption in β–carotene varying from 0.7 mg in Finland to 25 mg in Canada, the global average value being 2.5 mg.
Genotype 8 was distinguished by the highest content of β–carotene, with an average value of 5.36 mg·100 g−1 F.W., and lycopene, with an average value of 2.76 mg·100 g−1 F.W., followed by genotypes 9, with 3.96 mg·100 g−1 F.W. of β–carotene and 1.14 mg·100 g−1 F.W. of lycopene and 2.76 mg·100 g−1 F.W. of β–carotene and 2.04 mg·100 g−1 F.W. of lycopene and genotype 1 showed the lowest average values of β–carotene content of 1.48 mg·100 g−1 F.W. and lycopene of 0.63 mg·100 g−1 F.W (Table 2).
Vitamin C is involved in the reduction in the hydroxylation reaction necessary for the synthesis of collagen (lysine and proline), catecholamines (noradrenaline), and carnitine, as well as in oxidation-reduction processes (reduces nitrates and ferric iron). In addition, it is also involved in the oxidizing state (free radical scavenger or, on the contrary, hydroxyl radical producer in the presence of iron, within the inflammatory reaction). The recommended nutritional intake mainly takes into account the prevention of scurvy, that is, 30 mg/day, as well as the antioxidant properties of vitamin C. It is accepted that a plasma concentration of 60 µmol/L is optimal to avoid the risks of degenerative pathologies development. This value is, in fact, reached for daily consumption of 100 mg, from which the recommendations for the other population segments were extrapolated [24].
Regarding the vitamin C content of the nine genotypes of peppers studied; it is observed that the place of organic culture (Is/Bc) doesn’t show statistical differences between their average values. Analyzing from the statistical point of view, the content of vitamin C shows that it varied significantly depending on the genotype, with higher values ranging from 239.75 to 210.73 mg·100 g−1 F.W. for genotypes 9, 7, 6, and 8 and the lowest values between 115.5 and 121.6 mg·100 g−1 F.W. for genotypes G5 and G2 (Table 2). The level of vitamin C in the evaluated genotypes studied in this paper (Table 2) is within the range related in the scientific literature: 63–243 mg·100 g−1 F.W. [25]. The values variation of vitamin C is influenced by some factors such as cultivar, production practices, and environmental conditions. Superior values (Table 3) of vitamin C may be associated with the role of ascorbate as o photoprotector. Comparing the vitamin C content under organic conditions and conventional cultures results from other research [25], it can observe that level from the current paper of vitamin C (185.27 mg·100 g−1 F.W.) in organically fruits was 53.55% higher than in conventionally (120.65 mg·100 g−1 F.W.). Lopez (2007) obtained a 23.73% higher value for organic pepper vs. conventional variant. Our results are in agreement with Lopez’s (2007) values for organic pepper in the red stage (148.85 mg·100 g−1 F.W.).
Analyzing statistically from the perspective of the factors studied, the content of β–carotene shows no significant differences between genotypes 4 and 9, between G2, G3, and G7, and between G6 and G8 for organic culture from Iasi. Regarding the culture from Bacau, there are no statistical differences in β–carotene content between G3 and G6, as well as between G5 and G7. At the same time, the average values of β–carotene content for genotypes G8, G9, G5, G7, G2, G4, G6, G3, and G1 grown in Bacau varied significantly. Moreover, there are statistically significant differences between the genotypes G1, G3, G4, G5, G6, and G9 from Iasi (Table 3).
Analyzing by combining experimental factors (Iasi vs. Bacau) (Table 2) shows that all genotypes grown in the organic systems in Bacau showed the superiority of β–carotene and lycopene content. The same values superiority is maintained for the vitamin C content of the genotypes G1, G4, G6, G7, and G8 from Bacau. The genotypes G2, G3, G5, and G9, are highlighted with higher values of vitamin C content for samples grown in Iasi. It is distinguished genotype 8 cultivated in Bacau, with the highest content of antioxidants, respectively, in β–carotene (10.08 mg·100 g−1 F.W.) and lycopene (5.01 mg·100 g−1 F.W.) instead genotype 7 presented the highest vitamin C content (265.82 mg·100 g−1 F.W.). The content of vitamin C showed a significant variation, the lowest value being found on the G5 harvested from Is, respectively 99.29 mg·100 g−1 F.W (Table 3). The high content of β–carotene found in genotypes G8, G9, and G7 are determined by the interaction of genetic x crop location factors, an explanation of this difference being attributed to the environmental conditions, considering that the value of the average temperature in Iasi was higher with 0.5–0.7 °C, and the amount of precipitation in Bacau was higher both in 2020 and in 2019 when it was double.
Comparing the average value of the chlorophyll A, B, and xanthophylls content of the nine genotypes grown organically according to the crop location (Table 3) it was obtained significant differences in terms of statistical view, with superiority values for Iasi genotypes, follows (2.82 mg·100 g−1 F.W. for chlorophyll A, 3.54 mg·100 g−1 F.W. for chlorophyll B and 5.6 mg·100 g−1 F.W. for xanthophyll (Table 4).
Upon analyzing the influence of genotypes on the chlorophyll A content, it is observed that there are no statistically significant differences, with values variation ranging between 0.86 mg·100 g−1 F.W. for G1 and 2.67 mg·100 g−1 F.W for G7.
The chlorophyll B content showed an obvious value that varies depending on the genotype, with significant differences between G7 and G1, G3, G5, G6, G7, and G8. Genotypes 3, 5, 6, 8, and 9 showed similar values of chlorophyll B (2.03-2.45) with insignificant differences (Table 4).
Genotype 7 is evidenced by a higher chlorophyll B content of 4.44 mg·100 g−1 F.W. and G1 with the lowest value of this compound of 1.13 mg·100 g−1 F.W. between those, there are statistically significant differences.
Upon analyzing the average xanthophyll content for the nine genotypes grown in the organic system, an oscillating amplitude is observed with a variation of the values that fall between the minimum of 0.89 mg·100 g−1 F.W. at G1 and a maximum of 6.31 mg·100 g−1 F.W. at G5 there are statistically significant differences between them.
It is also noted that are no statistical differences in xanthophyll content between G4 and G5 (6.31; 6.24 mg·100 g−1 F.W.), between G1, G3, and G6 (0.89; 1.53 and 1.26 mg·100 g−1 F.W.) and between G2 and G7 (1.84; 1.88 mg·100 g−1 F.W. (Table 4).
Regarding the combined influence of the studied factors (crop location or genotype) on the chlorophyll A content, a statistically significant variation of the average values is observed, with superiority values for variant Is-G7 with 4.74 mg·100 g−1 F.W. and the lowest value for variant Bc-G8 with 0.53 mg·100 g−1 F.W. The Is-G1; Bc-G6 as well as Bc-G4; Bc-G5 and Bc-G9 variants should be highlighted which showed very close values, without statistical differences. At the same time, excepting the variant Is-G1, which has a value very close to Bc-G6, all genotypes from Iasi showed higher values of chlorophyll A, B, and xanthophyll than those grown in Bacau. Results correlated with the values obtained for the carotene and lycopene content, which presented superior values for the genotypes cultivated in Bacau compared to those from Iasi (Table 5).
Upon analyzing the combined influence of the studied factors on the chlorophyll B content, it is found that they have left a significant mark on this index, causing significant differences for the same genotype grown in Iasi vs. Bacau, excepting Is-G1 and Bc-G1 which showed no statistical differences. Moreover, referring to the nine organic genotypes cultivated in Bacau, it is found that 5 of them (G1; G3; G7; G8, and G9) recorded very close values for the chlorophyll B content, which falls in the range 1.04–1.28 mg·100 g−1 F.W. without statistical differences as well as G4 and G5 with values between 2.14 and 2.18 mg·100 g−1 F.W. (Table 5).
The xanthophyll content of the genotypes grown in Iasi showed the superiority of values compared to the values obtained for genotypes grown in Bacau in the organic system. At the same time, the xanthophyll values for the genotypes from Iasi showed a statistically significant variation with the minimum limit of 1.28 mg·100g−1 F.W. and a maximum of 12.2 mg·100g−1 F.W. instead, the genotypes cultivated in Bacau showed very close values, falling very close values, falling in the range 0.41–0.76 mg·100g−1 F.W. of which G1, G2, G5, G6, G8 and G9 without statistical differences (Table 5).
In terms of chemical indicators such as total dry matter (TDM), total soluble solids (TSS), pH value, and total acidity (expressed in citric acid), it is found that the crop place determined statistical differences only for TDM with superiority values for genotypes cultivated in Iasi, respectively 12.95% vs. 7.63% (Table 6). Analyzing the average content of each parameter by statistical comparisons according to genotype, it is observed that the content in TDM and the pH value do not show statistical differences. In contrast, G2 and G3 showed statistical differences compared to the others, being noted for their superior content, with a maximum value of 6.83 °Brix. At the same time, G1, G6, and G7 showed very close values of 5.82–5.94 °Brix without statistical differences, as well as G4, G5, G8, and G9 with values between 5.29 and 5.74 °Brix.
Analyzing the combination of the two factors, the values of total dry matter (TDM) (Table 7) underline that the highest values were recorded on Iasi genotypes results, excepting G1 and G2 where the opposite can be observed with the highest value recorded of variant Is-G4 with 17.78% and the lowest value of Bc-G7 variant with 4.83%.
The total soluble solids (TSS) values registered variations both according to the crop location and genotype, so the highest values were recorded for the variants Is-G3 with a value of 6.86 °Brix and in Bc-G2 with a value of 6.82 °Brix. Upon analyzing the pH values, the highest value was obtained in the case of the Bc-G9 variant, respectively 5.36, and the lowest value was registered for the Is-G1 variant with 4.79 °Brix (Table 7).
Upon analyzing the data, it can be concluded that the pH values are homogeneous. From the point of view of the combined influence of the two factors, total acidity (TA) presented homogeneous results, the highest value being registered for the Is-G9 variant with 0.4 g acid citric·100 L−1 F.W. and the lowest value being registered for the Bc-G1 and Bc-G2 variants, both with a value of 0.15 g acid citric·100 L−1 F.W.

4. Discussion

One of the population’s core values is health and wellness [26], as evidenced by the increasing number of consumers who are concerned about the bioactive compound of what they eat and try to follow a healthful diet that can decrease chronic diseases and the risk of obesity [27]. Thus, many authors have focused on the study of the most appropriate strategies to overcome the antioxidant deficiency in human nutrition. In our experimental work, the aim was to investigate some improved sweet pepper genotypes cultivated in organic conditions so as to offer the richest genotypes in antioxidant compounds. The genotype and place of growing (Iasi vs. Bacau) influenced the content of lycopene, β–carotene, and vitamin C.
Regarding the analysis of carotenoid content, it can be mentioned that sweet pepper attracts the attention of researchers more and more due to their inherent nutritional characteristics, the possible role involved in the prevention and protection of degenerative diseases, and the fact that they are a natural food coloring.
The literature specifies that the carotenoid content varies between 0.87 to 3.23 mg·100 g−1 F.W. [25,28,29], and comparing with results from current research for the nine genotypes cultivated in Iasi and Bacau, the amount of β–carotene ranged from 0.18 to 10.08 mg·100 g−1 F.W. Based on these results it can be highlighted that the organically sweet peppers can be an ideal source for natural carotenoids. In the human body, plasma reference values for β–carotene are between 0.5 and 0.68 mg/L. Several studies indicate that there is a “cut-off” value of 0.23 mg/L, below which there is an increased risk of cardiovascular disease [30]. Sweet pepper grown in organic conditions could represent a main source of β–carotene, lycopene, ascorbic acid, and xanthophylls, especially 8 and 9 genotypes.
Carotenoids are a group of several hundred natural substances that act as yellow or red pigments in sweet pepper. β–carotene is the best-known carotenoid. It can be transformed in the intestinal mucosa into two molecules of retinal (vitamin A) under the action of the enzyme β–carotene 15,15‘–dioxygenase. However, many other carotenoids, including lycopene, which is responsible for the red color of peppers, are not precursors of vitamin A. Their basic structure always includes a set of conjugated double bonds responsible for the characteristic color. In addition, they have characteristic terminal groups, including beta-ionone and β–carotene, which give rise to retinal. Two major groups can be distinguished: xanthophylls, which are carotenoids with oxygen substituents (including lutein, zeaxanthin, and cryptoxanthin), and carotenes that do not contain oxygen, including alpha-, beta- carotene, and lycopene [31]. It is important to note that geometric isomers of carotenoids have distinct biological roles. Regarding the organically grown conditions of genotypes, it can be related that the high content of carotenoids found appears to be the strongest natural “O” deactivators, and this can be related to the length of the polyene chain. In this regard, lycopene appears to be one of the most effective derivatives due to its open and long polyene chain and the absence of oxygenated substituents [32].
Carotenoids are lipophilic C40 isoprenoids with polyene chains and different end groups (b, e, k). There are two groups of carotenoids classified into oxygen-free carotenes, such as ɑ-carotene and β–carotene, and oxygen-containing xanthophylls, such as β–cryptoxanthin, zeaxanthin, violaxanthin, and capsanthin [33,34]. These compounds are the main determinants of pepper color in several genotypes of the Capsicum genus [35], and the red-colored fraction contains two distinctive κ–xanthophylls known as capsanthin and capsorubin, pigments that are exclusively characteristic of this species [36], statements that are in agreement with the results of the present research considering that β–carotene showed average mean values seven times higher for Bacau genotypes compared to those harvested from Iasi and lycopene four times higher. Silveira T. et al., 2017 mentioned that selected Brazilian cultivars of peppers presented a higher content in β–carotene ranging between 10.3 mg·100 g−1 F.W. for cv Sarakura cultivars to 12.2 mg·100g−1 F.W. for red Jalapeno cultivars harvested in summer, grown in the field.
Lycopene is an antioxidant belonging to the carotenoid family that provides a distinctive red color to tomatoes, sweet peppers, hot peppers, fruit harrows, oranges, and apricots. Numerous studies have confirmed the benefits of this compound on human health in that it provides protection against chronic diseases, including various types of cancer [37]. Lycopene represents 60–74% of the carotenoids present in horticultural products. Lycopene has been mentioned to be a much stronger antioxidant than carotene and xanthophylls. However, lycopene content decreases with processing [38]. Capsanthin, β–carotene, lutein, and zeaxanthin have been confirmed as antioxidants because they show provitamin A activity [39]. The literature’s evidence also shows that ripe red pepper presents a higher antioxidant capacity than green fruits [40].
In the literature, it is specified the lycopene content of peppers that would vary between 0.27 and 0.40 mg·100 g−1 F.W. [41]; 0.18 and 0.33 mg·100 g−1 F.W. [42], but in current research, it was obtained higher values of lycopene with variation between 0.18 and 3.84 mg·100 g−1 F.W.
Vitamin C (C6H8O6) is a water-soluble vitamin found in plants, especially in fresh fruits and vegetables, particularly in peppers [43] which has an important function for the immune system, respectively in activating enzymes, reducing oxidative stress and many essential metabolic processes.
Vitamin C is one of the most important indicators of nutritional quality in many horticultural products, being known that pepper is characterized by a high content of ascorbic acid. The function of this antioxidant is to counteract the oxidative effects on lipids with the strong elimination of free radicals, the main oxidizing factor of oxidative changes. The limited availability of antioxidants in the human body can affect health. Normal plasma concentrations of vitamin C in the human body are between 6.2 to 15.2 mg/L for men and 8.6 to 18.8 mg. L for women. This difference is explained by the fact that women naturally consume more fruits and vegetables than men. The inferior plasma vitamin C levels of 25–30% with a limited value of 8.8 to 10.5 mg/L may be associated with a two-fold increased risk of cancer and cardiovascular disease [44]. Similarly, studies showed that there is a 1.5-fold increase in the relative risk of developing a myocardial infarction if the plasma vitamin C concentration is between 2.0 and 5.7 mg/L and a four-fold increase if the concentration is less than 2 mg/L. It must be emphasized that the researched improved genotypes, resistant to organic culture conditions, can represent the main food source of vitamin C considering the high percentage between 99.29 mg·100 g−1 to 2658.2 mg·100 g−1 and the acid character that stabilizes this antioxidant [45].
The vitamin C content of horticultural products can be influenced by various factors such as genotypic differences, pre-harvest climatic conditions, cultural practices, maturation stage, as well as harvesting methods, and post-harvest handling procedures [46]. The most common antioxidants present in vegetables are vitamins C and E, carotenoid compounds, flavonoids, and sulfur compounds, is known that plant products are the most important source of antioxidants [47].
According to specialized research, it was observed values of vitamin C content varied between 15.2 and 169 mg·100 g−1 F.W. [10,25,41,48,49]. Ascorbic acid from Jalapeno peppers grown in a greenhouse in Texas, USA, ranged between 69 and 119 mg·100 g−1 F.W. [50]. The values of ascorbic acid obtained in current research are between 99.29 and 265.82 mg·100 g−1 F.W.
The L-ascorbic acid content of the pepper genotypes studied varied depending on the genotype, agro-climatic conditions, and level of maturation. Thus, the values of L-ascorbic acid were in the lower delimited range of 115.5 mg·100 g−1 (G5) and upper of 239.75 mg·100 g−1 for G9 (Table 1). Analyzing the vitamin C content recorded by G5, the influence of both the climatic conditions and harvesting period can be noticed, with values of 99.29 mg·100 g−1 being recorded for the sample collected in July–Iasi vs. 131.74 mg·100 g−1–Bacau. Antioxidant values may be reported as Recommended Dietary Allowances as established by some international institutions. These are defined as the intake levels of essential nutrients that are considered adequate to meet the requirements for a particular nutrient for the consumer. Most studies on nutrients and antioxidant properties agree that, based on current RDA values, dietary antioxidant intake is generally adequate for healthy people. Large dietary surveys show that the intake of certain antioxidants is suboptimal or even downright deficient in certain population groups such as premature babies, pregnant women, those who are breastfeeding, growing children, the elderly or those from disadvantaged agri-food environments, smokers or people suffering from certain diseases [45]. Regarding the Recommended Daily Allowance (RDA), a 100 g serving of fresh sweet pepper could provide more than 100% RDA (60 mg) for vitamin C. Genotypes 9 from both culture areas (Iasi and Bacau) and genotypes 6, 7, and 8 from Bacau location have been shown to be exceptionally good because they exceeded more than 200% of RDA.
One of the main ways to increase the dietary intake of antioxidants can be obtained by increasing the number of vegetables and fruit consumption. In this sense, nutritionists estimate that in order to have a positive effect on health, it is required a minimum of five servings of 80 g of fruits and vegetables a day. The French National Nutrition and Health Plan recommended 2001 the consumption of 100 g of fruits and vegetables per day [45].
The external appearance of fruits, in particular, their color, has a primary importance when taking into account the various attributes that define quality, especially in the case of fruits intended for fresh consumption. The change in the color surface of the pepper is a result of chlorophyll degradation and a considerable increase in its carotenoid content, which is influenced by the temperature and lighting to which fruits were exposed.
Other research provides that chlorophyll A from peppers varies between 0.036 mg·100 g−1 F.W. [51] and 3.96 mg·100 g−1 F.W. [25], but in current research, it was observed higher values that follow between 0.46 and 4.47 mg·100 g−1 F.W. regarding chlorophyll B, in previous studies, there are values between 0.038 [51] and 8.96 mg·100 g−1 F.W. [25]. In the current research, the values followed between 1.04 and 7.7 mg·100 g−1 F.W. Analyzing the content of xanthophylls [51] specifies that he found an amount of 2.73 mg·100 g−1 F.W. and in current results, the values are between 0.39–12.2 mg·100 g−1 F.W.
The total dry matter values in previous research ranged between 8.14% [42], 13.3–15.05% [48], 16.2%, and 21.36% [49]. The values obtained in the current research framed in the mentioned interval ranged between 4.83 and 17.78%.
Previous studies it is mentioned that the amount of sugar values varied between 5.4 °Brix [14,49] to 6.66 °Brix [41] and 7.9 °Brix [52]. In the current research, the sugar values varied between 4.89 and 6.86 °Brix.
The pH values of peppers vary between 4.63 and 5 [41]. The pH values in the current research are framed between 4.78 and 5.36.
In the literature, the values of titratable acidity in peppers vary between 0.13 and 0.17 [41]; 1.62 [14], and in the current case, the values vary between 0.15 to 0.4 g acid citric·100 L−1 F.W.

5. Conclusions

The results of this study led to the development of some eco-innovative solutions to improve environmental sustainability by diversifying Solanaceae resources for the production of horticultural raw materials free of pesticide residues with a nutritional profile harmonized with the demands of the European market. Current research highlights the species Capsicum annum can represent one of the main sources of antioxidants, both by quantifying the intake through the product and by their bioavailability from organic plant resources.
These data confirm the influence of genotype and environmental conditions on the bioactive compounds of the improved Capsicum annum peppers evaluated. The genotypes react differently to the environmental conditions specific to the two crop locations (Is and Bc). Moreover, the experimental conditions during the vegetation period differ (soil composition, amount of precipitation, air temperature, humidity). The interaction between the two factors also differs, highlighting that for the Bacau area, it is claimed the growth in organic conditions of genotypes G8, G9, and G7, and for the Iasi area—the genotypes G1, G9, G6, and G7, due to the high concentrations of antioxidants. It is observed that G9 and G7 provide good results in both crop locations. Genotypes 8 and 9 grown in organic conditions present high antioxidant content due to high levels of β–carotene, lycopene, and vitamin C. Those genotypes of sweet peppers grown in organic conditions can be an ideal source for natural carotenoids. It also can be concluded that genotype 1 (yellow sweet pepper) presents the lowest average values in antioxidants. The climatic conditions specified in the two studied areas (Iasi vs. Bacau) influenced the antioxidant components with high values for genotypes from Bacau areas. The sweet pepper genotypes grown in Iasi areas showed high values for chlorophyll A, B, and xanthophylls.
In conclusion, it is important to follow the nutritional recommendations for the intake of antioxidants to aim for a healthy life. Sweet pepper (Capsicum annum) grown in organic conditions, especially G8, G9, and G7, represent sources of rich food in antioxidants, offering a developed potential.

6. Patents

Some of these nine improved sweet pepper are represented by lines being in the process of approval for patent purposes. From 2020 until now, two lines were approved by ISTIS.

Author Contributions

Conceptualization, C.B., P.M.B., and F.B.; methodology, O.C.M., C.B., and I.P.; software, G.-C.T.; validation, V.S., O.C.M., C.B., and P.M.B.; formal analysis, O.C.M. and M.M.C.; investigation, F.M.; resources, L.M.I., F.D.L., and F.M.; data curation, V.S. and G.-C.T.; writing—original draft preparation, O.C.M., P.M.B., C.B., and F.B.; visualization, V.S.; supervision, P.M.B.; project administration, M.M.C., C.B. and O.C.M. All authors have read and agreed to the published version of the manuscript.

Funding

The authors acknowledge the in-kind and cash support by the “Ion Ionescu de la Brad” Iasi University of Life Sciences from Romania and Vegetable Research and Development Station (VRDS), Bacau, Romania.

Institutional Review Board Statement

Not applicable.

Informed Consent Statement

Not applicable.

Data Availability Statement

The data presented in this study are available within the article.

Acknowledgments

This work was supported by a grant from the Romanian Minister of Research and Innovation, UEFISCDI, project number PN-III-P1-1.2-PCCDI-2017-0850/ contract 14 PCCDI /2018.

Conflicts of Interest

The authors declare no conflict of interest.

References

  1. Krasnow, C.; Ziv, C. Non-chemical approaches to control postharvest gray mold disease in bell peppers. Agronomy 2022, 12, 216. [Google Scholar] [CrossRef]
  2. FAOSTAT. 2019. Available online: http://www.fao.org/faostat/en/#data/QC (accessed on 20 January 2021).
  3. Murariu, F.; Voda, A.D.; Murariu, O.C. Researches on food safety assessment—Supporting a healthy lifestyle for the population from NE of Romania. J. Biotechnol. 2019, 5, S68. [Google Scholar] [CrossRef]
  4. Kaur, C.; Kapoor, H.C. Antioxidants in fruits and vegetables—The millennium’s health. Int. J. Food Tech. 2001, 36, 703–725. [Google Scholar] [CrossRef]
  5. Caruso, G.; Stoleru, V.; Munteanu, N.; Sellitto, V.M.; Teliban, G.C.; Burducea, M.; Țenu, I.; Morano, G.; Butnariu, M. Quality Performances of Sweet Pepper under Farming Management. Not. Botanic. Horti Agrobot. 2019, 47, 458–464. [Google Scholar] [CrossRef] [Green Version]
  6. Cevallos-Casals, B.A.; Byrne, D.; Okie, W.R.; Cisneros-Zevallos, L. Selecting new peach and plum genotypes rich in phenolic compounds and enhanced functional properties. Food Chem. 2006, 96, 273–280. [Google Scholar] [CrossRef]
  7. Irimia, L.M.; Patriche, C.V.; Murariu, O.C. The impact of climate change on viticultural potential and wine grape varieties of a temperate wine growing region. Appl. Ecol. Environ. Res. 2018, 16, 2663–2680. [Google Scholar] [CrossRef]
  8. Sreeramulu, D.; Raghunath, M. Antioxidant activity and phenolic content of roots, tubers and vegetables commonly consumed in India. Food Res. Int. 2010, 43, 1017–1020. [Google Scholar] [CrossRef]
  9. Chen, L.; Kang, Y.H. Anti-inflammatory and antioxidant activities of red pepper (Capsicum annum L.) stalk extracts: Comparison of pericarp and placenta extract. J. Funct. Food 2013, 5, 1724–1731. [Google Scholar] [CrossRef]
  10. Deepa, N.; Charanjit, K.; Binoy, G.; Balraj, S.; Kapoor, H.C. Antioxidant constituents in some sweet pepper (Capsicum annum L.,) genotypes during maturity. Swiss Soc. Food Sci. Tecnol. 2007, 40, 121–129. [Google Scholar] [CrossRef]
  11. Luning, P.A.; Rijk, T.; Wichers, J.; Roozen, J. Gas chromatography, mass spectrometry and sniffing port analyses of volatile compounds of fresh bell peppers (Capsicum annum) at different ripening stages. J. Agric. Food Chem. 1994, 42, 977–983. [Google Scholar] [CrossRef]
  12. Buendia Moreno, L.; Soto Jover, S.; Ros Chumillas, M.; Antolinos Lopez, V.; Navarro Segura, L. An innovative active cardboard for box bulk packaging of fresh bell pepper extends its shelf life. Postharvest Biol. Technol. 2020, 164, 111171. [Google Scholar] [CrossRef]
  13. Tylewicz, U.; Nowacka, M.; Rybak, K.; Drozdzal, K.; Marco, D.R.; Mozzon, M. Design of healthy snack based on kiwifruit. Molecules 2020, 25, 3309. [Google Scholar] [CrossRef] [PubMed]
  14. Guilherme, R.; Reboredo, F.; Guerra, M.; Ressurreição, S.; Alvarenga, N. Elemental Composition and Some Nutritional Parameters of Sweet Pepper from Organic and Conventional Agriculture. Plants 2020, 9, 863. [Google Scholar] [CrossRef] [PubMed]
  15. Ritota, M.; Marini, F.; Sequi, P.; Masimiliano, V. Metabolic characterization of Italian sweet pepper (Capsicum annum L.) by means of HRMAS-NMR spectroscopy and multivariate analyses. J. Agric. Food Chem. 2010, 58, 9675–9684. [Google Scholar] [CrossRef] [PubMed]
  16. Council Regulation (EC) 834/2007 on Organic Production and Labelling of Organic Products and Repealing Regulation (EEC) 2092/91. Available online: https://www.legislation.gov.uk/eur/2007/834 (accessed on 10 May 2019).
  17. Călin, M. The Management of Guidelines for Ecological Vegetable Cultures; Alma Mater: Bacau, Romania, 2020; p. 184. [Google Scholar]
  18. Dobrin, A.; Nedeluș, A.; Bujor, O.; Moț, A.; Zugravu, M.; Bădulescu, L. Nutritional quality parameters of the fresh red tomato varieties cultivated in the organic system. Scientific Papers. Series B. Horticulture 2019, 63, 439–443. [Google Scholar]
  19. Murariu, O.C.; Brezeanu, C.; Jităreanu, D.C.; Robu, T.; Irimia, L.M.; Trofin, A.; Popa, L.; Stoleru, V.; Murariu, F.; Brezeanu, P.M. Functional quality of improved tomato genotypes grown in the open field and plastic tunnel under organic farming. Agriculture 2021, 7, 609. [Google Scholar] [CrossRef]
  20. Jones, E.; Hughes, R.E. Foliar ascorbic acid in some angiosperms. Phytochemistry 1983, 22, 2493–2499. [Google Scholar] [CrossRef]
  21. Mackinney, G. Absorption of light by chlorophyll solutions. J. Biolog. Chem. 1941, 140, 315–322. [Google Scholar] [CrossRef]
  22. AOAC. Official Methods of Analysis of AOAC International, 17th ed.; AOAC: Gaithersburg, MD, USA, 2000. [Google Scholar]
  23. AOAC. Official Methods of Analysis of AOAC International, 21st ed.; AOAC: Gaithersburg, MD, USA, 2005. [Google Scholar]
  24. Coxam, V.; Davicco, M.J.; Demigne, C. Nutrition et metabolism osseux. In Aliments Fonctionnels, 2nd ed.; Lavoisier: Paris, Franch, 2008; Chapter 25; pp. 729–798. [Google Scholar]
  25. Perez-Lopez, A.J.; Moises del Amor, F.; Serrano-Martinez, A.; Fortea Maria, I.; Nunez-Delicado, E. Influence of agricultural practices on the quality of sweet pepper fruits as affected by the maturity stage. J. Sci. Food Agric. 2007, 87, 2075–2080. [Google Scholar] [CrossRef]
  26. Schiffman, L.G.; Kanuk, L.L. Consumer Behaviour, 10th ed.; Prentice Hall: Upper Saddle River, NJ, USA, 2009. [Google Scholar]
  27. Hyun-Joo, L.; Zee-Sun, Y. Consumers’ perceptions of organic food attributes and cognitive and affective attitudes as determinants of their purchase intentions toward organic food. Food Qual. Prefer. 2015, 39, 259–267. [Google Scholar]
  28. Hallman, E.; Rembiałkowska, E. Characterisation of antioxidant compounds in sweet bell pepper (Capsicum annum L.) under organic and conventional growing systems. J. Sci. Food Agric. 2012, 92, 2409–2415. [Google Scholar] [CrossRef]
  29. Szafirowska, A.; Elkner, K. Yielding And Fruit Quality Of Three Sweet Pepper Cultivars From Organic And Conventional Cultivation. Veg. Crop. Res. Bull. 2008, 69, 135–143. [Google Scholar] [CrossRef]
  30. Gey, K.F. Optimum plasma levels of antioxidant micronutrients—Ten years of antioxidant hypothesis on atherosclerosis. Bible. Nutr. Diet 1994, 51, 84–89. [Google Scholar]
  31. Rao, A.V.; Agarwal, S. Role of lycopene as antioxidant carotenoid in the prevention of chronic diseases: A review. Nutr. Res. 1999, 19, 305–323. [Google Scholar] [CrossRef]
  32. Gerster, H. The potential role of lycopene for human health. J. Am. Coll. Nutr. 1997, 16, 109–126. [Google Scholar] [CrossRef] [PubMed]
  33. Britton, G.; Liaaen-Jensen, S.; Pfander, H. Corotenoids 1A. Isolation and Analysis; Birkhauser: Basel, Switzerland; Boston, MA, USA; Berlin, Germany; 328p.
  34. Tânia da Silveira, A.C.; Ismael da Silva, G.; Palhares de Melo, L.A.M.; Reifschneider, F.J.B. Carotenoid and total vitamin C of peppers from selected Brazilian cultivars. J. Food Compos. Anal. 2017, 57, 73–79. [Google Scholar] [CrossRef]
  35. Ha, S.H.; Kim, J.B.; Park, J.S.; Lee, S.W.; Cho, K.J. A comparison of the carotenoid accumulation in Capsicum varieties that show different ripening colours: Deletion of the capsanthin-capsorubin synthase gene is not a prerequisite for the formation of yellow pepper. J. Exp. Bot. 2007, 58, 3135–3144. [Google Scholar] [CrossRef] [Green Version]
  36. Hornero-Méndez, D.; Gómez-Ladrón De Guevara, R.; Minguez-Mosquera, M.I. Carotenoid biosynthesis changes in five red pepper (Capsicum annum L.) cultivars during ripening, Cultivar selection for breeding. J. Agric. Food Chem. 2000, 48, 3857–3864. [Google Scholar] [CrossRef]
  37. Jatau, S.H.; Sokoto, M.A.; Almustapha, M.N.; Muhammad, C.; Dabai, M.U.; Zubairu, A.Y. Effect Of Heat On Lycopene Content Of Hot Peppers (Capsicum Annum) Using Various Processing Temperature. Int. J. Sci. Eng. Technol. 2018, 14, 2. [Google Scholar]
  38. Novelina; Nazir, N.; Adrian, M.R. The Improvement Lycopene Availability and Antioxidant Activities of Tomato (Lycopersicum esculentum, Mill) Jelly Drink. Agric. Agric. Sci. Procedia 2016, 9, 328–334. [Google Scholar] [CrossRef] [Green Version]
  39. Müller, L.; Frohlich, K.; Bohm, V. Comparative antioxidant activities of carotenoids measured by ferric reducing antioxidant power (FRAP), ABTS bleaching assay (aTEAC), DPPH assay and peroxyl radical scavenging assay. Food Chem. 2011, 129, 139–148. [Google Scholar] [CrossRef]
  40. Cervantez-Paz, B.; Yahia, E.M.; Ornelas-Paz, J.J.; Gardea-Be’Jar, A.A.; Ibarra-Junquera, V.; Perez-Martinez, J.D. Effect of heat processing on the profile of pigments and antioxidant capacity of green and red Jalapeno peppers. J. Agric. Food Chem. 2012, 60, 10822–10833. [Google Scholar] [CrossRef] [PubMed]
  41. Abu-Zahra, T. Influence of Agricultural Practices on Fruit Quality of Bell Pepper. Pak. J. Biol. Sci. 2011, 14, 876–881. [Google Scholar] [CrossRef] [PubMed] [Green Version]
  42. Hallmann, E.; Rembiałkowska, E. The Content of Selected Antioxidant Compounds in Bell Pepper Varieties from Organic and Conventional Cultivation Before and After Freezing Process. 16th IFOAM Organic World Congress. 2008, pp. 1–4. Available online: http://orgprints.org/12516 (accessed on 20 January 2021).
  43. Hamed, M.; Kalita, D.; Bartolo, M.; Jayanty, S.S. Capsaicinoids, polyphenols and antioxidant activities of Capsicum annum: Comparative study of the effect of ripening stage and cooking methods. Antioxidants 2019, 8, 364. [Google Scholar] [CrossRef] [PubMed]
  44. Gey, K.F. Vitamins E plus C and interacting co-nutrients are required for optimal health. A critical and constructive review of epidemiology and supplementation data regarding cardiovascular disease and cancer. Biofactors 1998, 7, 113–174. [Google Scholar]
  45. Neve, J.; Pincemail, J. Antioxydants alimentaires: Vitamins, oligoelements et non-nutriments. In Aliments Fonctionnels, 2nd ed.; Lavoisier: Paris, Franch, 2008; pp. 8203–8241. [Google Scholar]
  46. Lee, S.K.; Kader, A.A. Preharvest and postharvest factors influencing vitamin C content of horticultural crops. Postharvest Biol. Technol. 2000, 20, 207–220. [Google Scholar] [CrossRef] [Green Version]
  47. Willett, W.C. Diet and health; What should we eat. Science 1994, 264, 532–537. [Google Scholar] [CrossRef] [Green Version]
  48. Topuz, A.; Ozdemir, F. Assessment of carotenoids, capsaicinoids and ascorbic acid composition of some selected pepper cultivars (Capsicum annum L.) grown in Turkey. J. Food Compos. Anal. 2007, 20, 596–602. [Google Scholar] [CrossRef]
  49. Chassy, W.A.; Bui, L.; Renaud, N.C.E.; Van Horn, M.; Mitchell, A. Three-Year Comparison of the Content of Antioxidant Microconstituents and Several Quality Characteristics in Organic and Conventionally Managed Tomatoes and Bell Peppers. Agric. Food Chem. 2006, 54, 8244–8252. [Google Scholar] [CrossRef]
  50. Bae, H.; Jayaprakasha, G.K.; Crosby, K.; Yoo, K.S.; Leskovar, D.I.; Jifon, D.I.; Patil, B.S. Ascorbic acid, capsaicinoid and flavonoid aglycone concentration as a function of fruit maturity stage in greenhouse-grown peppers. J. Food Compos. Anal. 2014, 33, 195–202. [Google Scholar] [CrossRef]
  51. Hong-Gi, K.; Jong-Hyang, B.; Jastrzebski, Z.; Cherkas, A.; Buk-Gu, H.; Gorinstein, S.; Yang-Gyu, K. Binding, Antioxidant and Anti-proliferative Properties of Bioactive Compounds of Sweet Paprika (Capsicum annum L.). Plant Foods Hum. Nutr. 2016, 71, 129–136. [Google Scholar] [CrossRef]
  52. Shahein, M.M.; Hassan, H.A.; Abou-El-Hassan, S. Response Of Sweet Pepper Plants To Fertilize By Different Organic Fertilizers Under Protected Agriculture. J. Plant Prod. 2015, 6, 809–822. [Google Scholar] [CrossRef]
Figure 1. The sample analyzed represented by improved Capsicum annum genotypes: (a) G1–Genotype 1; (b) G2–Genotype 2; (c) G3–Genotype 3; (d) G4–Genotype 4; (e) G5–Genotype 5; (f) G6–Genotype 6; (g) G7–Genotype 7; (h) G8–Genotype 8; (i) G9–Genotype 9.
Agriculture 12 01863 g001aAgriculture 12 01863 g001b
Table 1. The monthly average value of the main meteorological factors of the experimental period (2019–2020).
PeriodAverage Temperature (°C)Atmospheric Humidity (%)Rainfall (mm)
201920202019202020192020
BcIsBcIsBcIsBcIsBcIsBcIs
May16.416.614.3814.476.47472.667114.674.9110.8130.5
June22.222.720.821.378.56677.07158.78.452.499.0
July21.222.021.3822.176.46776.66164.23.864.87.9
August21.822.122.3923.669.06767.95421.235.119.08.8
September16.116.918.2619.570.32973.66075.351.078.624.2
October10.911.413.714.179.47784.68368.724.780.375.4
Location Average/Sum18.118.618.4519.1675.0063.3375.3866.00402.7197.9405.9345.8
Bc–Bacau; Is–Iasi.
Table 2. The influence of the crop place and genotypes on the antioxidant compounds.
Variantβ–Carotene
mg·100 g−1 F.W.
Lycopene
mg·100 g−1 F.W.
Vitamin C
mg·100 g−1 F.W.
Crop place
Is0.68 ± 0.070.51 ± 0.05168.35 ± 8.23
Bc4.79 ± 0.492.21 ± 0.27185.27 ± 10.97
**ns
Genotypes
G 11.48 ± 0.02 ns0.63 ± 0.02 ns167.85 ± 6.69 b
G 22.65 ± 1.03 ns1.71 ± 0.50 ns121.60 ± 5.76 c
G 31.59 ± 0.50 ns1.07 ± 0.04 ns152.01 ± 6.42 bc
G 42.15 ± 0.56 ns0.92 ± 0.33 ns134.23 ± 4.46 bc
G 52.76 ± 1.16 ns2.04 ± 0.80 ns115.51 ± 7.41 c
G 61.67 ± 0.43 ns0.70 ± 0.05 ns214.53 ± 7.33 a
G 72.98 ± 1.15 ns1.27 ± 0.43 ns235.11 ± 13.79 a
G 85.36 ± 2.11 ns2.76 ± 1.01 ns210.73 ± 15.02 a
G 93.96 ± 1.35 ns1.14 ± 0.27 ns239.75 ± 4.07 a
Is–Iasi; Bc–Bacau; G1–G9–Genotypes, *–significant differences; ns- non-significant; a–the highest value for the test performed. Within each column and within each experimental factor, different letters mean crop location and genotype differ significantly according to Duncan’s test at p ≤ 0.05.
Table 3. The combined influence of the crop place and genotype on the antioxidant compounds.
VariantΒ–Carotene
mg·100 g−1 F.W.
Lycopene
mg·100 g−1 F.W.
Vitamin C
mg·100 g−1 F.W.
G1Is 1.47 ± 0.04 g0.64 ± 0.01 gh165.51 ± 2.63 fg
Bc 1.48 ± 0.03 g0.62 ± 0.05 h170.19 ± 14.54 f
G2Is 0.35 ± 0.08 jk0.59 ± 0.02 h133.86 ± 3.11 hi
Bc4.95 ± 0.01 d2.82 ± 0.01 c109.34 ± 2.48 ij
G3Is 0.48 ± 0.02 ijk0.99 ± 0.02 f166.05 ± 2.75 fg
Bc 2.70 ± 0.02 f1.15 ± 0.06 f137.96 ± 1.04 h
G4Is0.90 ± 0.03 h0.18 ± 0.01 i126.19 ± 4.20 hi
Bc3.40 ± 0.03 e1.65 ± 0.03 e142.27 ± 4.13 gh
G5Is0.18 ± 0.00 k0.25 ± 0.01 i99.29 ± 3.31 j
Bc5.34 ± 0.03 c3.84 ± 0.03 b131.74 ± 0.78 hi
G6Is0.71 ± 0.01 hi0.58 ± 0.01 h199.52 ± 3.78 de
Bc2.63 ± 0.00 f0.81 ± 0.03 g229.54 ± 5.41 bc
G7Is0.41 ± 0.01 ijk0.30 ± 0.00 i204.39 ± 2.76 cd
Bc5.55 ± 0.02 c2.23 ± 0.08 d265.82 ± 0.52 a
G8Is0.64 ± 0.02 hij0.50 ± 0.01 h177.46 ± 1.12 ef
Bc10.08 ± 0.22 a5.01 ± 0.03 a244.00 ± 4.38 ab
G9Is0.94 ± 0.01 h0.53 ± 0.02 h242.92 ± 3.77 ab
Bc6.97 ± 0.03 b1.74 ± 0.04 e236.58 ± 7.65 b
Is–Iasi; Bc–Bacau; G1–G9–Genotypes, a–the highest value for the test performed. Within each column and within each experimental factor, different letters mean crop location and genotype differ significantly according to Duncan’s test at p ≤ 0.05.
Table 4. The influence of the crop place and genotypes on chlorophyll and xanthophylls content.
VariantChlorophyll A
mg·100 g−1 F.W.
Chlorophyll B
mg·100 g−1 F.W.
Xanthophylls
mg·100 g−1 F.W.
Crop place
Is2.82 ± 0.223.54 ± 0.355.60 ± 0.78
Bc0.83 ± 0.061.52 ± 0.090.55 ± 0.03
***
Genotypes
G 10.86 ± 0.04 b1.13 ± 0.03 c0.89 ± 0.17 b
G 21.84 ± 0.62 ab3.28 ± 0.72 ab1.84 ± 0.61 ab
G 32.57 ± 0.87 ab2.03 ± 0.43 bc1.53 ± 0.34 b
G 41.88 ± 0.31 ab2.89 ± 0.32 abc6.31 ± 2.64 a
G 51.51 ± 0.16 ab2.09 ± 0.03 bc6.24 ± 2.52 a
G 61.57 ± 0.28 ab2.14 ± 0.10 bc1.26 ± 0.26 b
G 72.67 ± 0.92 a4.49 ± 1.44 a1.88 ± 0.67 ab
G 81.53 ± 0.45 ab2.26 ± 0.54 bc4.16 ± 1.65 ab
G 92.01 ± 0.38 ab2.45 ± 0.53 bc3.52 ± 1.31 ab
Is–Iasi; Bc–Bacau; G1–G9–Genotypes, *–significant differences; a–the highest value for the test performed. Within each column and within each experimental factor, different letters mean crop location and genotype differ significantly according to Duncan’s test at p ≤ 0.05.
Table 5. The combined influence of the crop place and genotypes on the color indices.
VariantChlorophyll A
mg·100 g−1 F.W.
Chlorophyll B
mg·100 g−1 F.W.
Xanthophyll
mg·100 g−1 F.W.
G1Is 0.94 ± 0.02 i1.16 ± 0.02 jk1.28 ± 0.01 h
Bc 0.77 ± 0.02 j1.10 ± 0.06 jk0.50 ± 0.02 jk
G2Is 3.22 ± 0.06 c4.89 ± 0.06 b3.21 ± 0.02 e
Bc0.46 ± 0.02 l1.67 ± 0.06 i0.47 ± 0.01 jk
G3Is 4.52 ± 0.06 b2.97 ± 0.09 d2.30 ± 0.01 f
Bc 0.62 ± 0.01 k1.08 ± 0.18 jk0.76 ± 0.03 i
G4Is2.57 ± 0.01 e3.61 ± 0.04 c12.20 ± 0.11 a
Bc1.18 ± 0.03 h2.18 ± 0.04 fg0.41 ± 0.05 l
G5Is1.85 ± 0.03 g2.04 ± 0.05 gh11.87 ± 0.24 b
Bc1.16 ± 0.05 h2.14 ± 0.03 g0.61 ± 0.04 jk
G6Is2.18 ± 0.05 f2.36 ± 0.02 e1.83 ± 0.09 g
Bc0.96 ± 0.09 i1.91 ± 0.06 h0.69 ± 0.03 jk
G7Is4.74 ± 0.04 a7.70 ± 0.03 a3.38 ± 0.10 e
Bc0.61 ± 0.02 k1.28 ± 0.04 j0.39 ± 0.07 l
G8Is2.53 ± 0.03 e3.47 ± 0.06 c7.84 ± 0.15 c
Bc0.53 ± 0.01 kl1.04 ± 0.03 k0.48 ± 0.04 jk
G9Is2.85 ± 0.04 d3.62 ± 0.14 c6.45 ± 0.18 d
Bc1.16 ± 0.01 h1.28 ± 0.02 j0.60 ± 0.08 jk
Is–Iasi; Bc–Bacau; G1–G9–Genotypes; a–the highest value for the test performed. Within each column and within each experimental factor, different letters mean crop location and genotype differ significantly according to Duncan’s test at p ≤ 0.05.
Table 6. The influence of crop place and genotypes on the physicochemical parameters.
VariantTDM,
%
TSS
°Brix
pHTA
g Acid Citric·100 L−1 F.W.
Crop place
Is12.95 ± 0.446.12 ± 0.105.11 ± 0.070.26 ± 0.02
Bc7.63 ± 0.475.72 ± 0.135.23 ± 0.020.25 ± 0.02
*nsnsns
Genotypes
G111.20 ± 0.29 ns5.94 ± 0.06 bc5.04 ± 0.25 ns0.18 ± 0.03 b
G210.93 ± 0.32 ns6.65 ± 0.08 ab5.15 ± 0.03 ns0.17 ± 0.01 b
G39.98 ± 1.31 ns6.83 ± 0.04 a5.03 ± 0.08 ns0.28 ± 0.01 ab
G413.25 ± 2.03 ns5.29 ± 0.03 c5.21 ± 0.01 ns0.24 ± 0.02 ab
G510.22 ± 1.98 ns5.74 ± 0.14 c5.44 ± 0.13 ns0.21 ± 0.01 ab
G68.44 ± 1.15 ns5.92 ± 0.06 bc5.19 ± 0.05 ns0.29 ± 0.04 ab
G78.90 ± 1.82 ns5.82 ± 0.42 bc5.20 ± 0.04 ns0.32 ± 0.01 a
G810.19 ± 1.72 ns5.54 ± 0.28 c5.09 ± 0.09 ns0.31 ± 0.04 a
G99.53 ± 1.29 ns5.61 ± 0.04 c5.22 ± 0.06 ns0.30 ± 0.06 ab
Is–Iasi; Bc–Bacau; G1–G9–Genotypes, *–significant differences; ns- non-significant; a–the highest value for the test performed. Within each column and within each experimental factor, different letters mean crop location and genotype differ significantly according to Duncan’s test at p ≤ 0.05.
Table 7. The combined influence of the crop place and genotypes on the physicochemical parameters.
VariantTDM
%
TSS
°Brix
pHAT
g Acid Citric·100 L−1 F.W.
G1Is 10.59 ± 0.10 f5.95 ± 0.09 def4.78 ± 0.51 b0.20 ± 0.06 cd
Bc 11.81 ± 0.21 de5.93 ± 0.09 def5.29 ± 0.01 ab0.15 ± 0.01 d
G2Is 10.29 ± 0.01 f6.47 ± 0.01 bc5.08 ± 0.01 b0.20 ± 0.01 cd
Bc11.57 ± 0.34 de6.82 ± 0.06 a5.21 ± 0.01 ab0.15 ± 0.00 d
G3Is 12.89 ± 0.05 c6.86 ± 0.09 a4.86 ± 0.00 b0.26 ± 0.00 bcd
Bc 7.06 ± 0.21 h6.80 ± 0.01 ab5.20 ± 0.02 ab0.30 ± 0.02 abc
G4Is17.78 ± 0.24 a5.26 ± 0.04 ij5.19 ± 0.01 b0.27 ± 0.01 abcd
Bc8.73 ± 0.12 g5.32 ± 0.05 hi5.23 ± 0.00 ab0.20 ± 0.01 cd
G5Is14.63 ± 0.20 b6.04 ± 0.02 de5.72 ± 0.03 ab0.21 ± 0.01 cd
Bc5.80 ± 0.06 j5.44 ± 0.06 hi5.16 ± 0.01 ab0.20 ± 0.01 cd
G6Is11.00 ± 0.13 ef6.03 ± 0.04 de5.29 ± 0.04 ab0.20 ± 0.01 cd
Bc5.87 ± 0.12 ij5.80 ± 0.04 efg5.08 ± 0.01 ab0.37 ± 0.01 ab
G7Is12.96 ± 0.06 c6.75 ± 0.12 ab5.12 ± 0.01 ab0.33 ± 0.01 abc
Bc4.83 ± 0.06 k4.89 ± 0.05 k5.28 ± 0.01 ab0.30 ± 0.01 abc
G8Is14.03 ± 0.16 b6.16 ± 0.04 cd4.89 ± 0.02 ab0.23 ± 0.00 cd
Bc6.34 ± 0.11 hij4.93 ± 0.06 jk5.29 ± 0.01 ab0.39 ± 0.01 ab
G9Is12.39 ± 0.24 cd5.62 ± 0.08 fgh5.08 ± 0.02 ab0.40 ± 0.08 a
Bc6.66 ± 0.04 hi5.59 ± 0.05 gh5.36 ± 0.01 a0.20 ± 0.01 cd
Is–Iasi; Bc–Bacau; G1–G9–Genotypes, a–the highest value for the test performed. Within each column and within each experimental factor, different letters mean crop location and genotype differ significantly according to Duncan’s test at p ≤ 0.05.
Publisher’s Note: MDPI stays neutral with regard to jurisdictional claims in published maps and institutional affiliations.

