

New Microsatellite Markers for the Model Coral Species Stylophora pistillata from Eilat, the Red Sea

1
Israel Oceanographic and Limnological Research, National Institute of Oceanography, Haifa 3109701, Israel
2
Department of Marine Biology, Leon H. Charney School of Marine Sciences, University of Haifa, Mount Carmel, Haifa 3498838, Israel
*
Authors to whom correspondence should be addressed.
J. Mar. Sci. Eng. 2023, 11(2), 244; https://doi.org/10.3390/jmse11020244
Submission received: 11 December 2022
/
Revised: 10 January 2023
/
Accepted: 16 January 2023
/
Published: 18 January 2023
(This article belongs to the Special Issue Feature Papers in Marine Biology)
Abstract
:Nineteen microsatellite loci, obtained by the whole genome sequencing approach, were developed and validated for the ‘smooth cauliflower’ coral Stylophora pistillata, a widespread Indo Pacific branching coral species. A sample size of 40 colonies collected at five reef sites along the northern Gulf of Eilat, the Red Sea, were genotyped, revealing loci reproducibly and suitable outcomes for wide applications, including population genetic studies. The 19 new microsatellite loci in this sample were composed of 4–20 alleles/locus, of which 10 microsatellites are highly polymorphic (≥10 alleles/locus). The observed and expected heterozygosity ranged between 0.289 and 0.957 (mean 0.597) and 0.101 and 0.911 (mean 0.726), respectively, and the Fixation Index (F), which also indicates the inbreeding coefficient, ranges between −0.174 and 0.569 (mean 0.207). The polymorphic information content (PIC) ranges between 0.100 and 0.904 (mean 0.699). This new set of microsatellite loci will be employed for population genetics studies as for identifying the distribution of various genotypes within S. pistillata chimeras.
1. Introduction
The ‘smooth cauliflower’ coral Stylophora pistillata (Esper 1797), a common and widespread Indo Pacific branching coral species of the family Pocilloporidae, has served from the late 1980s as a model coral reef species for a wide range of basic and applied studies (Figure 1) [1]. As a key species in many Indo Pacific reefs, the decades-long accrued studies on S. pistillata’s distributions and its reproductive mode (e.g., [2]) have led researchers to investigate other biological and ecological facets of this species such as population dynamics, population genetics, and larval dispersal on small and large geographic scales [3,4,5,6,7,8,9], as well as studies focusing on active reef restoration, where S. pistillata has being suggested as the preferred model species for evaluating the population dynamics parameters (e.g., [10,11,12,13,14,15,16]).
Clearly, the employment of microsatellite alleles, or other genetic markers, on various S. pistillata populations, on small recruits, and larvae under field scenarios, may further reveal connectivity and genetic flow processes and patterns [3,4,8]. Yet, as there are no detailed population genetics studies that use highly polymorphic markers, the development of efficient and inexpensive population genetics tools is of prime importance. A single study [17] has developed a panel of 17 specific microsatellites loci for population and phylogeographic studies in S. pistillata from the central Red Sea. While only three loci in this set of microsatellite loci are highly polymorphic (≥10 alleles/locus), the usefulness of the available microsatellites has been demonstrated by the identification of various genotypes within S. pistillata chimeras [8,18], yet not in population genetics analyses.
For the improved understanding of S. pistillata population genetic structures, and the evaluation of connectivity between sites throughout the Indo Pacific region, there is a need for additional highly polymorphic microsatellite markers. Using a whole genome sequencing approach through new generation sequencing (NGS) technology, this study presents the development of 19 microsatellite loci new for S. pistillata colonies from the northern Gulf of Eilat, the Red Sea, of which 10 loci are highly polymorphic (≥10 alleles/locus), all revealing clean and reproducible amplifications.
2. Materials and Methods
2.1. Genomic DNA Extraction and NGS Sequencing
A colony of Stylophora pistillata was collected from the Israeli northern Gulf of Eilat (N 29°32′34.843″ E 34°58′24.88″, 12 m depth), brought to the laboratory at the National Institute of Oceanography at Haifa, Israel and was inserted in a 17 L running sea water aquarium at 25 °C for 8 days under dark conditions (covered with aluminum foil) to reduce the numbers of algal symbionts. Then, small branch samples from the branch tips were clipped off, placed in one 1.5 mL vial containing 240 μL of lysis buffer [19], homogenized, and the DNA was extracted with equal volumes of phenol/chloroform/isoamyl-alcohol, 240 μL, 25:24:1 ratio). The vials were vortexed (10 min), centrifuged (10 min at 14,000× g 4 °C), and then the aqueous solution was transferred to new vials and equal volumes of chloroform/isoamyl-alcohol (24:1 ratio) were added, mixed, and centrifuged again. The upper phases, containing the DNA, were treated with 2 μL of RNAse A (10 mg/mL) to remove RNA contaminations (30 min, 37 °C), followed by phenol/chloroform extractions. The upper phases were transferred to new vials and two volumes of 100% ethanol were added for DNA precipitation. DNA was spooled out from each vial using a glass capillary and washed by dipping in 70% ethanol. The DNA was dried and resuspended in 50 μL of sterilized double distillated water (DDW). The integrity and the quantity of the genomic DNA was checked on a 0.8% agarose gel and NanoDrop 2000 (Thermofisher, Waltham, MA, USA).
The coral genomic DNA was checked for the existence of algal symbionts DNA by using rbcL primers following Amar et al. [20]. A total of 6 μg (20 μL, 300 ng/μL) of the uncontaminated, purified coral genomic DNA was sent to Macrogen Inc. (Seoul, Republic of Korea) for sequencing and assembling using the Roche 454 titanium GS-FLX plus Titanium pyrosequencing platform [21,22].
2.2. Primers Design for Microsatellites
The sequencing reads were screened for short nucleotide tandem repeats (STRs, di-, tri-, and tetranucleotides, >8 repeats), using MSATCOMMANDER version 0.8.1 software [23]. The software primer3 imbedded in MSATCOMMANDER was used to design sets of forward and reverse primers, flanking the STR repeats which will be used for PCR amplifications. One primer in each set included a M13 short sequence (GGAAACAGCTATGACCA, Table 1). The additional four primers of the M13 sequence were labeled with either VIC, FAM, NED, or PET fluorescent dyes (e.g., PET-GGAAACAGCTATGACCA, ThermoFisher). The sets of three primers (forward, revere, and labeled M13) were used for PCR amplifications of the genomic DNA samples.
2.3. Stylophora Pistillata Sampling
Tissue samples of 40 S. pistillata colonies were collected by SCUBA from 4 reef sites at the Israeli Gulf of Eilat. During the dive, a branch tip (about 1 cm3) of a mature colony (estimated diameter greater than 15 cm) was clipped with electrician clippers and placed in 5 mL vials with its surrounding sea water. Eight samples were collected at the Kisoski beach (29°32′49.98″ N, 34°57′14.78″ E) at depths down to 12 m. From the underwater observatory beach (29°30′12.57″ N, 34°55′7.55″ E), 8 samples were collected at depths down to 12 m. At the Lighthouse beach (29°30′2.76″ N, 34°54′58.89″ E), 16 samples were collected at a shallow dive down to 12 m and an additional set of 8 samples was collected from a 26 m to 40 m depth. All the samples were transferred, separately, into 1.5 mL vials containing 200 µL of lysis buffer, 40 µL of sodium perchlorate, and 240 µL of phenol chloroform isoamyl alcohol (PCI) [19], homogenized, and extracted with 240 µL of phenol/chloroform. The DNA was extracted as described above, except for the last steps where the DNA samples were precipitated in 100% ethanol, centrifuged at 14,000× g, 4 °C, 30 min, washed twice with 70% ethanol, re-suspended in DDW, and kept in a cold room until they were used.
2.4. Microsatellite Amplification and Analysis
Microsatellite alleles for each DNA sample were amplified according to [24] in 20 µL of the total volume containing 2 μL of total DNA (diluted 1:50 with DDW), three primers, the forward and reverse primers and the fluorescence M13 primers (different dyes were used for different reactions, 0.8 pmol of each primer, Table 1), and 10 μL of ready-to-use commercial Taq polymerase mixture. The PCR conditions were as follows: 94 °C (5 min), followed with 30 cycles at 94 °C (30 s), 56 °C (45 s), and 72 °C (45 s), an additional 8 cycles of 94 °C (30 s), 53 °C (45 s), and 72 °C (45 s), and a final extension at 72 °C for 10 min. The fluorescent-labeled PCR products were examined in an agarose gel (1.5%). Positive PCR products were analyzed in a sequence analysis system (Applied Biosystems ABI PRISM 3100 Genetic Analyzer; the University of Cambridge, the UK) as follows: 0.25 μL of each amplification product were mixed with 0.4 μL of LIZ size standard (MepMarker DY632, 50–500 bp, BioVenture Inc. Murfreeboro, TN, USA) and 8.6 μL of HiFi Formamide (ThermoFisher). The fluorescent amplification products were scored using the genotyping software GeneMapper and Peak Scanner Version 1.0 Software (Applied Biosystems).
2.5. Data Analysis
The raw data generated by the microsatellites genotyping process were analyzed and binned using an Excel Macro, AutoBin 0.9, written in Microsoft Visual Basic (VBA) by Franck Salin (INRA Pierroton-UMR BIOGECO). The binned alleles of each locus were further analyzed using Micro-cheker [25], a software for scoring errors and potential null alleles. GenAlex6.5 [26] was used for calculating the observed heterozygosity (Ho), expected heterozygosity (He), Fixation index (F), allele numbers, and frequencies. Polymorphic information content (PIC) by locus was estimated by Cervus version 3.0.7 [27]. Hardy–Weinberg equilibrium and Linkage disequilibrium were calculated using “Genepop on the web” (https://genepop.curtin.edu.au/index.html, accessed on 10 December 2022, [28]), GeneAlEx6.5 and Alequin ver. 3.5 [29].
3. Results
3.1. Next Generation Sequencing Results
Sequencing using high-throughput technology resulted in 153,916 reads with an average read length of 732 bp (total of 112,686,846 bp). Most read sizes were distributed between 600 and 950 bp. The sequence reads were assembled into 16,060 contigs and 82,743 singletons.
3.2. Scanning for Short Tandem Repeats and Primers Design
The scanning of the 153,916 sequences reads with MSATCOMMANDER software for reads with short tandem repeats (STRs) resulted with 10606 reads (ca 7%). Restricting the STR screening for reads containing >10 repeats of di, tri, and tetra-nucleotides revealed a total of 2060 sequences (879 sequences of di-nucleotides, 910 sequences of tri-nucleotides, and 271 sequences of tetra nucleotides), of which 20 sets of forward and revers primers were designed for 20 reads (7, 7, and 6 sequences for di, tri, and tetra-nucleotides, respectively; Table 1) and were used for the PCR amplification of the 40 DNA samples of the corals collected in Eilat.
3.3. Microsatellites’ Statistical Analysis
The 20 novel microsatellites primers were employed on the 40 S. pistillata DNA samples from the Gulf of Eilat. The new set of the microsatellite’s loci revealed 4 to 20 alleles/locus and 10 loci that contain ≥10 alleles/locus. Polymorphic information content (PIC) ranged between 0.100 (4 alleles) and 0.904 (20 alleles, mean 0.699) (Table 2).
The basic statistical analysis of the coral population (Table 2) with the 19 microsatellite loci using GenAlex6.5 (one marker, No. SP_18 GenBank accession numbers OP851538, failed to amplify and was excluded from further analysis) revealed observed heterozygosity ranging from 0.289 to 0.957 (mean 0.597 ± 0.057) and expected heterozygosity ranging from 0.101 to 0.911 (mean 0.726 ± 0.044). The Fixation index (F), which is also an estimate of the inbreeding coefficient, ranged between -0.174 and 0.569 (mean 0.207 ± 0.049). Fourteen loci show a significant deviation from the Hardy–Weinberg equilibrium (p < 0.01 or p < 0.001) and 12 loci show signs of a null allele (Table 2). Four pairs (SP_10/SP_1, SP_5/SP_1, SP_5/SP_19, and SP_13/SP_7) out of 171 paired loci comparisons show a significant linkage disequilibrium.
4. Discussion
In this study, we developed a new set of molecular markers, 19 new and highly polymorphic microsatellites loci for the branching coral species Stylophora pistillata (Esper 1797) from Eilat, by using a whole genome sequencing approach with the Roche 454 titanium GS-FLX plus Titanium pyrosequencing platform. The microsatellites markers developed for this study will be used, together with the former developed microsatellites [17], for detailed biological studies on this species, such as identifying the distributions of various genotypes within S. pistillata chimeras [30]. The new set of microsatellite loci further improves ongoing studies on the S. pistillata population genetics, aiming to determine the levels of population genetics differentiation and gene flow among colonies of S. pistillata in the northern Gulf of Eilat. The current new set of microsatellite loci may further improve the S. pistillata population genetics analyses due to the appearance of 10 highly polymorphic loci, each containing ≥10 alleles/locus. Yet, the preliminary analysis of the 40-sample colony collected in this study indicates a deviation from the Hardy–Weinberg equilibrium, probably due to the presence of null alleles, an outcome that should be considered in future studies.
Author Contributions
Conceptualization, B.R., writing—original draft preparation, J.D.; writing—review and editing, J.D., B.R. and E.N.R.; technical work J.D. and E.N.R.; supervision and funding acquisition, B.R. All authors have read and agreed to the published version of the manuscript.
Funding
This research was funded by the ISF (number 3511/21)–NSFC (number 42161144006) Joint Scientific Research Program (to BR).
Institutional Review Board Statement
Sampling of coral tissues was conducted under a permit from the Israel Ministry of the Environment.
Informed Consent Statement
Not applicable.
Data Availability Statement
Not applicable.
Acknowledgments
We would like to thank Guy Paz for technical support, Eitan reem for statistical advice, IUI members for facility support, and a special thanks to Shai Shafir for providing the Stylophora pistillata colony fragment which was used to isolate the genomic DNA.
Conflicts of Interest
The authors declare no conflict of interest.
References
- Shefy, D.; Rinkevich, B. Stylophora pistillata—A Model Colonial Species in Basic and Applied Studies. In Handbook of Marine Model Organisms in Experimental Biology; CRC Press: Boca Raton, FL, USA, 2021; pp. 195–216. ISBN 978-1-00-321750-3. [Google Scholar]
- Shefy, D.; Shashar, N.; Rinkevich, B. The Reproduction of the Red Sea Coral Stylophora Pistillata from Eilat: 4-Decade Perspective. Mar. Biol. 2018, 165, 27. [Google Scholar] [CrossRef]
- Takabayashi, M.; Carter, D.A.; Lopez, J.V.; Hoegh-Guldberg, O. Genetic Variation of the Scleractinian Coral Stylophora Pistillata, from Western Pacific Reefs. Coral Reefs 2003, 22, 17–22. [Google Scholar] [CrossRef]
- Ayre, D.J.; Hughes, T.P. Genotypic Diversity and Gene Flow in Brooding and Spawning Corals along the Great Barrier Reef, Australia. Evolution 2000, 54, 1590–1605. [Google Scholar] [CrossRef]
- Zvuloni, A.; Mokady, O.; Al-Zibdah, M.; Bernardi, G.; Gaines, S.D.; Abelson, A. Local Scale Genetic Structure in Coral Populations: A Signature of Selection. Mar. Pollut. Bull. 2008, 56, 430–438. [Google Scholar] [CrossRef]
- Douek, J.; Amar, K.O.; Rinkevich, B. Maternal-Larval Population Genetic Traits in Stylophora pistillata, a Hermaphroditic Brooding Coral Species. Genetica 2011, 139, 1531–1542. [Google Scholar] [CrossRef]
- Klueter, A.; Andreakis, N. Assessing Genetic Diversity in the Scleractinian Coral Stylophora Pistillata (Esper 1797) from the Central Great Barrier Reef and the Coral Sea. Syst. Biodivers. 2013, 11, 67–76. [Google Scholar] [CrossRef]
- Guerrini, G.; Yerushalmy, M.; Shefy, D.; Shashar, N.; Rinkevich, B. Apparent Recruitment Failure for the Vast Majority of Coral Species at Eilat, Red Sea. Coral Reefs 2020, 39, 1715–1726. [Google Scholar] [CrossRef]
- Shefy, D.; Guerrini, G.; Marom, N.; Shashar, N.; Rinkevich, B. Settling in Aggregation: Spatial Planning Consideration for Brooding Coral Transplants. Mar. Environ. Res. 2022, 176, 105612. [Google Scholar] [CrossRef]
- Epstein, N.; Bak, R.P.M.; Rinkevich, B. Strategies for Gardening Denuded Coral Reef Areas: The Applicability of Using Different Types of Coral Material for Reef Restoration. Restor. Ecol. 2001, 9, 432–442. [Google Scholar] [CrossRef]
- Epstein, N.; Vermeij, M.J.A.; Bak, R.P.M.; Rinkevich, B. Alleviating Impacts of Anthropogenic Activities by Traditional Conservation Measures: Can a Small Reef Reserve Be Sustainedly Managed? Biol. Conserv. 2005, 121, 243–255. [Google Scholar] [CrossRef]
- Horoszowski-Fridman, Y.B.; Brethes, J.C.; Rahmani, N.; Rinkevich, B. Marine Silviculture: Incorporating Ecosystem Engineering Properties into Reef Restoration Acts. Ecol. Eng. 2015, 82, 201–213. [Google Scholar] [CrossRef]
- Rinkevich, B. Novel Tradable Instruments in the Conservation of Coral Reefs, Based on the Coral Gardening Concept for Reef Restoration. J. Environ. Manag. 2015, 162, 199–205. [Google Scholar] [CrossRef]
- Rinkevich, B. Coral Chimerism as an Evolutionary Rescue Mechanism to Mitigate Global Climate Change Impacts. Glob. Change Biol. 2019, 25, 1198–1206. [Google Scholar] [CrossRef] [Green Version]
- Golomb, D.; Shashar, N.; Rinkevich, B. Coral Carpets—A Novel Ecological Engineering Tool Aimed at Constructing Coral Communities on Soft Sand Bottoms. Ecol. Eng. 2020, 145, 105743. [Google Scholar] [CrossRef]
- Rachmilovitz, E.N.; Rinkevich, B. Tiling the Reef—Exploring the First Step of an Ecological Engineering Tool That May Promote Phase-Shift Reversals in Coral Reefs. Ecol. Eng. 2017, 105, 150–161. [Google Scholar] [CrossRef]
- Banguera-Hinestroza, E.; Saenz-Agudelo, P.; Bayer, T.; Berumen, M.L.; Voolstra, C.R. Characterization of New Microsatellite Loci for Population Genetic Studies in the Smooth Cauliflower Coral (Stylophora Sp.). Conserv. Genet. Resour. 2013, 5, 561–563. [Google Scholar] [CrossRef] [Green Version]
- Vidal-Dupiol, J.; Harscouet, E.; Shefy, D.; Toulza, E.; Rey, O.; Allienne, J.F.; Mitta, G.; Rinkevich, B. Frontloading of Stress Response Genes Enhances Robustness to Environmental Change in Chimeric Corals. BMC Biol. 2022, 20, 167. [Google Scholar] [CrossRef]
- Douek, J.; Barki, Y.; Gateño, D.; Rinkevich, B. Possible Cryptic Speciation within the Sea Anemone Actinia Equina Complex Detected by AFLP Markers. Zool. J. Linn. Soc. 2002, 136, 315–320. [Google Scholar] [CrossRef] [Green Version]
- Amar, K.-O.; Chadwick, N.E.; Rinkevich, B. Coral Kin Aggregations Exhibit Mixed Allogeneic Reactions and Enhanced Fitness during Early Ontogeny. BMC Evol. Biol. 2008, 8, 126. [Google Scholar] [CrossRef] [Green Version]
- Abdelkrim, J.; Robertson, B.C.; Stanton, J.-A.L.; Gemmell, N.J. Fast, Cost-Effective Development of Species-Specific Microsatellite Markers by Genomic Sequencing. BioTechniques 2009, 46, 185–192. [Google Scholar] [CrossRef]
- Malausa, T.; Gilles, A.; Meglécz, E.; Blanquart, H.; Duthoy, S.; Costedoat, C.; Dubut, V.; Pech, N.; Castagnone-Sereno, P.; Délye, C.; et al. High-Throughput Microsatellite Isolation through 454 GS-FLX Titanium Pyrosequencing of Enriched DNA Libraries. Mol. Ecol. Resour. 2011, 11, 638–644. [Google Scholar] [CrossRef]
- Faircloth, B.C. MSATCOMMANDER: Detection of Microsatellite Repeat Arrays and Automated, Locus-Specific Primer Design. Mol. Ecol. Resour. 2008, 8, 92–94. [Google Scholar] [CrossRef]
- Schuelke, M. An Economic Method for the Fluorescent Labeling of PCR Fragments. Nat. Biotechnol. 2000, 18, 233–234. [Google Scholar] [CrossRef]
- Van Oosterhout, C.; Hutchinson, W.F.; Wills, D.P.M.; Shipley, P. MICRO-CHECKER: Software for Identifying and Correcting Genotyping Errors in Microsatellite Data. Mol. Ecol. Notes 2004, 4, 535–538. [Google Scholar] [CrossRef]
- Peakall, R.; Smouse, P.E. GenAlEx 6.5: Genetic Analysis in Excel. Population Genetic Software for Teaching and Research-an Update. Bioinformatics 2012, 28, 2537–2539. [Google Scholar] [CrossRef] [PubMed] [Green Version]
- Kalinowski, S.T.; Taper, M.L.; Marshall, T.C. Revising How the Computer Program CERVUS Accommodates Genotyping Error Increases Success in Paternity Assignment. Mol. Ecol. 2007, 16, 1099–1106. [Google Scholar] [CrossRef] [PubMed]
- Rousset, F. GENEPOP’007: A Complete Re-Implementation of the GENEPOP Software for Windows and Linux. Mol. Ecol. Resour. 2008, 8, 103–106. [Google Scholar] [CrossRef]
- Excoffier, L.; Lischer, H.E.L. Arlequin Suite Ver 3.5: A New Series of Programs to Perform Population Genetics Analyses under Linux and Windows. Mol. Ecol. Resour. 2010, 10, 564–567. [Google Scholar] [CrossRef]
- Guerrini, G.; Shefy, D.; Douek, J.; Shashar, N.; Goulet, T.L.; Rinkevich, B. Spatial distribution of conspecific genotypes within chimeras of the branching coral Stylophora pistillata. Sci. Rep. 2021, 11, 22554. [Google Scholar] [CrossRef]
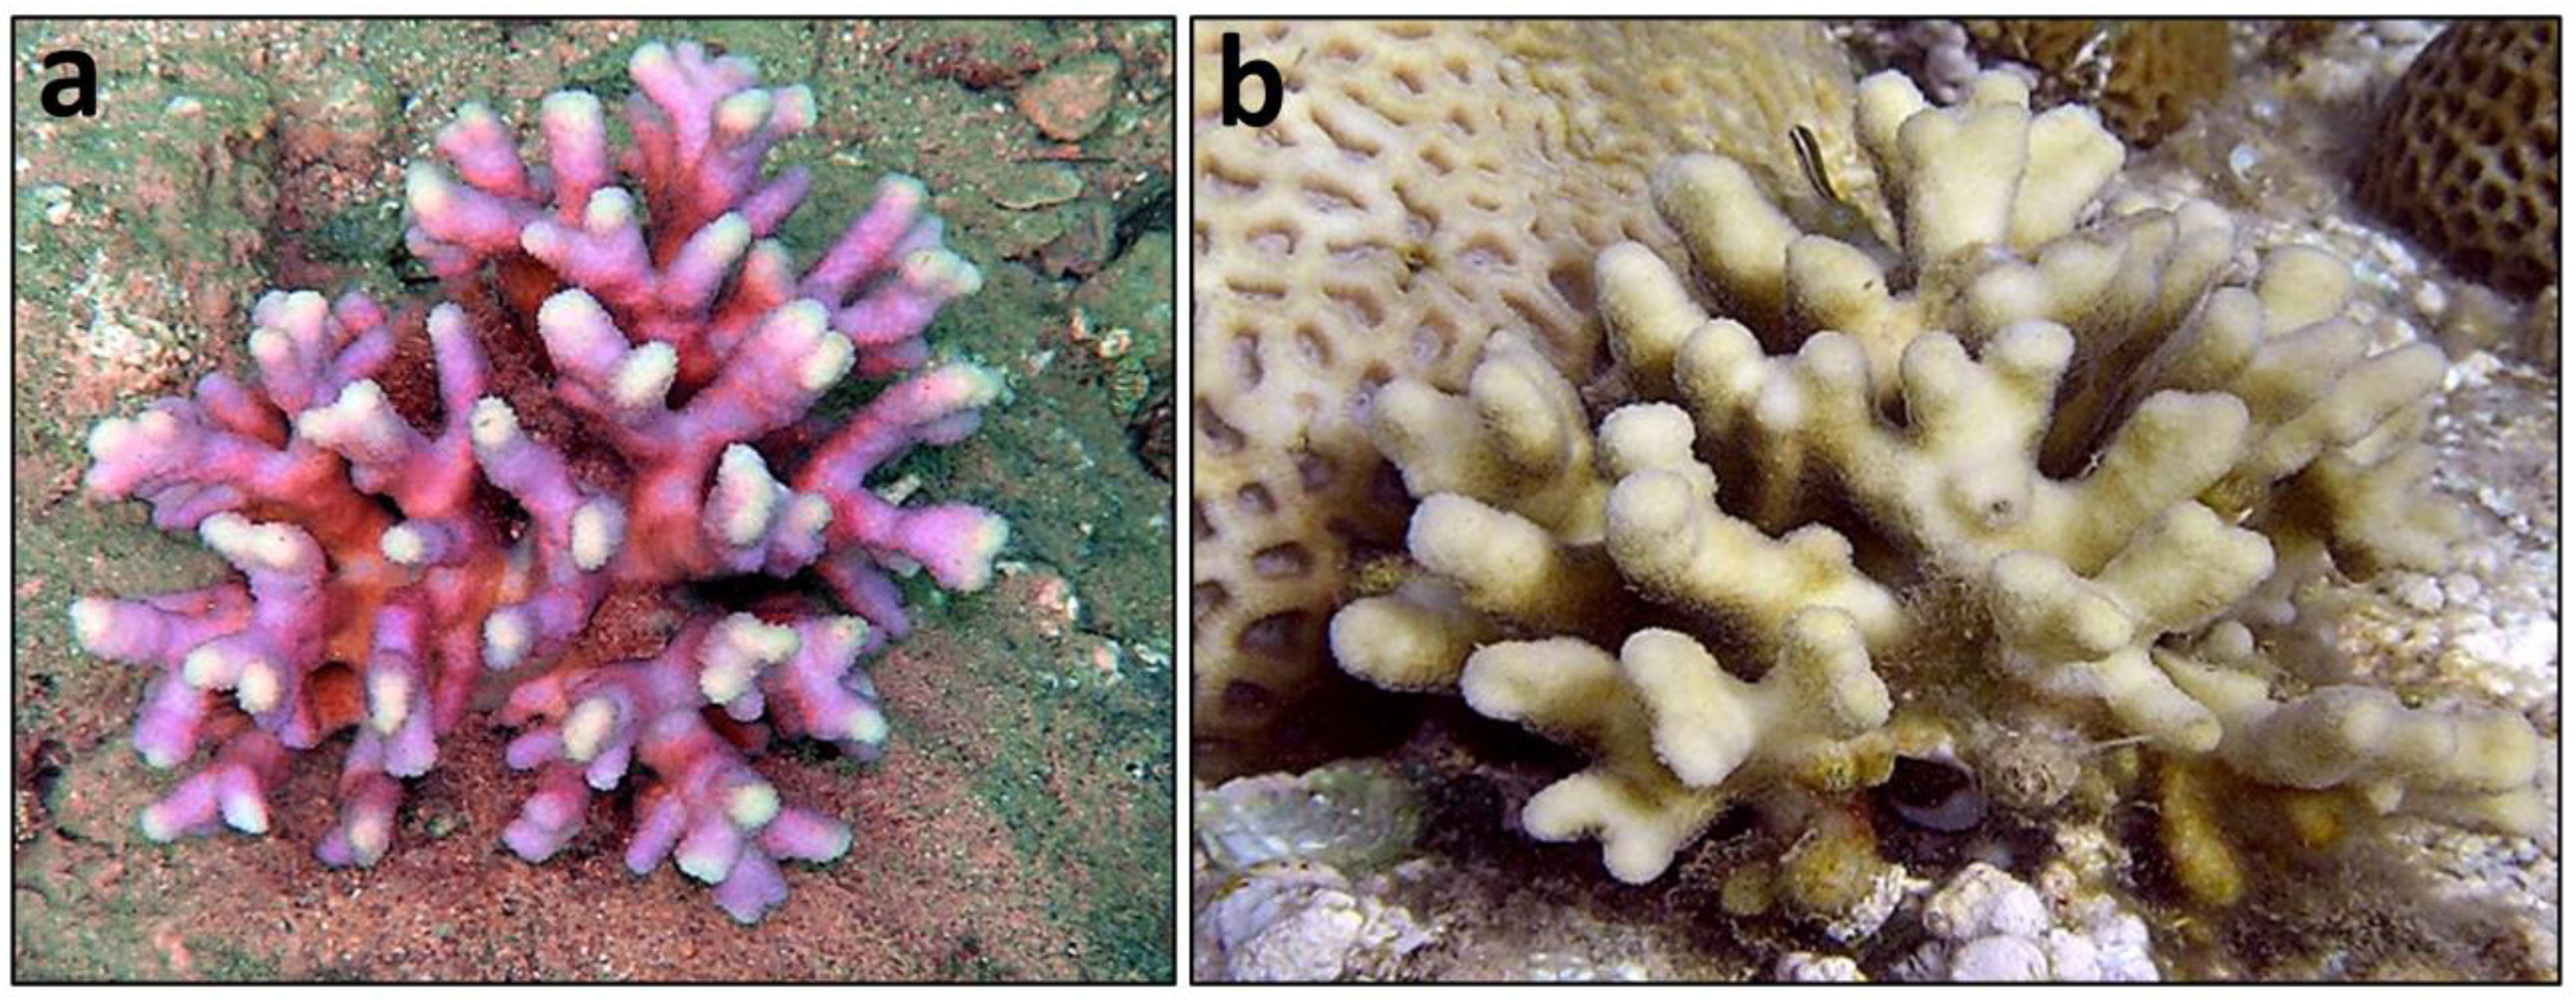
Figure 1.
Stylophora pistillata (Esper 1797) colonies (a,b) form the Gulf of Eilat (phots: E. N. Rachmilovitz).
Figure 1.
Stylophora pistillata (Esper 1797) colonies (a,b) form the Gulf of Eilat (phots: E. N. Rachmilovitz).


Table 1.
Characteristics of novel microsatellite loci developed for S. pistillata: locus name, forward and reverse primer sequences (5′ to 3′); RM = repetitive motive, NA = number of alleles; AR = alleles range (bp); AN = GenBank accession numbers.
Table 1.
Characteristics of novel microsatellite loci developed for S. pistillata: locus name, forward and reverse primer sequences (5′ to 3′); RM = repetitive motive, NA = number of alleles; AR = alleles range (bp); AN = GenBank accession numbers.
| Name | Forward Primer | Reverse Primer | RM | NA | AR | AN |
|---|---|---|---|---|---|---|
| SP_1 | GCCTCGAATGCGGTGAATG | GGAAACAGCTATGACCATAAATGGAGGTCCCGTCTCC | (AAGT)11 | 14 | 132–318 | OP851549 |
| SP_2 | GGAAACAGCTATGACCATGGGTGGGTTAATAGAGGGC | TGGGCTGGTGGTTATCAGG | (CT)14 | 6 | 379–397 | OP851536 |
| SP_3 | GGAAACAGCTATGACCATGTTAGGCTCCGTGCAAAGC | GGTCAGGGTCTGAAGGCTC | (AG)10 | 7 | 168–194 | OP851539 |
| SP_4 | GGAAACAGCTATGACCATGGCTTCAGTTTACAAGCGTC | AAGTACACGAGCCCACAAG | (GTA)18 | 4 | 125–159 | OP851534 |
| SP_5 | GGAAACAGCTATGACCATGCCAAAGTGGAACCGAGTG | TACCTGCTGTGCGAAATGC | (GAT)10 | 7 | 450–469 | OP851542 |
| SP_6 | GGAAACAGCTATGACCATAAGATGGGCTCAAGGTCCG | CAAGCAACTTAGGCAGGGC | (GTTC)10 | 20 | 352–399 | OP851547 |
| SP_7 | AACTTCTCACTCGTGCCAG | GGAAACAGCTATGACCATCAAGGAAGAGGCCGAATGG | (GA)13 | 9 | 240–256 | OP851532 |
| SP_8 | GAGGCTGAAGACAATGGCG | GGAAACAGCTATGACCATGTGGTGTATTGGTATCACAGC | (GA)18 | 7 | 156–175 | OP851537 |
| SP_9 | GGAAACAGCTATGACCATGATAGAGTGCGGCCTATTGC | GCGCAAGGAGACAATACAGG | (CTCA)15 | 12 | 172–225 | OP851546 |
| SP_10 | GGAAACAGCTATGACCATAAACGCCATTAAGCTCCGC | AGCAGGGCCAGCACTTAC | (AGGT)10 | 17 | 369–437 | OP851548 |
| SP_11 | GGAAACAGCTATGACCATGCAAATGGCAGGATTGACTG | TCTGGGACGGAGAAGCAAC | (TGA)12 | 11 | 247–267 | OP851544 |
| SP_12 | GGAAACAGCTATGACCATGTGACGTGCGTTTCAAGCC | CAGCCTGTTATGACGTCGG | (CA)10 | 14 | 213–241 | OP851535 |
| SP_13 | AGAGGCAGCGAAGGAATTG | GGAAACAGCTATGACCATGTGTCCGAAATCTGACGGG | (GTCT)14 | 11 | 182–229 | OP851541 |
| SP_14 | GGAAACAGCTATGACCATCTGCTTCAAAGGATAACTAGGTC | CGCACCAAACGTGCTAACG | (CTT)13 | 5 | 311–336 | OP851550 |
| SP_15 | GGAAACAGCTATGACCATGAGGGCCACAAGTTCATTAGC | CAGCCACACTACCAGTTGC | (ACTC)16 | 18 | 134–318 | OP851545 |
| SP_16 | GGAAACAGCTATGACCATAACAACCTGTGTAAGCTTTGG | AGAGCCATAAGCGGGATGG | (CTT)12 | 14 | 250–286 | OP851533 |
| SP_17 | GGAAACAGCTATGACCATGTCGGTGTATTGCTGTACC | GTCACTGAAATATGAACAAAGACCG | (AT)10(AG)15 | 18 | 199–271 | OP851540 |
| SP_19 | TGGTGAGTGGGAAATAGGTTTG | GGAAACAGCTATGACCATGGTGCCAATTACCTTGGGC | (GTT)11 | 8 | 359–392 | OP851551 |
| SP_20 | GGAAACAGCTATGACCATCAAAGCCGTCCTCACAACC | GGCTGAGCATCTTTCCCTTG | (GTT)12 | 4 | 319–329 | OP851543 |
Table 2.
Allelic diversity of S. pistillata microsatellite loci. Heterozygosity, F statistics, and polymorphism by population and Chi-square tests for Hardy–Weinberg equilibrium for codominant Data. N = number of samples; NA = number of alleles; Ho = observed heterozygosity = no. of heterozygote/N; He = expected heterozygosity = 1 − Sum pi2; uHe = unbiased expected heterozygosity = (2N/(2N − 1)) × He; F = Fixation index = (He − Ho)/He = 1 − (Ho/He); PIC = polymorphic information content; Signif = ns = not significant, ** p < 0.01, *** p < 0.001.
| Locus | N | NA | Ho | He | uHe | F | PIC | HW Prob | Signif | Null Present |
|---|---|---|---|---|---|---|---|---|---|---|
| SP_1 | 26 | 14 | 0.462 | 0.703 | 0.716 | 0.343 | 0.687 | 0.000 | *** | yes |
| SP_2 | 38 | 6 | 0.289 | 0.488 | 0.494 | 0.407 | 0.462 | 0.000 | *** | yes |
| SP_3 | 40 | 7 | 0.475 | 0.758 | 0.767 | 0.373 | 0.718 | 0.000 | *** | yes |
| SP_4 | 38 | 4 | 0.053 | 0.101 | 0.103 | 0.481 | 0.100 | 0.000 | *** | yes |
| SP_5 | 37 | 7 | 0.757 | 0.789 | 0.800 | 0.041 | 0.757 | 0.004 | ** | no |
| SP_6 | 40 | 20 | 0.875 | 0.911 | 0.922 | 0.039 | 0.904 | 0.000 | *** | no |
| SP_7 | 38 | 9 | 0.579 | 0.802 | 0.812 | 0.278 | 0.776 | 0.001 | ** | yes |
| SP_8 | 40 | 7 | 0.525 | 0.766 | 0.775 | 0.314 | 0.729 | 0.000 | *** | yes |
| SP_9 | 23 | 12 | 0.957 | 0.815 | 0.833 | −0.174 | 0.800 | 0.561 | ns | no |
| SP_10 | 40 | 17 | 0.925 | 0.846 | 0.857 | −0.093 | 0.833 | 0.993 | ns | no |
| SP_11 | 36 | 11 | 0.806 | 0.818 | 0.829 | 0.015 | 0.798 | 0.000 | *** | no |
| SP_12 | 40 | 14 | 0.875 | 0.799 | 0.809 | −0.095 | 0.781 | 0.925 | ns | no |
| SP_13 | 39 | 11 | 0.667 | 0.817 | 0.827 | 0.184 | 0.793 | 0.005 | ** | yes |
| SP_14 | 32 | 5 | 0.375 | 0.654 | 0.665 | 0.427 | 0.590 | 0.000 | *** | yes |
| SP_15 | 40 | 18 | 0.750 | 0.888 | 0.900 | 0.156 | 0.879 | 0.051 | ns | yes |
| SP_16 | 36 | 14 | 0.556 | 0.859 | 0.871 | 0.353 | 0.844 | 0.000 | *** | yes |
| SP_17 | 38 | 18 | 0.658 | 0.875 | 0.886 | 0.248 | 0.864 | 0.000 | *** | yes |
| SP_19 | 40 | 8 | 0.550 | 0.595 | 0.603 | 0.076 | 0.533 | 0.072 | ns | no |
| SP_20 | 32 | 4 | 0.219 | 0.507 | 0.515 | 0.569 | 0.439 | 0.000 | *** | yes |
| Mean | 36.474 | 0.597 | 0.726 | 0.736 | 0.207 | 0.699 |
Disclaimer/Publisher’s Note: The statements, opinions and data contained in all publications are solely those of the individual author(s) and contributor(s) and not of MDPI and/or the editor(s). MDPI and/or the editor(s) disclaim responsibility for any injury to people or property resulting from any ideas, methods, instructions or products referred to in the content. |
© 2023 by the authors. Licensee MDPI, Basel, Switzerland. This article is an open access article distributed under the terms and conditions of the Creative Commons Attribution (CC BY) license (https://creativecommons.org/licenses/by/4.0/).
Share and Cite
MDPI and ACS Style
Douek, J.; Rachmilovitz, E.N.; Rinkevich, B. New Microsatellite Markers for the Model Coral Species Stylophora pistillata from Eilat, the Red Sea. J. Mar. Sci. Eng. 2023, 11, 244. https://doi.org/10.3390/jmse11020244
AMA Style
Douek J, Rachmilovitz EN, Rinkevich B. New Microsatellite Markers for the Model Coral Species Stylophora pistillata from Eilat, the Red Sea. Journal of Marine Science and Engineering. 2023; 11(2):244. https://doi.org/10.3390/jmse11020244
Chicago/Turabian StyleDouek, Jacob, Elad Nehoray Rachmilovitz, and Baruch Rinkevich. 2023. "New Microsatellite Markers for the Model Coral Species Stylophora pistillata from Eilat, the Red Sea" Journal of Marine Science and Engineering 11, no. 2: 244. https://doi.org/10.3390/jmse11020244
Note that from the first issue of 2016, this journal uses article numbers instead of page numbers. See further details here.