
Modelling the Make Process of the Mineral Supply Chain Upstream Segment


1
Faculty of Production Engineering, Universität Bremen, 28359 Bremen, Germany
2
Faculty of Engineering and Architecture, Universidad Arturo Prat, Iquique 1110939, Chile
3
BIBA-Bremer Institut für Produktion und Logistik GmbH, 28259 Bremen, Germany
*
Author to whom correspondence should be addressed.
Resources 2023, 12(11), 132; https://doi.org/10.3390/resources12110132
Submission received: 6 October 2023
/
Revised: 5 November 2023
/
Accepted: 6 November 2023
/
Published: 8 November 2023
Abstract
:The upstream segment of the minerals supply chain (MiSC) is the backbone for achieving the transition to clean energy by securing the supply of minerals. Recently, the MiSC has been disrupted, affecting mineral supply and generating uncertainty among clean energy producers. Supply chain (SC) mapping addresses this uncertainty, providing a holistic end-to-end view. However, MiSC mapping studies mainly focus on the downstream segment, leaving aside the upstream segment. In this context, the fundamental gap is the lack of standardized modelling frameworks that can accurately represent the upstream segment dynamics and, at the same time, seamlessly integrate with the downstream segment. This paper bridges this gap, designing a model for the MiSC upstream segment (MiSCOR). Framed within design science research methodology, MiSCOR is built by adapting two reference models, the Exploration and Mining Business Reference Model (EM) and the Supply Chain Operations Reference Model (SCOR), focusing on the commodity-making process. The MiSCOR demonstrates its applicability and robustness in real operational scenarios of one of the largest copper producers. MiSCOR provides a management tool for practitioners and decision-makers in the MISC’s upstream segment, offering blueprints to throw functional silos, foster collaboration, and a standardized framework that integrates seamlessly with the downstream segment.
1. Introduction
One of humanity’s most critical challenges in recent years is the battle against climate change. To face this challenge, the European Union has proposed a roadmap to achieve climate neutrality by 2050 (Net-Zero) [1], in which one of the main actions is the transition to clean energy. The shift from hydrocarbon-based energies to clean or renewable energies underlies this transition, which foresees an increase in the consumption of minerals and metals [2], such as copper, lithium, nickel, cobalt, and rare earth elements. Those mentioned above will play a vital role in the transition to clean energy [3] given their extended application in clean energy technologies, including renewable energies (photovoltaic, wind, hydro, geothermal, and biomass), electromobility, energy storage systems (fuel cells), and energy infrastructures (electricity transmission and distribution systems). Therefore, ensuring a sufficient supply of these minerals for a clean energy transition is significant.
The Mineral Supply Chain (MiSC) provides the minerals and metals required for the energy transition. The MiSC management extends from the discovery of the mineral district, the extraction of the ore mineral, and the transformation of the ore mineral into a mineral commodity (Upstream Segment) to the use of this commodity mineral in an end application (Downstream Segment) [4,5]. One of the complexities of the MiSC is the concentration of mineral production in a few countries, e.g., more than 80% of lithium production is produced in Australia, Chile, and China, and about 50% of copper production is produced in Chile, Peru, and China [2]. This geographic concentration creates uncertainty for clean energy producers because any disruption in the upstream segment of the mineral supply chain could lead to mineral shortages and affect Net-Zero [6,7].
Supply Chain (SC) mapping is one of the measures to respond promptly to disruptions [8]. SC mapping is a graphical modelling that represents the key features of the SC, providing greater insight and knowledge to plan, manage, and control material, information, and financial flows in the end-to-end supply chain [9]. Disruptions in mineral supply chains in recent years [10,11,12,13] have generated an increased interest by researchers and practitioners in understanding the MiSC in its broader context through modelling it [14]. Most of these studies have focused on MiSC’s downstream segment [15,16], which does not represent the entire mineral supply chain. Moreover, some of these studies have used different modelling techniques, generating confusion and misinterpretations when evaluating and making decisions about the MiSC. Consequently, this gap in understanding mineral supply chain modelling creates an obstacle for stakeholders due to a lack of critical information and knowledge of the upstream segment. Thus, there are still research gaps in modelling the MiSC research: first, a model is needed for modelling the upstream segment, and second, this model must be standardized so that it can be seamlessly integrated with the downstream segment.
This paper aims to construct a model for the upstream segment of the minerals supply chain (MiSCOR). The construction of this model is based on the adaptation of two reference models. The first is the Supply Chain Operation Reference Model (SCOR), which supports modelling in a standard language. The second is the Exploration and Mining Business Reference Model (EM), which represents the industrial dynamics of the upstream segment of the MiSC. The applicability of MiSCOR in real operating scenarios of copper production is also evaluated. This work contributes to a better understanding of the dynamics of commodity mineral production, making the upstream segment of the MiSC more comprehensible.
The structure of this paper is as follows. Section 2 presents the aim and methodology of the research. Section 3 depicts the problem leading to the construction of the model and defines the requirements for designing the model. Section 4 explains the design of the MiSCOR at three levels of abstraction. Then, Section 5 evaluates the applicability of MiSCOR in a real copper operational case. Subsequently, Section 6 reflects on the proposed model and discusses its design, evaluation, and practical implications. Finally, in Section 7, this study concludes.
2. Research Aim and Methodology
A reference model is a conceptual framework for domain-specific modelling [17]. Literature shows two manners of building reference models: building new reference models and reusing reference models [18]. The first approach relies mainly on applying many cases to validate and generalize its results. The second one focuses on adapting the reference model in a new domain or application. The latter is the most widely used as it saves model development costs, decreases modelling time, provides better modelling quality, decreases modelling risks, and creates a common language for use by improving the stakeholder communication [19,20].
The MiSCOR construction was based on the reuse of reference models. Accordingly, the reference model used in this study was the Supply Chain Operation Reference Model [21], considered the “de facto” cross-industry standard model for describing the entire SC. The SCOR was adapted within a new domain, the upstream segment of the mineral SC. The new domain was described with the Exploration and Mining Business Reference Model [22] due to this model provides a better understanding of the industry dynamics of the MiSC’s upstream segment. The consideration of the MiSCOR as a reference model can be framed in the context of Design Science Research (DSR) since the construction of this model can be considered an artifact design that must meet specific requirements [18,23]. Based on the DSR contribution framework proposed by Gregor and Hevner [24], adapting a reference model in a new application context is understood as exaptation. Exaptation research involves designing artifacts from a specific field, which are extended or refined for use in a new application domain. Therefore, one of the main tasks of an exaptation research project is to address the challenges and requirements of the current application domain that were not present in the environment in which the artifact is designed.
This study follows the methodological framework for DSR by Johannesson and Perjons [23], which considers five research steps: (1) Explain the problem; it was described the requirements and specificities of the upstream segment of the MiSC and the absence of standardization in the business process modelling in this segment through a critical review method [25] (cf. Section 3.1). (2) Define the requirements; it was defined the reference models, SCOR and EM, used in this study. Moreover, an analysis was performed on the feasibility of integrating both reference models and the requirements for their adaptation based on the Matching Process Technique by Beheshti et al. [26] (cf. Section 3.2). (3) Design and develop the artifact; it was designed the MiSCOR following a top-down expansion technique [27,28] (cf. Section 4). (4) Demonstrate the artifact; MiSCOR was applied in a real case of the upstream segment of the copper supply chain in Chile. (5) Evaluate the artifact; MiSCOR was evaluated using 19 operational scenarios of the real case upstream segment of the copper supply chain in Chile carried out from 1995 until 2020 (cf. Section 5). Figure 1 represents the roadmap of the DSR methodology in this study.
3. Problem and Requirement
Section 3.1 supports the construction of the MiSCOR with a critical review and focuses on the current state of modelling the upstream segment of the minerals supply chain. Furthermore, it discusses the boundaries and processes of the upstream segment of the MiSC and evaluates approaches already addressing the modelling of this segment. Finally, Section 3.2 presents the requirements for constructing the MiSCOR, reviews the SCOR and the EM, and develops a matching technique between the mentioned models. This technique allowed us to establish the requirements for their adaptation and integration.
3.1. Explicate Problem
In the last decade, several studies on the Mineral Supply Chain have covered a wide field of research, e.g., operations research, risk management, and sustainable management [14]. Most of these studies have used graphic modelling to represent key features of the mineral supply chain. For example, Steinberg and Tomi [29] developed a process flow diagram of the iron logistics chain, considering extraction processes to distribute to the final customer. Similarly, Nader et al. [30] depicted the operational processes of the mineral value chain, from exploration to the sale and delivery of mineral products. Soto-Viruet et al. [31] graphically represented the tantalum supply chain network, establishing the mining as the starting point and finalizing the final consumer in their model. Agudelo [32] graphed the cement supply chain, from the mine to the last customer, based on a Push–Pull analysis. Lim-Camacho et al. [33] depicted the flow of material provided from the primary producer to the end user of the Australian Diamond SC. Sprecher et al. [34] and Mancheri et al. [35] used a dynamic systems model to represent from primary to end-of-life production of neodymium and tantalum, respectively. Van den Brink et al. [36] represented the Cobalt SC by geographic mapping and globally positioning mines and refineries. K.E.K et al. [37] represented a global copper supply chain model, establishing some copper-producing and copper-consuming countries. For mathematical modelling, Akbari-Kasgari et al. [38] graphically represented the copper supply chain, from mine to final copper disposal. However, although these models represent the extent of the MiSC holistically, it is necessary to establish its boundaries better. For example, the starting point of the MiSC (mine, primary production, and exploration) should be specified.
One of the modelling challenges is to understand the boundaries and segments of the mineral supply chain [39,40]. The MiSC comprises two segments: upstream and downstream [5,15]. The upstream segment, or extractive and mining industry, encompasses the exploitation of minerals to produce mineral commodities and their subsequent sale and the final disposal of tailings and mine closure [41]. The downstream segment, or manufacturing industry, encompasses manufacturing pre-products and final products (manufacturer) and the retail sale, use, recycling, and disposal of the final products [15]. Any improvement in the upstream segment will directly impact the downstream process and, thus, the performance of the entire mineral supply chain [15,42,43]. Therefore, a better understanding of the upstream segment of the MiSC is required.
Several research articles have addressed modelling the upstream segment of the mineral supply chain. Most of them have focused on modelling some specific segment activities, keeping the lack of knowledge of the upstream segment [44]. On the other hand, only some have focused on modelling the entire upstream segment of the MiSC. For instance, Caro et al. [45] proposed an integrated approach for long-term copper production planning processes; their model contemplates geological block models until the distribution process. Córdova et al. [46] developed a systematic model for the cost analysis of a mining project, analyzing all activities from mine development to ore production. Fung, Singh, and Zinder [47] optimized long-term planning by considering mining extraction as a starting point for distributing mineral outputs. Lèbre and Corder [48] and Lèbre et al. [49,50] modelled the mining waste production of each of the upstream segment processes; their studies considered ore extraction production as the first waste-producing link and ore refining as the last mineral waste producer. Although the authors’ contribution mentioned above depicted a better understanding of the upstream segment of the MiSC, the several modelling techniques used in their studies make it difficult to comprehend. Additionally, the boundaries of the upstream segment of the MiSC are not clear, e.g., which is the final boundary for the MiSC’s upstream segment, the ore refining process, or commodity distribution. Therefore, there is still a gap in the research that should focus on standardizing the modelling technique, considering first a standard model language targeting the MiSC stakeholders and second establishing its upstream segment boundaries.
Some studies have already addressed the research gap described above. On the one hand, researchers have focused on establishing the boundaries of the upstream segment of the MiSC, Arroyo and Viana [4], and Sauer and Seuring [5,15], who proposed a generic model of the MiSC. In these studies, authors described boundaries of the upstream and downstream segments as well as some business processes. Additionally, Castillo-Villagra and Thoben [51] adapted the generic MiSC model [5] by integrating the business processes of the EM in the upstream segment. Therefore, a model of the MiSC of the upstream segment can be described by establishing its boundaries and business processes (see Figure 2a).
On the other hand, regarding the standardization of the upstream segment of the MiSC, Osborne et al. [39,40] proposed to model the upstream segment of the coal supply chain using the SCOR. The authors justified using the SCOR model due to its wide use in the downstream segment and its capacity to integrate both segments. Likewise, Zúñiga [43] and Zúñiga et al. [42] modelled the business processes of the upstream segment of the MiSC. In this study, the author adapted the processes of the EM, namely, “Discover”, “Establish”, and “Exploit”, within the logic of the SCOR and DCOR model [52]. However, although these studies attempted to standardize, clarify, and better understand the upstream segment of the MiSC, they have not addressed its full extent. Therefore, modelling the upstream business processes (the material flow to the downstream segment, namely, Beneficiate and Sell) and integrating both segments is still pending. Figure 2b shows the gap in modelling the mineral supply chain using SCOR and DCOR (SCOR family models) as standardized tools in the upstream segment.
In summary, we found two problems: First, the lack of modelling of the upstream segment of the mineral supply chain. Second, a standardized modelling tool with the objective of seamless integration with the upstream segment of the mineral supply chain.
3.2. Define Requirement
This subsection defines the requirements for the MiSCOR design using a matching process technique that compares the EM and SCOR. Comparing models is a critical operation that describes and evaluates whether the processes between the models are identical, equivalent, or similar. The following describes the reference models used to contextualize the reader and shows the matching process technique developed.
3.2.1. The Exploration and Mining Business Reference Model (EM)
The Exploration and Mining Business Reference Model was developed in 2010 by the Open Group’s Exploration, Mining, Metals, and Minerals Forum (EMMM). Members of this organization belong to different sectoral organizations from the exploration, mining, metallurgical, and minerals industries and suppliers to these industries. The EM aims to establish a specific business process standard for the EM industries without extending beyond them. This model graphically represents the regular activities of companies’ EM sectors, thus better understanding their strategic, tactical, and operational business levels. In short, The EM Model describes the business process involved in the MiSC’s upstream segment.
The EM has a specific structure that classifies the various business processes into three levels, as shown in Figure 3. The highest level processes, “Enterprise processes”, describe the sequential nature of the mining sector. Enterprise processes “Discover”, “Establish”, “Exploit”, “Beneficiate”, “Sell”, and “Rehabilitate” are the core components of the EM. Although business processes follow a natural sequence, compliance is not always rigorous. The mid-level processes, “Value Chain processes”, describe the processes that add value to the product through the EM model. These processes are sequential; however, sometimes sequences of processes can be skipped or run together, not causing issues provided that outputs are available for the following process. Finally, the loest level process, “Business processes”, explicitly describes the activities within the Value Chain processes, which define the industrial dynamics of the mining industry, detailing the operational processes and results.
3.2.2. The Supply Chain Operation Reference Model (SCOR Model)
The original SCOR model framework traced to 1996, initially developed by AMR Research and the consulting firm Pitiglio, Rabin, Todd, and McGrath (PRTM); it was subsequently endorsed by the Supply Chain Council (SCC) and currently by the Association for Supply Chain Management (ASCM). The SCOR model aims to provide a methodology tool to diagnose and carry out benchmarks to help organizations improve supply chain processes. The ability of the SCOR model to represent very simple or complex supply chains using a standard set of definitions makes it the de facto standard for SC modelling from an academic and industry point of view [39,53]. Since its inception, the SCOR model has been regularly updated to adapt to changes in supply chain management practices. The latest version, v 12.0, was launched in 2017.
The SCOR structure comprises five major management processes “Plan”, “Source”, “Make”, Deliver”, and “Return”, subdivided into processes, elements, tasks, and activities categories. The SCOR comprises three levels of detail related to management processes, as depicted in Figure 4. The highest level processes, “Major Processes”, address the types of processes describing the scope of a supply chain. The Major Processes are Plan (P), Source (S), Manufacture (M), Deliver (D), and Return (R). The mid-level processes, “Process Categories”, establish the type of supply chain setup, such as Make-to-Stock (MTS) vs. Make-to-Order (MTO) vs. Engineer-to-Order (ETO) for the Source, Make, and Deliver processes, and Defective vs. MRO vs. Excess for the Return process. The lowest level processes, “Process Elements”, define the process elements within and between companies. Although other levels below level 3 may apply, they are not part of the scope of the SCOR Model, given their company-specific processes and practices.
3.2.3. The Matching Process Technique between SCOR and EM Models
The process matching technique is suitable for matching process models of different industrial natures, such as SCOR and EM processes. This technique addresses syntactic differences in process names, inputs, and outputs, focusing on the correspondence of the process concept or definition, thus, providing an approximate mapping between business processes based on three aspects of analysis Terminology, Granularity, and Behavior/Structure.
Terminology finds commonalities between processes and business process activities, even though these processes have different names, inputs, and outputs. The main challenge is to find similar concepts and definitions that can subsequently be matched with each other. The analysis starts at the highest levels process of the SCOR and EM and extends to all levels below, as shown in Figure 5. For illustrative purposes, next, it presents an analysis of the terminology in the major level process of both reference models.
The “Beneficiate” establishes ore treatment to obtain a mineral commodity for the metals market. This definition is similar to the “Make” of the SCOR, which is the process that adds value to a product by manufacturing or creating a product or deliverable. According to [43], the “Exploit” supplies the raw material, ore, to the “Beneficiate” process. The “Exploit” matches with the “Source” of the SCOR, which is responsible for ordering, delivering, receiving, and transferring the raw material. Once the ore is processed into a mineral commodity or mineral, the “Sell” process is responsible for trading and disposing of the mineral product to direct customers or to mineral and metal markets. The “Sell” overlaps with the “Deliver” process of the SCOR, as both manage customer orders.
Granularity compares the activity composition levels of the business process elements to match them if necessary. The elements composing the different business processes are compared at all SCOR and EM levels processes, as shown in Figure 6. SCOR and EM show differences regarding granularity in the mid- and lowest level processes. The mid-level processes in the SCOR, “Process Categories”, configure the capabilities of some of the “Major Processes”. A basic configuration of a “Major Processes” requires at least three “Process Categories”, i.e., “Plan”, “Source”, and “Deliver”. In contrast, in the EM’s Value Chain processes, the process configuration is mainly composed of a single element. At the lowest level, the EM describes the “Business processes” activities by listing the unit operations involved in the production processes. Conversely, SCOR’s lowest level process, “Process Elements”, describes in detail each processing element involved in the “category processes”.
Behavior/Structure analyses the differences or similarities in the sequence of their activities and levels of abstraction to match similar behaviours. A structure analysis establishes no differences between the EM and SCOR since both are configured at three levels of abstraction. However, from a behavioural point of view, the analysis of the activities of their business processes establishes that EM and SCOR present differences. On the one hand, the EM establishes that the sequence of business processes modelled does not imply that these processes are followed in a rigorous sequential manner. On the other hand, SCOR provides a generic methodological framework based on activities performed in a given sequence. In this regard, the SCOR’s framework eases the modelling process by describing each sequence of the processing element and its links, inputs, and outputs. However, the rigidity of the SCOR’s framework does not allow modelling to the flexible industrial dynamics of some industries [54], such as depicted within the EM. Therefore, modelling the business process dynamics of the EM in the SCOR requires an external toolbox to support the MiSCOR design process.
In summary, MiSCOR design requirements are: Firstly, a conceptual comprehending of the “Beneficiate”, which supports the process equivalence of the EM into SCOR. Secondly, a better understanding of the operational processes of the mining industry, which are the cornerstone for the integration of the processes EM into SCOR. The MiSCOR design draws on technical literature [55] and the authors’ experience in the extractive and mining industry to support these two requirements. Thirdly, an external business process modelling tool to represent the industrial dynamics of the MiSCOR. For this requirement, the MiSCOR design uses the BPMN [56], a well-known toolbox for business process modelling, which can be integrated with the SCOR model [54,57,58,59]. In addition, we followed the principles for modelling material flow with BPMN proposed by Zor et al. [60].
4. MiSCOR Design
The MiSCOR design uses a top-down expansion technique. This technique starts with a business process broad view and continues to each further process level below; its results are graphical models in a clear and easy-to-understand way. The business process is the EM’s “Beneficiate” process. Thus, considering the requirements for designing MiSCOR, the “Beneficiate” is modelled based on the SCOR at all levels of abstraction. However, since this process involving many business subprocesses, modelling all processes level or abstraction levels in one graphical model might be confusing. Therefore, the “Beneficiate” Enterprise process is initially graphed in the SCOR (cf. Section 4.1). Then, the Value Chain processes of the EM are modelled based on SCOR (cf. Section 4.2). Finally, an industrial activity business processes decomposition of the EM’s Value Chain process is graphically modelled based on SCOR, with the support of the BPMN toolbox (cf. Section 4.3).
4.1. Highest Level Processes—Abstraction Level 1
The EM states that the “Beneficiate” Enterprise process is the process focused on processing the ore for (i) Regulating the physical properties of the desired product, (ii) Removing unwanted constituents, and (iii) Improving the quality and purity or assay grade of a desired product. The final outputs are concentrates or other ore preparations and improvement of the grade of the desired product by metallurgical processes.
As mentioned in Section Problem and Requirement (cf. Section 3), the “Make” of the SCOR logic is the EM’s “Beneficiate”, which involves four Value Chain processes: (i) “Handle Material”: a collection of all material required for processing; (ii) “Treat Material”: liberating the mineral/metal from the ore through physical, chemical, and metallurgical processes; (iii) “Refine Material”: treating material to generate a more purified product for sale; (iv) “Handle Product”: sorting, blending, packaging, and storage of the marketable materials. From the SCOR perspective, “Handle Material” is understood as the “Source” (S), which focuses on the ordering, delivery, receipt, and transfer of elements of raw materials, subassemblies, products, and services to a manufacturing or delivery stage; “Treat Material” and “Refine Material” are comprehended within the parameters of the “Make” (M) since they both add value to a deliverable product through manufacturing. Both processes add value to ore, and their products are potentially sellable, so they should be considered separately; “Handle Product” is considered as “Deliver” (D) since its purpose is to perform order management and fulfilment activities for the customer. Figure 7 represents understanding the “Beneficiate” Highest Level Process (Abstraction Level 1) in SCOR modelling.
4.2. Mid-Level Processes—Abstraction Level 2
An intrinsic characteristic of the upstream segment of the MiSC is that its outputs are manufactured to be stocked [32,43,61]. Thus, the Value Chain processes from the EM’s “Beneficiate” are modelled into the SCOR’s Process Categories following a Make-to-Stock configuration. Each Value Chain processes and Business processes are described and modelled graphically in Figure 8.
Handle Material involves Business processes: (i) “Classify Material”, (ii) “Blend Material”, and (iii) “Store Material”. “Classify Material” classifies the ore from the “Exploit” to be assigned to the following process in the value chain. If the ore meets the quality requirements, it is stored until used in the processing plant. Otherwise, the ore is sent to a blending process. “Classify Material” matches the SCOR’s “Source-Stocked Product” (S1), which aims to order, receive, and transfer material, maintaining a stock level. “Blend Material” mixes the ore to get the quality the processing plant requires. From the SCOR perspective, the “Blend Material” fits with “Make-to-Stock” (M1) since it adds value to a product with predefined characteristics. “Store Material” accumulates the material with specific characteristics for processing plant use. This latter Business process matches the “Deliver Stocked Product” (D1) of the SCOR since it aims to guarantee the availability of the product when the customer’s order arrives.
Treat Material involves Business processes: (i) “Prepare Material” and (ii) “Concentrate Material”. “Prepare Material” performs the physical pre-treatment of the ore, mainly focusing on size reduction. Next, “Concentrate Material” obtains an enriched material separated from the tailings by ore chemical or biological treatment. The “Treat Material” products are mineral concentrated products, which in some cases could be sellable to end customers, but mostly follow a refinement process. “Prepare Material” and “Concentrate Material” are considered as “Make-to-Stock” (M1) of the SCOR since both Business processes are necessary for the transformation of the ore into a mineral product. Based on the SCOR configuration, M1 requires a process that receives the ore (S1) from the “Handle Material”. Likewise, it requires a process to deliver (D1) the mineral product produced to the following process for further product refinement.
Refine Material involves Business processes (i) “Smelt Material” and (ii) “Refine Material”. Note that the latter Business process is named the same as the “Refine Material” Value Chain process. Therefore, to distinguish them, the name of the Business process was changed to “Refine Material II”. The “Smelt Material” enriches and separates the desired material from the slag by pyrometallurgical treatment; its mineral smelted products are premium mineral concentrated, ingots, and anodes. These products may be sellable to end customers or further refined. From the SCOR perspective, “Smelt Material” considers a “Make-to-Stock” (M1) process category since it focuses on producing a sellable product. To fit into the SCOR configuration, the “Smelt Material” requires a process that receives (S1) the mineral-concentrated product from the “Treat Material” as well as a process for delivering its smelted product (D1). On the other hand, “Refine Material II” aims to refine mineral products by hydrometallurgical treatment. Mineral refined products are high-quality cathodes or dried mineral concentrates, which are sellable to final customers or traded in the metal market. From the SCOR perspective, “Refine Material II” matches the “Make-to-Stock” (M1) process since it produces deliverable products. A SCOR Process Category (S1) receives the mineral concentrated products from the “Treat Material” and smelted mineral products from the “Smelt Material”. Likewise, the Deliver (D1) Process Category addresses delivering refined products from “Refine Material II”. Both Business processes, “Smelt Material” and “Refine Material”, are modelled as independent Make-To-Stock (M1) but dependent on the same production plan. (P3).
Handle Product involves Business processes (i) “Classify Product”, (ii) “Blend Product”, (iii) “Package Product”, and (iv) “Store Product”. “Classify Product” classifies and categorizes products according to physical or chemical attributes. Such products are commonly categorized as mineral quality and product type (bulk or non-bulk). Bulk products are usually sent to a blending process, while non-bulk products are sent to a packaging process. The “Source-Stocked Product” (S1) fits with “Classify Product” from the SCOR viewpoint since it receives and transfers the products to the following process. Bulk products are transferred to the “Blend Product”, which mixes the products to obtain a higher quality of desired mineral product, e.g., percentage of copper, gold, and silver in the copper concentrate, or reduce the amount of gangue (undesired ore), e.g., the arsenic rate in the copper concentrate. The mineral bulk products depends on each customer’s requirements. Therefore, it fits the SCOR’s “Make-to-Order” (M2) process category. According to SCOR configuration, M2 requires a process that delivers products based on specific customer orders (D2). On the other hand, non-bulk products are transferred to “Package Product”, where products are packaged or containerized for safe transport to the customer or sent to “Store Product” until trade. Both Business processes, “Package Product” and “Store Product”, fit within Deliver (D1) process category from SCOR configuration, which focuses on having the product ready for delivery when the customer places the order. Both bulk and non-bulk products are sent to the following Enterprise process, “Sell”, which is responsible for dispatching and shipping the products to the final customers.
4.3. Lowest Level Processes—Abstraction Level 3
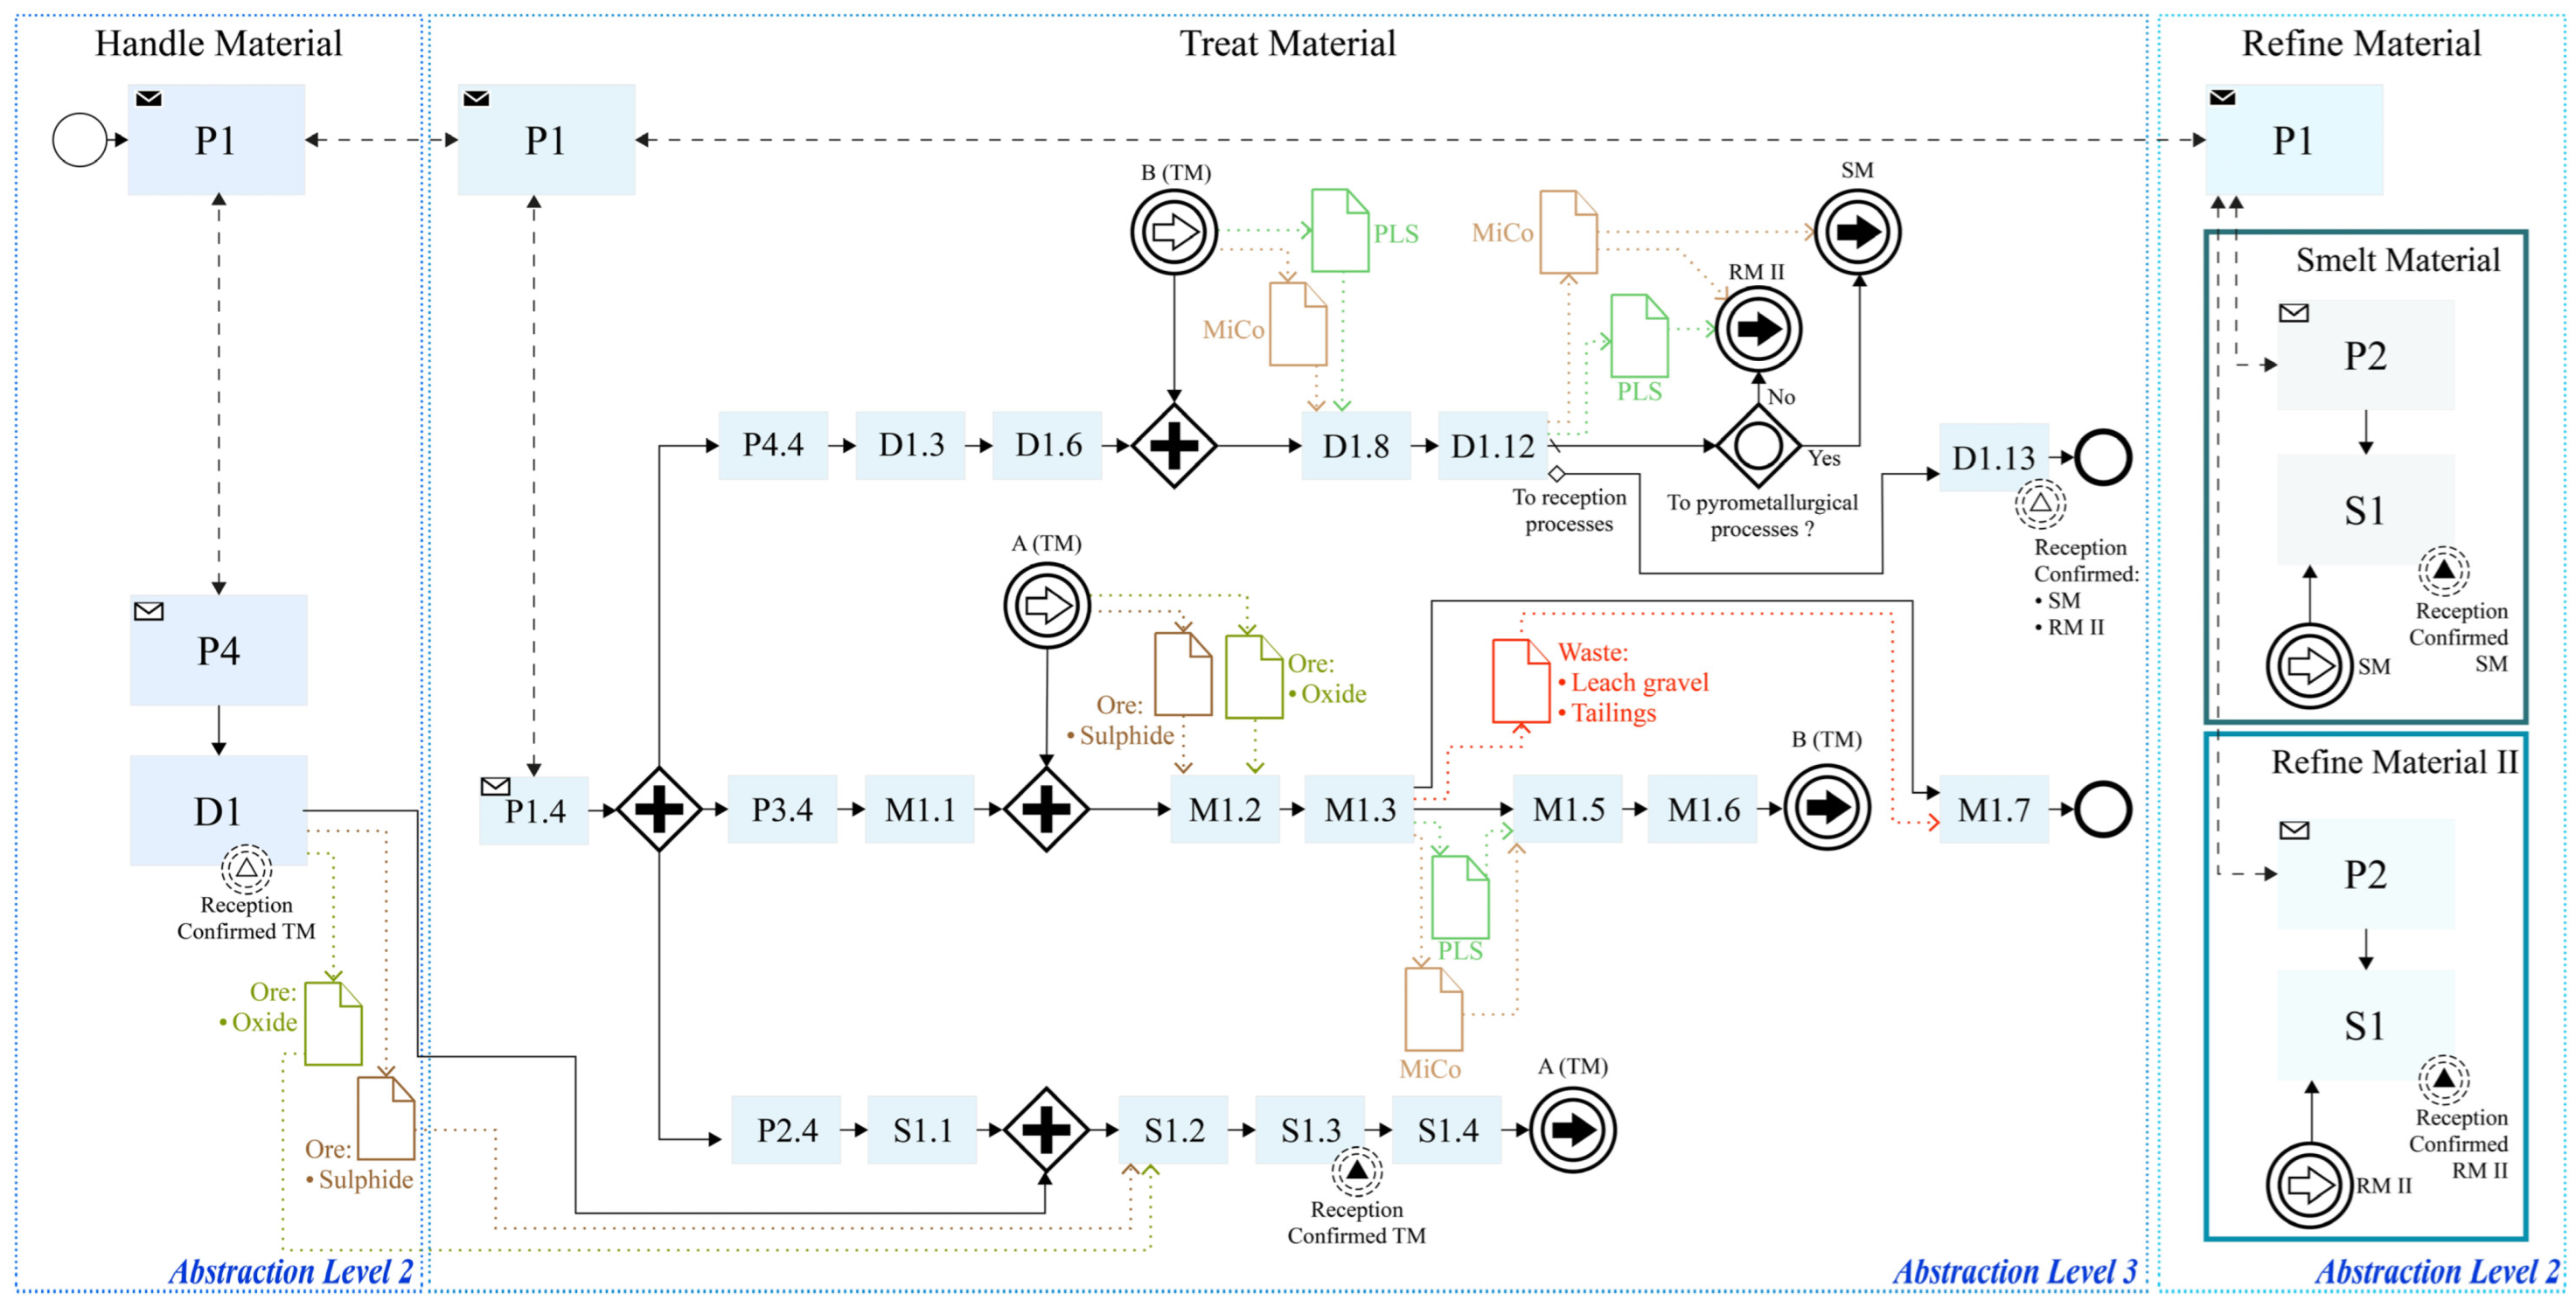
The SCOR Process Elements provide the capability to represent the defined object system, detailing its inputs and outputs. To support the modelling of the industrial dynamics of the MiSC’s upstream segment, the BPMN 2.0 toolbox is used (cf. Section 3.2). Next, it describes and models graphically the abstraction level 3 of the EM Value Chain processes: “Handle Material”, “Treat Material”, “Refine material—Smelt Material”, “Refine material—Refine Material II”, and “Handle Product”.
Handle Material. As illustrated in Figure 9, the “Exploit” (D1) provides the supply flow of ore, which can be either oxides or sulphides. First, the ore is received (S1.2) and checked against the ore material transfer plan (P2.4). The ore is then classified (S1.3) and matched with the geological requirements set by the processing plant (“Treat Material”—P1), e.g., ore type, rock hardness, and mineral quality. Afterwards, the ore can then follow two flows; if it does not meet the geological requirements of the processing plant, it must follow a blending process (M1.2). In contrast, if the ore meets the geological requirements, it continues through the material transfer sector (D1.8) to be sent to the processing plant. Since most of MiSC’s upstream segment industries are vertically integrated, there is no supplier payment process. Therefore, the SCOR S1.5 element process (authorize supplier payment) is not modelled in this case.
An ore blending process (M1.3) is carried out according to the requirements of the processing plant (P3.4) in the production plan (M1.1). Afterward, the product is stored in the blended material stockpile (M1.5) and sent (M1.6) to the store material sector (D1.8) for further shipment to the processing plant sector. However, due to the output characteristics of M1.3 (large rock units), the SCOR process element (M1.4) is not modelled. Similarly, the M1.7 Process Element is not considered in the modelling since “Handle material”, M1.3, does not produce waste material.
Once the stored mineral material (D1.3) is known, it is evaluated together with the throughput of the mineral material supplied to the processing plant (P1.4), so the planning of the material transfer to the processing plant is established (D1.4). Then, with this information, the ore now meets the plant’s requirements (D1.8) to be received and prepared for shipment (D1.12). Finally, these classified ore are dispatched to the treatment plant (“Treat Material”—S1) via pre-arranged transports, such as transfer trucks, rail systems, or conveyor belts. Due to the “Handle Material” dynamics, some Process Elements of the SCOR’s Deliver configuration are not modelled, i.e., related to customer order (D1.1 and D1.2), load and route planning (D1.4 and D1.5), transport (D1.7), logistics planning (D1.9–D1.11), and final installation and payment (D1.14 and D1.15).
Treat Material. As depicted in Figure 10, ores (Oxide and Sulphide) are received (S1.2) from the process “Handle Material” (D1). Then, the throughput plan (P1.4) is set, establishing the feed rate and grades of the material (S1.1) to be sent to process (M1.3); to do this, ores input (S1.3) is checked against the geological block model to obtain a theoretical profile of the ore grade that will feed the plant. Afterward, ores are then sent (S1.4) to the processing sector. The SCOR Process Element S1.5, related to supplier payment, is not considered due to the vertical integration between the “Handle Material” (supplier) and “Treat material”.
Considering a production plan (P3.4) and the throughput rate (M1.1), the ore classified (M1.2) is transferred to the physical (pre-treatment) and chemical (concentrate) processing sector (M1.3) to obtain a concentrated material. The M1.3 mineral products vary depending on the type of ore (oxide or sulphide) processed. First, the oxide ores are pre-treated in a crushing circuit; this crushed ore is then agglomerated with water and chemical reagents. Afterward, the agglomerated ore is stored in piles to be sprayed with chemicals for some time. Finally, a leach liquor (pregnant leach solution—PLS) and leach residue (leach gravel—waste) are obtained. By contrast, the sulphide ores are pre-treated with a dry crushing and grinding sequence to obtain a fine ore. Afterward, a wet milling treatment is carried out to get a fine ore pulp. Next, the pulp is treated in a flotation circuit, where water and chemical reagents are added to separate the mineral from it to finally obtain mineral concentrate (MiCo) and tailings (waste). The concentrated products of M1.3, PLS, or MiCo, are stocked (M1.5) until they are shipped (M1.6), depending on the refine material process plan (“Smelt material” or “Refine Material II”—P2). Finally, “Treat Material” wastes are sent to specific sectors for storage (M1.7). The concentrated products cannot be packaged at this level due to their characteristics, so the SCOR Process Element M1.4 is not modelled.
A delivery plan for the concentrate products is established (D1.3). This plan depends on the processing capacity of the “Smelt Material” and “Refine Material II” (P1.4), which determine the delivery schedule of the “Treat Material” products. Then, the concentrated products are received (D1.8) and prepared for delivery (D1.12). Delivery to the following process depends on the type of concentrated product. While MiCo can be sent to “Refine Material II” (S1) and “Smelt Material” (S1), PLS can only be shipped to “Refined Material II” (S1). Some “Deliver” Process Elements of the SCOR are not modelled due to the integration of “Refine Material” with “Treat Material”, i.e., the element processes related to customer order (D1.1 and D1.2), load and route planning (D1.4 and D1.5), transport (D1.7), logistics planning (D1.9–D1.11), and final installation and payment (D1.14 and D1.15).
Refine Material—Smelt Material. As shown in Figure 11, MiCo is treated by pyrometallurgical processes to obtain smelted products. First, the MiCo supplied by the treat material process is received (S1.2) and tested in the laboratory (S1.3). MiCo is then sent (S1.4) to the smelting sector (M1.2). The smelting process is integrated into the material treatment process, so there is no supplier payment process to purchase MiCo. Therefore, the SCOR element process, S1.5, is not modelled.
Once the MiCo is received in the smelting sector (M1.2) and, considering the capacity of the smelting plant (M1.1), pyrometallurgical processes are initiated (M1.3), which can be calcination, roasting, smelting, and refining, among others. The main pyrometallurgical outputs are smelted products (ingot, anode, premium MiCo), by-products, and smelting waste. By-products are packaged (M1.4) and stored (M1.5) for subsequent shipment (M1.6) to the “Handle Product”. Smelted products are stored (M1.5) to be sent (M1.6) to the “Handle product” or the following product refining process. Finally, smelting waste is sent to a hazardous product disposal sector (M1.7).
A delivery plan (P4.4) is followed based on the smelting product delivery plan to the final customers (“Handle Product”—P1) and the production plan of the refined product (“Refine material II”—P1). First, with P4.4 information, material consolidation (D1.3) and shipment planning (D1.4) are developed. Then, products are transferred for verification and shipment (D1.8). Finally, the smelted products are prepared for delivery (D1.12) to “Handle Product” or “Refine Material II”. Due to the integration of the “Smelt Material” with both “Refine Material II” and “Handle Product”, some SCOR Process Elements are not modelled, i.e., related to customer order requests (D1.1 and D1.2), load and route planning (D1.4 and D1.5), route and type of transport selection (D1.7), load logistics planning (D1.9-D1.11) and final installation and payment (D1.14 and D1.15).
Refine Material—Refine Material II. As illustrated in Figure 12, concentrates and smelted products are enriched or refined by hydrometallurgical processes. First, “Refine Material II” receives (S1.2) its inputs from two suppliers. On the one hand, the input of concentrated products (PLS and MiCo) from “Treat Material” (D1), and on the other hand, the input of smelted products (anode) from “Smelt Material” (D1). After receiving, product quality is verified (only for PLS and MiCo) and sent to the hydrometallurgical process sector (M1.2). The hydrometallurgical processes are integrated into the mining operations. Therefore, no payment orders to supplier process are considered. Thus, the process element of the SCOR, S1.5, is not modelled.
Once the products are received in M1.2, they can follow different hydrometallurgical processes (M1.3), e.g., solvent extraction, ion exchange, electrowinning, electrorefining, filter, or precipitation. The M1.3 outputs include high-quality refined products (cathodes), enriched products (premium MiCO), by-products, and waste. While by-products are packaged (M1.4) and stockpiled (M1.5) together with refined and enriched products to be sent to the delivery process (M1.6), and waste is sent to a final disposal sector (M1.7).
Following the distribution plan (P4.4), consolidation of materials (D1.3) and shipment planning (D1.4) are carried out. Subsequently, all products are transferred to the final distribution area (D1.8). Finally, products are classified and prepared for shipment (D1.12) to the customer delivery process. The processes element related to customer order (D1.1 and D1.2), load and route planning (D1.4 and D1.5), transport (D1.7), logistics planning (D1.9–D1.11), and final installation and payment (D1.14 and D1.15) are not modelled since “Refine Material II” subprocess is vertically integrated with the “Handle Product” process.
Handle Product. As depicted in Figure 13, a sales plan from the “Sell” process (P1) that leads to a material receiving plan (P2.4), which sets the schedule for product delivery, S1.1. After receipt of the product (S1.2) from the “Refine Material”, they are verified and classified (S1.3). There are two types of product classification: (i) Non-Bulk, which does not require large volumes for distribution, such as cathodes or ingots, and (ii) Bulk, which considers large volumes for distribution, such as Premium MiCo. Products follow different flows (S1.4) depending on their categorization. On the one hand, non-bulk products are transferred directly to the delivery area (D1.8), while bulk products go through a blending process (M2.2).
Non-bulk products are prepared for distribution to the customer based on a distribution plan (P1.4), which is established (D1.3) and planned (D1.4). Once the non-bulk products are received, they are sorted (D1.8) and packaged (D1.10). Finally, these products are prepared for shipment (D1.12) to the “Sell” (S1), which is responsible for distribution to the end customer. The process elements related to customer order (D1.1 and D1.2), load and route planning (D1.4 and D1.5), transport selection (D1.7), logistics planning (D1.9 and D1.11), and final installation and payment (D1.14 and D1.15) are not modelled for Non-Bulk products.
Bulk products must meet the customer’s requirements, e.g., undesirable mineral (arsenic) rates in the premium MiCo, which are planned (M2.1) based on a sales and delivery plan (P1.4). Hence, bulk products with different characteristics are received from various stockpiles (M2.2), then a blending process is carried out (M2.3) in order to obtain the customer’s required product. Next, the product is stored (M2.5) and ready for transfer (M2.6) to the final distribution sector (usually a bulk port). The Bulk Product Business processes described above do not generate waste, so M2.7 is not modelled. Similarly, the M2.4 process element is not considered due to the nature of Bulk Products.
Consolidation (D2.3) and delivery planning (D2.4) are carried out based on the customer’s specific shipping requests (D2.1–D2.2). Then, bulk products with the customer’s particular requirements are transferred (D2.8) and prepared for shipment (D2.12) to the final loading process, which is carried out in the “Sell” (S1). The SCOR process elements related to route planning (D2.5), the selection of route and type of transport (D2.7), logistics planning of loading (D2.9–D2.11), and final installation and payment processes (D2.14 and D2.15) were not modelled in the bulk products flow.
5. MiSCOR Evaluation
The MiSCOR demonstration was carried out on real case projects at one of the world’s largest copper producers of the last decade. The mining company under study, MP1, has its mining district in northern Chile (Chile is the world’s leading copper producer. In 2021, Chile produced 5.6 million tons of copper, equivalent to approximately one-third of world production [62]). MP1 produces copper concentrate, copper cathode, and the by-product molybdenum. In 1998, MP1 started its commercial operations, registering a fine copper production of nearly 50 kMT (thousands of metric tons) [63]. As of June 2022, MP1’s production levels reached more than 600 kMT [62], representing roughly 4% of world copper production. The MP1 Enterprise processes include “Discovery”, “Establish”, “Exploit”, “Beneficiate”, and “Sell”, demonstrating a vertical integration of the whole MiSC’s upstream segment. For the MiSCOR demonstration, we traced 19 operational projects (cf. Appendix A) developed by MP1 since 1995. The traced projects comply with the framework of the Chilean Environmental Impact Assessment System [64]. These projects describe the “Exploit” and “Beneficiate” Enterprise processes in detail. All projects were modelled into all levels of abstraction with MiSCOR. For illustrative purposes, the “Beneficiate” of the “MP1 kickoff project” of 1995 is described and graphically modelled (Figure 14a) and modelled into MiSCOR at abstraction levels 1 (Figure 14b) and 2 (Figure 14c). In addition, MiSCOR abstraction level 3 is modelled from the oxide ore perspective processing of the “Treat Material” of the “MP1 kickoff project” (Figure 15).
As shown in Figure 14a, in 1995, MP1 was planned as a conventional open pit mine extracting oxide and sulphide ore from three mines with an annual copper production rate of 380 kMTD. This production rate is met by stockpiling the oxide ore mined at 15 kton/d (1000 tons per day) in dumps with a 12 Mton (million tons) capacity for blending. Once the oxide ore meets the geological quality required by the treatment plant is reached, it is sent to a crushing circuit (1) at 650 ton/h (tons per hour). The crushed ore is agglomerated with lime and sulfuric acid, forming heaps (2). These heaps are sprinkled with sulfuric acid for several days generating a Pregnant Leach Solution (PLS), which is pumped through the refining sector and processed by solvent extraction (SX) (3), obtaining a copper-rich electrolyte. Finally, this electrolyte is deposited in a cell battery, producing copper cathodes with a purity of 99.99% via the electrowinning process (EW). The copper cathodes are packaged and shipped to a local port for distribution in the mineral market with a production rate of 50 kMT/y (kMT per year).
On the other hand, the sulphide ore is sent from the mine to the crusher circuit (1) at 60 kTon/d. Subsequently, the sulphide ore is dry and wet milled to obtain a pulp of fine material (5) that feeds a flotation cell circuit and is mixed with various reagents to recover the copper sulphides (6). After several flotation, hydro cycling, and regrinding circuits, a copper concentrate (CuCo) and tailings are generated. This concentrate is sent in bulk to the MP1 port sector at a rate of 1 Mtons/year (million tons/year) through a pipeline system and is then received by a thickener, passing from 50% of its weight to 65% of its concentration. Next, this CuCo flows through a filter press system (7), providing a concentrate of 8–9% moisture content. Finally, the concentrate is stockpiled and blended according to the customer’s requirements. Finally, the product is loaded at a rate of 675 tons per hour onto bulk carriers and shipped directly to customers.
As depicted in Figure 15, the processing plant (“Treat Material”) receives the mixed oxidized ore (light green flow) coming from the stockpile sector of the mine (“Handle Material”—D1). After reception (S1.2) and geo-metallurgical classification of the oxide ore (S1.3), it is transferred (S1.4) to the treatment plant. Ore treatment takes place in M1.3, which begins with pre-treatment of the ore through a crushing and agglomeration circuit. Subsequently, this material is heap leached, and after 60 to 90 days, the pregnant leach solution—PLS (green flow) is obtained. From the output of M1.3, it is possible to observe the production of waste from the process (red flow), which continues with its final disposal (M1.7), and the PLS, which continues with its stockpiling (M1.5) and preparation for delivery. Once required by the following process level (“Refined Material II”—S1), the PLS is pumped (D1.12) to the hydrometallurgical processes sector, where the SX and EW processes are carried out to obtain copper cathodes.
An overall evaluation of MiSCOR confirms the ability to represent the industrial dynamics of MiSC’s upstream segment in a standardized model. On the one hand, most projects modelled with MiSCOR, 18 out of 19, fit its three levels of abstraction. Thus, MiSCOR can represent different industrial dynamics that can take place in the upstream segment of MiSC. For example: (i) Production of new products or by-products such as the “Molybdenum (Mo) Recovery from Copper (Cu) Concentrates Project” of August 2004, (ii) Production capacity increase such as the “110 KTPD Concentrator Plant Expansion Project” of March 2001 and “Complementary Facilities to Reach Treatment of 170 ktpd” of September 2017, or (iii) Logistical improvements such as the “Pipeline Modification” project of February 2007.
On the other hand, a project evaluated did not fit into the MiSCOR model. For example, a specific implementation of a new production process from the January 2019 “Infrastructure development and production capacity improvement” project could not be modelled in MiSCOR. The new production process involves the construction of a dynamic heap that mixes low-grade sulphide ore (considered waste in the “Exploit”) and waste from previous leaching processes to get PLS through bioleaching. The inability of MiSCOR to represent the industrial process is because the model design does not consider the waste output as an input for producing mineral products, as shown in Figure 16.
6. Discussion
6.1. Design of MiSCOR
This work constructed MiSCOR, based on a standard model, the SCOR, under the context of the upstream segment of the mineral supply chain, the EM. The systematization in constructing the MiSCOR based on DSR allowed us to describe in a standardized language the “Beneficiate” Enterprise process in three levels of abstraction. The abstraction levels of the MiSCOR contribute to a better understanding of the business processes involved in producing mineral commodities. Moreover, evaluating one of the world’s largest copper operations supports MiSCOR’s ability to be a standard tool for the graphical modelling of the upstream segment of the mineral supply chain.
From a broader perspective, for the full applicability of MiSCOR, it is necessary to model all business processes in the upstream segment of the mineral supply chain. So far, most of the Enterprise processes of the MiSC’s upstream segment have already been modelled, i.e., “Discovery” and “Establish” [43], “Exploit” [42], and “Beneficiate” modelled by ourselves in this work. Therefore, the “Sell” and “Rehabilitate” Enterprise processes remain to be modelled. According to Zúñiga [43], and making the statement our own, the “Sell” would be easy to model in the SCOR context due to its similarity with the “Deliver” process. In contrast, the “Rehabilitate” might require several adaptations for its modelling in SCOR. The reason for the complexity of the modelling is that the “Rehabilitation” aims at closing the industry and returning the mined land to the environment, which SCOR does not contemplate in its current framework.
MiSCOR’s limitation lies in its inability to represent the reuse of waste as a raw material to manufacture mineral products. This limitation results from MiSCOR being based on the standard SCOR framework. The current SCOR framework does not consider waste reuse as a feedstock to produce products, as stated in process element M1.7 (“Waste Disposal”). The “Waste Disposal” element process is responsible for waste collection and management activities. The input of this process element comes as material flow from process element M1.3. The output of M1.7 is still being determined, as the SCOR claims to be connected to an external framework, implying that the final disposal of waste depends on a third party not included in the supply chain. The logical flow of this process fits with the industrial dynamics of the manufacturing sector but not with the reality of the mining industry, where the valorization of mining waste for final disposal and the reuse of mining waste as raw material are standard practices throughout its life cycle [48,49,65].
Mismatches found in MiSCOR point to further deepen this model to make it a reference tool for modelling the upstream segment of the mineral supply chain. In this sense, future work should be directed toward modelling the “Sell” and “Rehabilitate” Enterprise processes. On the one hand, modelling the “Sell” in MiSCOR will provide the basis for seamlessly integrating the upstream and downstream segments of the mineral supply chain. In this way, the entire mineral supply chain can be graphically represented under one standardized model. Furthermore, modelling the “Rehabilitate” process will generate new insights and adaptations of the SCOR model, e.g., the definition of customer and final product in a closure industry situation or the money flow when there are no customers to buy the final product.
6.2. Evaluation of MiSCOR
The MiSCOR model was evaluated by representing 19 real projects of one of the world’s largest copper producers. The scenario chosen for the MiSCOR evaluation was based on the context of a large-scale copper mining company. The evaluated scenarios provided a robust approach and a comprehensive understanding of the upstream segment of MiSC, as large-scale mining companies are typically organized according to supply chain structures [66]. However, there are significant differences between large-scale and medium- and small-scale mining [67], e.g., small-scale mining usually does not have integrated business processes. In addition, the production of non-metallic minerals, such as lithium, may differ in industrial realities and business process understanding compared to scenarios evaluated in this work, e.g., in the “Beneficiation” business process, strictly talk, and metallurgical processes.
Therefore, in future research, it is necessary to develop further evaluation of MiSCOR in the context of mining companies of different scales, as well as in other types of mining production. In this way, we will be able to validate the MiSCOR as a robust and standardized model for the upstream segment of the mineral supply chain.
6.3. Implication of MiSCOR for Decision-Makers
MiSCOR’s construction carries implications for decision-makers in the MiSC’s upstream segment. On the one hand, MiSCOR addresses a predominant problem, “functional silos” [66,68]. These silos cause isolated operations within the upstream segment of the mineral supply chain, where decision-making responsibilities prioritize individual processes over holistic optimization. The management of these silos has led to conflicting key performance indicators (KPIs) among different business processes. For instance, the “Exploit” process focuses on reducing blasting costs, which increases rock sizes, negatively affecting the subsequent process, “Beneficiate”, which focuses on mineral recovery. MiSCOR’s standardized modelling, based on the SCOR model, breaks down these barriers. It fosters cross-sectional collaboration by establishing standardized modelling language and interrelated KPIs between processes.
On the other hand, the MiSC’s upstream segment industry faces constant pressures from market changes, regulations, and social and environmental concerns. Therefore, decision-making must be based on a sustainable perspective. Sustainable decision-making lies in specific parameters and valuation methods, which continue to be a challenge from the point of view of managing this segment. Currently, frameworks for sustainable commodity assessment lack integration and standardization, leaving a significant gap [66,69]. MiSCOR can help in this regard by facilitating the integration of standardized environmental and social-focused KPIs [70] via its language modelling standardized allows for developing a unified approach to sustainability assessment, making it a valuable tool for sustainable decision-makers.
7. Conclusions
In this study, we have built the basis of a reference model for the upstream segment of the mineral supply chain, MiSCOR. This model has mainly solved two challenges in mineral supply chain modelling. First, MiSCOR provides a better understanding of upstream industry dynamics to stakeholders along the minerals supply chain through a standard modelling language. Second, we have presented MiSCOR as a standardized modelling framework that can be seamlessly integrated with existing models.
The DSR methodology employed in this study established a systematic process for building and applying MiSCOR. The transparent and systematic DSR methods helped to define and focus the problem driving the construction of MiSCOR and to specify the requirements for MiSCOR design, MiSCOR design processes, and MiSCOR evaluation. In addition, the systematization of the methodology followed in this study makes it applicable to similar model-building situations.
A design strategy based on reusing reference models and their adaptation was followed to build MiSCOR. A matching process technique was developed between the SCOR and EM reference models to establish the similarity capability between them. This technique confirmed the high adaptability and feasibility for adaptation and integration of the reused reference models at their abstraction levels 1 and 2. However, at abstraction level 3, it demonstrated the inability of the SCOR model to represent the industrial dynamics of the upstream segment of the MiSC. Therefore, it was necessary to use an external business process modelling toolbox.
The MiSCOR evaluation was applied to one of the largest copper mining companies, where several operating scenarios were modeled between the years 1995 and 2019. The ability of MiSCOR to represent most of the scenarios establishes the robustness and effectiveness of the model built. However, for the validation of MiSCOR as a standard model, evaluations are still required in other industrial contexts within MiSC’s upstream segment, such as medium- and small-scale mining companies, as well as in non-metals mineral producers.
MiSCOR would have important implications for decision-makers in the MiSC’s upstream segment. The model would help to break down functional silos, establish transparency and homogeneity between the different levels of the upstream segment of the minerals supply chain, and could be used as a critical tool to support decision-makers.
This work not only addresses existing challenges in modelling the upstream segment of the minerals supply chain but also introduces a standardized tool that has the potential to revolutionize the way we understand and manage the complexities of this industry sector. The results of this research have practical implications for supply chain management practitioners and researchers since MiSCOR offers a blueprint for the future to make mineral supply chains more transparent, efficient, and resilient.
Author Contributions
Conceptualization, R.C.-V.; methodology, R.C.-V. and G.I.; validation, R.C.-V. and G.I.; formal analysis, R.C.-V.; investigation, R.C.-V. and G.I.; resources, R.C.-V.; writing—original draft preparation, R.C.-V.; writing—review and editing, R.C.-V., G.I. and K.-D.T.; supervision, K.-D.T. All authors have read and agreed to the published version of the manuscript.
Funding
This research was funded by Agencia Nacional de Investigación y Desarrollo–ANID, grant number 72200439.
Data Availability Statement
All information on the projects evaluated in this research can be found (open access) on the official website of the Environmental Assessment Service of the Government of Chile, https://www.sea.gob.cl/, last accessed on 30 June 2023.
Acknowledgments
The authors thank the International Graduate School for Dynamics in Logistics (IGS) of the University of Bremen.
Conflicts of Interest
The authors declare no conflict of interest.
Appendix A

Table A1.
Operational Project List of MP1.
| N° | Project Name (Spanish) | Project Name (English *) | Submission |
|---|---|---|---|
| 1 | MP1 Inicio | MP1 Kickoff | Jun-1995 |
| 2 | Proyecto Expansión 110 KTPD Planta Concentradora | 110 KTPD Concentrator Plant Expansion Project | Mar-2001 |
| 3 | Proyecto Optimización | Optimization Project | Jun-2003 |
| 4 | Proyecto Recuperación de Molibdeno (Mo) desde Concentrados de Cobre (Cu) | Molybdenum (Mo) Recovery from Copper (Cu) Concentrates Project | Aug-2004 |
| 5 | Modificaciones al Proceso de Recuperación de Cu desde Minerales Lixiviables | Modifications to the Cu Recovery Process from Leachable Minerals | Oct-2004 |
| 6 | Proyecto Explotación Rajo Huinquintipa Este | Huinquintipa East Pit Exploitation Project | Mar-2005 |
| 7 | Proyecto Explotación Depósitos Huinquintipa Este Fases II y III | Exploitation Project Huinquintipa East Deposits Phases II-III | Dec-2006 |
| 8 | Modificación Mineroducto (e-seia) | Pipeline Modification | Feb-2007 |
| 9 | Proyecto Explotación Depósito Huinquintipa Este Fase IV | Exploitation Project Huinquintipa East Deposit Phase IV | Jun-2007 |
| 10 | Adecuación de Áreas de Lixiviación | Adequacy of Leaching Areas | Nov-2007 |
| 11 | Proyecto Planta Nanofiltración | Nanofiltration Plant Project | Dec-2007 |
| 12 | Socavón Rampa de Prospección Rosario | Rosario Prospecting Ramp Pit | Jun-2008 |
| 13 | Proyecto Optimización a 170 KTPD | Optimization Project to 170 KTPD | Aug-2009 |
| 14 | Explotación Rosario Sur I y II | Rosario Sur I and II Exploitation | Nov-2010 |
| 15 | Sondaje de Prospección Rosario Oeste | Rosario West Prospecting Drilling | Feb-2011 |
| 16 | Continuidad Relaves Convencionales, Depósito Pampa Pabellón | Continuity of Conventional Tailings, Pampa Pabellón Deposit | May-2014 |
| 17 | Aumento Capacidad Pad 1 | Pad 1 Capacity Increase | Feb-2015 |
| 18 | Instalaciones Complementarias para Alcanzar Tratamiento de 170 ktpd | Complementary Facilities to Reach Treatment of 170 ktpd | Sep-2017 |
| 19 | Desarrollo de Infraestructura y Mejoramiento de Capacidad Productiva | Infrastructure Development and Productive Capacity Upgrade | Jan-2019 |
* Project names translation from Spanish to English done by Raúl Castillo-Villagra.
References
- IEA. Net Zero by 2050: A Roadmap for the Global Energy Sector; IEA: Paris, Francia, 2021; Available online: https://www.iea.org/reports/net-zero-by-2050 (accessed on 23 February 2023).
- IEA. The Role of Critical Minerals in Clean Energy Transitions; IEA: Paris, Francia, 2021; Available online: https://www.iea.org/reports/the-role-of-critical-minerals-in-clean-energy-transitions (accessed on 23 February 2023).
- IEA. World Energy Outlook 2020; IEA: Paris, Francia, 2020; Available online: https://www.iea.org/reports/world-energy-outlook-2020 (accessed on 23 February 2023).
- Arroyo Ortiz, C.E.; Viana Júnior, E.M. Rare Earth Elements in the International Economic Scenario. Min. Min. 2014, 67, 361–366. [Google Scholar] [CrossRef]
- Sauer, P.C.; Seuring, S. Sustainable supply chain management for minerals. J. Clean. Prod. 2017, 151, 235–249. [Google Scholar] [CrossRef]
- Giese, E.C. Strategic minerals: Global challenges post-COVID-19. Extr. Ind. Soc. 2022, 12, 101113. [Google Scholar] [CrossRef]
- Wen, W.; Yang, S.; Zhou, P.; Gao, S.Z. Impacts of COVID-19 on the electric vehicle industry: Evidence from China. Renew. Sustain. Energy Rev. 2021, 144, 111024. [Google Scholar] [CrossRef]
- Mubarik, M.S.; Kusi-Sarpong, S.; Govindan, K.; Khan, S.A.; Oyedijo, A. Supply chain mapping: A proposed construct. Int. J. Prod. Res. 2021, 61, 2653–2669. [Google Scholar] [CrossRef]
- MacCarthy, B.L.; Ahmed, W.A.; Demirel, G. Mapping the supply chain: Why, what and how? Int. J. Prod. Econ. 2022, 250, 108688. [Google Scholar] [CrossRef]
- Sprecher, B.; Daigo, I.; Murakami, S.; Kleijn, R.; Vos, M.; Kramer, G.J. Framework for resilience in material supply chains, with a case study from the 2010 Rare Earth Crisis. Environ. Sci. Technol. 2015, 49, 6740–6750. [Google Scholar] [CrossRef] [PubMed]
- Mancheri, N.A.; Sprecher, B.; Bailey, G.; Ge, J.; Tukker, A. Effect of Chinese policies on rare earth supply chain resilience. Resour. Conserv. Recycl. 2019, 142, 101–112. [Google Scholar] [CrossRef]
- Lim-Camacho, L.; Jeanneret, T.; Hodgkinson, J.H. Towards resilient, responsive and rewarding mining: An adaptive value chains approach. Resour. Policy 2019, 74, 101465. [Google Scholar] [CrossRef]
- Makki, M.; Ali, S.H. Gemstone supply chains and development in Pakistan: Analyzing the post-Taliban emerald economy in the Swat Valley. Geoforum 2019, 100, 166–175. [Google Scholar] [CrossRef]
- Zeng, L.; Liu, S.Q.; Kozan, E.; Corry, P.; Masoud, M. A comprehensive interdisciplinary review of mine supply chain management. Resour. Policy 2021, 74, 102274. [Google Scholar] [CrossRef]
- Sauer, P.C.; Seuring, S. Extending the reach of multi-tier sustainable supply chain management—Insights from mineral supply chains. Int. J. Prod. Econ. 2019, 217, 31–43. [Google Scholar] [CrossRef]
- Budeba, M.D.; Joubert, J.W.; Webber-Youngman, R. Modelling and Determining the Technical Efficiency of a Surface Coal Mine Supply Chain. J. S. Afr. Inst. Min. Metall. 2014, 114, 1001–1008. [Google Scholar]
- Fettke, P.; Loos, P. Classification of Reference Models: A Methodology and its Application. Inf. Syst. E-Bus. Manag. 2003, 1, 35–53. [Google Scholar] [CrossRef]
- Fettke, P.; Loos, P. Perspectives on Reference Modeling. In Reference Modeling for Business Systems Analysis; Fettke, P., Loos, P., Eds.; IGI Global: Hershey, PA, USA, 2007; pp. 1–21. ISBN 9781599040547. [Google Scholar]
- Thomas, O. Understanding the Term Reference Model in Information Systems Research: History, Literature Analysis and Explanation. In Business Process Management Workshops; Hutchison, D., Kanade, T., Kittler, J., Kleinberg, J.M., Mattern, F., Mitchell, J.C., Naor, M., Nierstrasz, O., Pandu Rangan, C., Steffen, B., et al., Eds.; Springer: Berlin/Heidelberg, Germany, 2006; pp. 484–496. ISBN 978-3-540-32595-6. [Google Scholar]
- Georgise, F.B.; Wuest, T.; Thoben, K.-D. SCOR model application in developing countries: Challenges & requirements. Prod. Plan. Control. 2017, 28, 17–32. [Google Scholar] [CrossRef]
- APICS. Supply Chain Operations Reference Model: SCOR; APICS: Chicago, IL, USA, 2017. [Google Scholar]
- EMMM Forum. The Exploration and Mining Business Reference Model; EMMM Forum: Reading, UK, 2013. [Google Scholar]
- Johannesson, P.; Perjons, E. An Introduction to Design Science; Springer International Publishing: Cham, Germany, 2014; ISBN 978-3-319-10631-1. [Google Scholar]
- Gregor, S.; Hevner, A.R. Positioning and Presenting Design Science Research for Maximum Impact. MIS Q. 2013, 37, 337–355. [Google Scholar] [CrossRef]
- Grant, M.J.; Booth, A. A typology of reviews: An analysis of 14 review types and associated methodologies. Health Info. Libr. J. 2009, 26, 91–108. [Google Scholar] [CrossRef]
- Beheshti, S.-M.-R.; Benatallah, B.; Sakr, S.; Grigori, D.; Motahari-Nezhad, H.R.; Barukh, M.C.; Gater, A.; Ryu, S.H. Process Matching Techniques. In Process Analytics; Beheshti, S.-M.-R., Benatallah, B., Sakr, S., Grigori, D., Motahari-Nezhad, H.R., Barukh, M.C., Gater, A., Ryu, S.H., Eds.; Springer International Publishing: Cham, Germany, 2016; pp. 61–90. ISBN 978-3-319-25036-6. [Google Scholar]
- Ostrowski, L.; Helfert, M. Business Process Modelling in Design Science Paradigm. In Design Science: Perspectives from Europe; Helfert, M., Donnellan, B., Kenneally, J., Eds.; Springer International Publishing: Cham, Germany, 2014; pp. 111–122. ISBN 978-3-319-13935-7. [Google Scholar]
- Goel, K.; Bandara, W.; Gable, G. A Typology of Business Process Standardization Strategies. Bus. Inf. Syst. Eng. 2021, 63, 621–635. [Google Scholar] [CrossRef]
- Steinberg, J.G.; de Tomi, G. Lean mining: Principles for modelling and improving processes of mineral value chains. Int. J. Logist. Syst. Manag. 2010, 6, 279. [Google Scholar] [CrossRef]
- Nader, B.; Sachs, P.F.; de Tomi, G. The mine value chain integration beyond the ERP systems. Int. J. Min. Miner. Eng. 2011, 3, 233. [Google Scholar] [CrossRef]
- Soto-Viruet, Y.; Menzie, W.D.; Papp, J.F.; Yager, T.R. An Exploration in Mineral Supply Chain Mapping Using Tantalum as an Example; USGS: Reston, VA, USA, 2013. Available online: https://pubs.usgs.gov/of/2013/1239/pdf/ofr2013-1239.pdf (accessed on 1 November 2023).
- Agudelo, I. Supply Chain Management in the Cement Industry. Master’s Thesis, Massachusetts Institute of Technology, Cambridge, MA, USA, 2009. [Google Scholar]
- Lim-Camacho, L.; Plagányi, É.; Crimp, S.; Hodgkinson, J.H.; Hobday, A.J.; Howden, S.M.; Loechel, B. Complex resource supply chains display higher resilience to simulated climate shocks. Glob. Environ. Chang. 2017, 46, 126–138. [Google Scholar] [CrossRef]
- Sprecher, B.; Daigo, I.; Spekkink, W.; Vos, M.; Kleijn, R.; Murakami, S.; Kramer, G.J. Novel Indicators for the Quantification of Resilience in Critical Material Supply Chains, with a 2010 Rare Earth Crisis Case Study. Environ. Sci. Technol. 2017, 51, 3860–3870. [Google Scholar] [CrossRef] [PubMed]
- Mancheri, N.A.; Sprecher, B.; Deetman, S.; Young, S.B.; Bleischwitz, R.; Dong, L.; Kleijn, R.; Tukker, A. Resilience in the tantalum supply chain. Resour. Conserv. Recycl. 2018, 129, 56–69. [Google Scholar] [CrossRef]
- van den Brink, S.; Kleijn, R.; Sprecher, B.; Tukker, A. Identifying supply risks by mapping the cobalt supply chain. Resour. Conserv. Recycl. 2020, 156, 104743. [Google Scholar] [CrossRef]
- KEK, V.; Nadeem, S.P.; Ravichandran, M.; Ethirajan, M.; Kandasamy, J. Resilience strategies to recover from the cascading ripple effect in a copper supply chain through project management. Oper. Manag. Res. 2022, 15, 440–460. [Google Scholar] [CrossRef]
- Akbari-Kasgari, M.; Khademi-Zare, H.; Fakhrzad, M.B.; Hajiaghaei-Keshteli, M.; Honarvar, M. Designing a resilient and sustainable closed-loop supply chain network in copper industry. Clean Technol. Environ. Policy 2022, 24, 1553–1580. [Google Scholar] [CrossRef]
- Osborne, D.; Smith, G.; Mann, B. 18-Supply chain management for bulk materials in the coal industry. In The Coal Handbook: Towards Cleaner Production; Elsevier: Amsterdam, The Netherlands, 2013; pp. 589–627. ISBN 9780857094223. [Google Scholar]
- Osborne, D.; Dempsey, F. 19-Supply chain management for bulk materials in the coal industry. In The Coal Handbook, 2nd ed.; Elsevier: Amsterdam, The Netherlands, 2023; pp. 619–664. ISBN 9780128243282. [Google Scholar]
- Bjørndal, T.; Herrero, I.; Newman, A.; Romero, C.; Weintraub, A. Operations Research in the Natural Resource Industry. Int. Trans. Oper. Res. 2012, 19, 39–62. [Google Scholar] [CrossRef]
- Zuñiga, R.; Wuest, T.; Thoben, K.-D. Comparing mining and manufacturing supply chain processes: Challenges and requirements. Prod. Plan. Control 2015, 26, 81–96. [Google Scholar] [CrossRef]
- Zuñiga, R. Modeling of Supply Chain Processes of the Mineral Raw Materials Industry from the Perspective of EM, SCOR and DCOR Models. Ph.D. Thesis, Universität Bremen, Bremen, Germany, 2015. [Google Scholar]
- Leal Gomes Leite, J.M.; Arruda, E.F.; Bahiense, L.; Marujo, L.G. Modeling the integrated mine-to-client supply chain: A survey. Int. J. Min. Reclam. Environ. 2020, 34, 247–293. [Google Scholar] [CrossRef]
- Caro, R.; Epstein, R.; Santibañez, P.; Weintraub, A. An Integrated Approach to the Long-Term Planning Process in the Copper Mining Industry. In Handbook of Operations Research in Natural Resources; Weintraub, A., Romero, C., Bjørndal, T., Epstein, R., Miranda, J., Eds.; Springer US: Boston, MA, USA, 2007; pp. 595–609. ISBN 978-0-387-71814-9. [Google Scholar]
- Córdova, E.; Mobarec, V.; Pizarro, E.; Videla, A.R. A Structured Key Cost Analysis Methodology to Identify Value-Contributing Activities in Mining Projects: A case study of the Chuquicamata Underground Project. J. S. Afr. Inst. Min. Metall. 2018, 118, 279–288. [Google Scholar] [CrossRef]
- Fung, J.; Singh, G.; Zinder, Y. Capacity planning in supply chains of mineral resources. Inf. Sci. 2015, 316, 397–418. [Google Scholar] [CrossRef]
- Lèbre, É.; Corder, G. Integrating Industrial Ecology Thinking into the Management of Mining Waste. Resources 2015, 4, 765–786. [Google Scholar] [CrossRef]
- Lèbre, É.; Corder, G.; Golev, A. The Role of the Mining Industry in a Circular Economy: A Framework for Resource Management at the Mine Site Level. J. Ind. Ecol. 2017, 21, 662–672. [Google Scholar] [CrossRef]
- Lèbre, É.; Corder, G.D.; Golev, A. Sustainable practices in the management of mining waste: A focus on the mineral resource. Miner. Eng. 2017, 107, 34–42. [Google Scholar] [CrossRef]
- Castillo-Villagra, R.; Thoben, K.-D. Towards Supply Chain Resilience in Mining Industry: A Literature Analysis. In Dynamics in Logistics; Freitag, M., Kinra, A., Kotzab, H., Megow, N., Eds.; Springer International Publishing: Cham, Germany, 2022; pp. 92–103. ISBN 978-3-031-05358-0. [Google Scholar]
- APICS. Design Chain Operation Reference Model: DCOR; APICS: Chicago, IL, USA, 2014; Available online: http://www.apics.org/docs/default-source/scc-non-research/dcor-framework-a4.pdf?sfvrsn=2 (accessed on 23 February 2023).
- Huan, S.H.; Sheoran, S.K.; Wang, G. A review and analysis of supply chain operations reference (SCOR) model. Supply Chain Manag. Int. J. 2004, 9, 23–29. [Google Scholar] [CrossRef]
- Verdouw, C.N.; Beulens, A.; Trienekens, J.H.; van der Vorst, J. A framework for modelling business processes in demand-driven supply chains. Prod. Plan. Control 2011, 22, 365–388. [Google Scholar] [CrossRef]
- Darling, P. SME Mining Engineering Handbook, 3rd ed.; Society for Mining Metallurgy and Exploration: Englewood, CO, USA, 2011; ISBN 978-0-87335-264-2. [Google Scholar]
- OMG. Business Process Model and Notation (BPMN): Version 2.0; OMG: Agawam, MA, USA, 2010; Available online: https://www.omg.org/spec/BPMN/2.0/PDF (accessed on 23 February 2023).
- Cheng, J.C.; Law, K.H.; Bjornsson, H.; Jones, A.; Sriram, R.D. Modeling and monitoring of construction supply chains. Adv. Eng. Inform. 2010, 24, 435–455. [Google Scholar] [CrossRef]
- Lhassan, E.; Ali, R.; Majda, F. Combining SCOR and BPMN to support supply chain decision-making of the pharmaceutical wholesaler-distributors. In Proceedings of the 2018 4th International Conference on Logistics Operations Management (GOL), Le Havre, France, 10–12 April 2018; IEEE: Piscataway, NJ, USA, 2018; pp. 1–9. [Google Scholar]
- Torres, M.A. Análise de Linguagens de Modelagem de Processos de um Modelo de Referência na Cadeia de Suprimentos. Master’s Thesis, Universidade Estadual Paulista, São Paulo, Brazil, 2011. [Google Scholar]
- Zor, S.; Görlach, K.; Leymann, F. Using BPMN for Modeling Manufacturing Processes. In Proceedings of the Sustainable Production and Logistics in Global Networks: 43rd CIRP International Conference on Manufacturing Systems, Vienna, Austria, 26–28 May 2010; Sihn, W., Kuhlang, P., Eds.; NWV: Wien, Austria, 2010. ISBN 9783708306865. [Google Scholar]
- Sachs, P.F.T. Cadeia de Valor Mineral e Tecnologia da Informação: Alinhamento Estratégico Como Gerador de Eficácia em Empresas de Mineração. Ph.D. Thesis, Escola Politécnica, São Paulo, Brazil, 2009. [Google Scholar]
- ICSG. The World Copper Factbook 2022; ICSG: Lisbon, Portugal, 2022; Available online: https://icsg.org/copper-factbook/ (accessed on 23 February 2023).
- Cochilco. Yearbook: Copper and Other Mineral Statistics 1997–2016; Cochilco: Santiago, Chile, 2017; Available online: https://www.cochilco.cl/Lists/Anuario/Attachments/17/Anuario-%20avance7-10-7-17.pdf (accessed on 23 February 2023).
- SEA—Chilean Government. Servicio de Evaluación Ambiental. Available online: https://www.sea.gob.cl/ (accessed on 28 February 2023).
- Dominy, S.; O’Connor, L.; Parbhakar-Fox, A.; Glass, H.; Purevgerel, S. Geometallurgy—A Route to More Resilient Mine Operations. Minerals 2018, 8, 560. [Google Scholar] [CrossRef]
- Pimentel, B.S.; Gonzalez, E.S.; Barbosa, G.N. Decision-support models for sustainable mining networks: Fundamentals and challenges. J. Clean. Prod. 2016, 112, 2145–2157. [Google Scholar] [CrossRef]
- World Bank Group. Mining Together: Large-Scale Mining Meets Artisanal Mining—A Guide for Action; World Bank Group: Washington, DC, USA, 2009; Available online: http://documents.worldbank.org/curated/en/148081468163163514/Mining-together-large-scale-mining-meets-artisanal-mining-a-guide-for-action (accessed on 30 October 2023).
- Higgins, L.; Marshall, A.; Crysel, K.; Dencik, J. From efficiencies to transformation—Tapping the full potential of process mining. Strat. Leadersh. 2023, 51, 31–36. [Google Scholar] [CrossRef]
- McLellan, B.C.; Corder, G.D.; Giurco, D.; Green, S. Incorporating sustainable development in the design of mineral processing operations—Review and analysis of current approaches. J. Clean. Prod. 2009, 17, 1414–1425. [Google Scholar] [CrossRef]
- Stohler, M.; Rebs, T.; Brandenburg, M. Toward the Integration of Sustainability Metrics into the Supply Chain Operations Reference (SCOR) Model. In Social and Environmental Dimensions of Organizations and Supply Chains; Brandenburg, M., Hahn, G.J., Rebs, T., Eds.; Springer International Publishing: Cham, Germany, 2018; pp. 49–60. ISBN 978-3-319-59586-3. [Google Scholar]
Figure 1.
Roadmap of the DSR methodology based on Johannesson and Perjons [23].
Figure 1.
Roadmap of the DSR methodology based on Johannesson and Perjons [23].

Figure 2.
The research gap of standardized modelling in the upstream segment of the mineral supply chain (a) the Mineral Supply Chain model adapted from Castillo-Villagra and Thoben [51]. (b) Representation of standardized MiSC modelling based on the SCOR family models.
Figure 2.
The research gap of standardized modelling in the upstream segment of the mineral supply chain (a) the Mineral Supply Chain model adapted from Castillo-Villagra and Thoben [51]. (b) Representation of standardized MiSC modelling based on the SCOR family models.

Figure 3.
The EM breakdown based on EMMM Forum [22]. The highest level processes represent core Enterprise processes. The mid-level processes show the “Beneficiate” Value Chain process breakdown. The lowest level processes depict the “treat material” Business processes breakdown.
Figure 3.
The EM breakdown based on EMMM Forum [22]. The highest level processes represent core Enterprise processes. The mid-level processes show the “Beneficiate” Value Chain process breakdown. The lowest level processes depict the “treat material” Business processes breakdown.

Figure 4.
The SCOR breakdown based on APICS [21]. The highest level processes represent the major processes. The mid-level processes show a major process breakdown of the “Make process”. The lowest level processes represent the “MTS” (Make-to-Stock) process elements.
Figure 4.
The SCOR breakdown based on APICS [21]. The highest level processes represent the major processes. The mid-level processes show a major process breakdown of the “Make process”. The lowest level processes represent the “MTS” (Make-to-Stock) process elements.

Figure 5.
Terminology’s aspect match between EM and SCOR. On the left is the breakdown of “Beneficiate” process of the EM. On the right is the breakdown of the “Make” process of the SCOR.
Figure 5.
Terminology’s aspect match between EM and SCOR. On the left is the breakdown of “Beneficiate” process of the EM. On the right is the breakdown of the “Make” process of the SCOR.

Figure 6.
Granularity’s aspect match between EM and SCOR. The similarity in granularity into the highest level process of the EM (left) and SCOR (right). Granularity is higher in SCOR at the mid and lowest levels.
Figure 6.
Granularity’s aspect match between EM and SCOR. The similarity in granularity into the highest level process of the EM (left) and SCOR (right). Granularity is higher in SCOR at the mid and lowest levels.

Figure 7.
MiSCOR Abstraction Level 1. Modelling of the EM’s “Beneficiate” Enterprise process into SCOR, Highest Level Processes—Abstraction Level 1.
Figure 7.
MiSCOR Abstraction Level 1. Modelling of the EM’s “Beneficiate” Enterprise process into SCOR, Highest Level Processes—Abstraction Level 1.

Figure 8.
MiSCOR Abstraction Level 2. Modelling of the Value Chain processes of the EM’s “Beneficiate” Enterprise process (a) into SCOR (b), Mid-Level Processes—Abstraction Level 2.
Figure 8.
MiSCOR Abstraction Level 2. Modelling of the Value Chain processes of the EM’s “Beneficiate” Enterprise process (a) into SCOR (b), Mid-Level Processes—Abstraction Level 2.

Figure 9.
MiSCOR—“Handle Material”. Modelling of the EM’s “Handle Material” Value Chain process into SCOR. “Exploit” on the left is modelled at abstraction level 2. “Handle material” in the middle is modelled at abstraction level 3. “Treat material” on the right is modelled at abstraction level 2.
Figure 9.
MiSCOR—“Handle Material”. Modelling of the EM’s “Handle Material” Value Chain process into SCOR. “Exploit” on the left is modelled at abstraction level 2. “Handle material” in the middle is modelled at abstraction level 3. “Treat material” on the right is modelled at abstraction level 2.

Figure 10.
MiSCOR—“Treat Material”. Modelling of the EM’s “Treat Material” Value Chain process into SCOR. “Handle Material” on the left is modelled at abstraction level 2. “Treat material” in the middle is modelled at abstraction level 3. “Refine Material” on the right is modelled at abstraction level 2.

Figure 11.
MiSCOR—“Refine Material—Smelt Material”. Modelling of the EM’s “Smelt Material” Business process into SCOR. “Treat Material” on the left is modelled at abstraction level 2. “Smelt Material” in the middle is modelled at abstraction level 3. “Refine Material II” and “Handle Product” on the right are modelled at abstraction level 2.

Figure 12.
MiSCOR—“Refine Material—Refine Material II”. Modelling of the EM’s “Refine Material II” Business process into SCOR. “Smelt Material” and “Treat Material” on the left are modelled at abstraction level 2. “Refine Material II” in the middle is modelled at abstraction level 3. “Handle Product” on the right is modelled at abstraction level 2.

Figure 13.
MiSCOR—“Handle Product”. Modelling of the EM’s “Handle Product” Value Chain process into SCOR. “Refine Material” on the left is modelled at abstraction level 2. “Handle Product” in the middle is modelled at abstraction level 3. “Sell” on the right is modelled at abstraction level 2.
Figure 13.
MiSCOR—“Handle Product”. Modelling of the EM’s “Handle Product” Value Chain process into SCOR. “Refine Material” on the left is modelled at abstraction level 2. “Handle Product” in the middle is modelled at abstraction level 3. “Sell” on the right is modelled at abstraction level 2.

Figure 14.
Graphical modelling of the “MP1 kickoff project” from 1995 (a). MiSCOR Modelling of the “MP1 kickoff project” into abstraction levels 1 (b) and 2 (c).
Figure 14.
Graphical modelling of the “MP1 kickoff project” from 1995 (a). MiSCOR Modelling of the “MP1 kickoff project” into abstraction levels 1 (b) and 2 (c).

Figure 15.
MiSCOR modelling “Treat Material” of the 1995 “MP1 Initial Project” from the mineral oxide perspective, abstraction level 3 (in the middle). The stockpile mine sector (“Handle Material”) on the left is modelled at abstraction level 2. The SX-EW process (“Refine Material II”) on the right is modelled at abstraction level 2.

Figure 16.
Graphical representation of the modelling limitation of real cases in MiSCOR.

Disclaimer/Publisher’s Note: The statements, opinions and data contained in all publications are solely those of the individual author(s) and contributor(s) and not of MDPI and/or the editor(s). MDPI and/or the editor(s) disclaim responsibility for any injury to people or property resulting from any ideas, methods, instructions or products referred to in the content. |
© 2023 by the authors. Licensee MDPI, Basel, Switzerland. This article is an open access article distributed under the terms and conditions of the Creative Commons Attribution (CC BY) license (https://creativecommons.org/licenses/by/4.0/).
Share and Cite
MDPI and ACS Style
Castillo-Villagra, R.; Icarte, G.; Thoben, K.-D. Modelling the Make Process of the Mineral Supply Chain Upstream Segment. Resources 2023, 12, 132. https://doi.org/10.3390/resources12110132
AMA Style
Castillo-Villagra R, Icarte G, Thoben K-D. Modelling the Make Process of the Mineral Supply Chain Upstream Segment. Resources. 2023; 12(11):132. https://doi.org/10.3390/resources12110132
Chicago/Turabian StyleCastillo-Villagra, Raúl, Gabriel Icarte, and Klaus-Dieter Thoben. 2023. "Modelling the Make Process of the Mineral Supply Chain Upstream Segment" Resources 12, no. 11: 132. https://doi.org/10.3390/resources12110132
Note that from the first issue of 2016, this journal uses article numbers instead of page numbers. See further details here.