Article

The Platinization of Graphite Composites Turns Widespread and Low-Cost Materials into Hydrogen Peroxide Sensors and High-Value Biosensor Transducers

1
Dipartimento di Scienze Biomediche, Università Degli Studi di Sassari, Viale San Pietro 43/B, 07100 Sassari, Italy
2
Dipartimento di Medicina, Chirurgia e Farmacia, Università Degli Studi di Sassari, Viale San Pietro 43/B, 07100 Sassari, Italy
3
Institute of Sciences of Food Production, National Research Council, 07100 Sassari, Italy
*
Author to whom correspondence should be addressed.
Chemosensors 2023, 11(3), 153; https://doi.org/10.3390/chemosensors11030153
Submission received: 17 January 2023 / Revised: 17 February 2023 / Accepted: 20 February 2023 / Published: 21 February 2023
(This article belongs to the Special Issue Carbon Nanomaterials and Related Materials for Sensing Applications)

Abstract

:
Electrochemical microsensors and biosensors have been widely used in many fields, in particular neurochemical monitoring, because of their features. Usually, hydrogen peroxide (HP), obtained as a by-product of an enzymatic reaction, is the detected compound on transducers made of precious metals, in particular platinum. The over-time increase in the price of platinum and its alloys requires the use of miniaturizable low-cost supports that can be suitably modified with the deposition of Pt particles; among them, graphite is the most widespread. In the present paper, carbon-composition resistors (CCRs) and pencil leads (PLs) of different diameters (0.3, 0.5 and 2.0 mm), mainly made up of graphite, clay and some other components were used as carbonaceous support for the deposition of platinum. Platinizations were carried out by means of cyclic voltammetry (CV) and constant potential amperometry (CPA) techniques. On the platinized supports, hydrogen peroxide (HP) and ascorbic acid (AA) sensitivity were assessed in order to verify the possibility of using them as transducers of amperometric biosensors. All the used protocols determined the occurrence of HP monitoring, not appreciable on carbonaceous surfaces. We chose 0.3 mm Ø PLs for the construction of glucose biosensors by appropriately modifying the platinum surface layering, a permselective polymer, an enzyme booster, the glucose oxidase (GOx) enzyme and a containing network. The biosensor constructed in this way demonstrated a behavior comparable to that obtained using classic platinum wires.

Graphical Abstract

1. Introduction

Electrochemical microsensors and biosensors have been widely used in many fields such as food processing [1,2,3,4,5,6], environmental monitoring, pre-clinical and clinical applications [7,8,9,10], and many more purposes. One of the most widespread applications for amperometric biosensors is to study the physiological and pathological mechanisms of the brain in animal models. Despite being invasive devices, biosensors are particularly suitable for neurochemical monitoring because they possess high spatial and temporal resolutions [11,12] and also a high sensitivity [13,14,15,16] compared with other non-invasive techniques [17,18].
Implantable biosensors are composed not only by a signal transducer, suitably modified with immobilized compounds, but also a recognition element; both are needed to improve the devices’ sensitivity and selectivity [11,19]. Accuracy and precision, as well as stability and miniaturization, are important features that characterize biosensors and make them such widely used devices [20,21,22].
Implantable enzyme-based biosensors are the ones most extensively used for pre-clinical uses, and oxidase enzymes are the most exploited for biocatalysis [23,24,25,26,27,28,29,30]. This class of enzyme possesses covalently bounded co-factors [23,31], which make it easy to engineer, and it is also oxygen-dependent [23], so hydrogen peroxide (HP) is a by-product, as previously reported [32,33,34,35,36]. The reaction mechanism was previously described [32,37]:
substrate + EOx/FAD → product + EOx/FADH2
EOx/FADH2 + O2 → EOx/FAD + H2O2
HP is well detected on precious metals such as palladium (Pd), gold (Au) and principally platinum (Pt) due to their catalytic proprieties [38]. The anodic monitoring of enzyme-produced H2O2 has been the most broadly used approach for biosensor signal transduction [32]:
H2O2 → O2 + 2H+ + 2e
The over-time increase in the price of platinum and its alloys [39,40,41], but the simultaneous need to use platinum as a transducer for the detection of HP, requires the use of miniaturizable low-cost supports that can be suitably modified with the deposition of Pt particles [42]. Due to their capacity to counterbalance each other’s shortcomings, the interaction between platinum catalysts and carbon-based supports is became of great interest [42,43]. Owing to their exceptional properties, such as their adaptable shape, size, and porosity, chemical stability, corrosion resistance, cost, strong thermal resistance, and electrical conductivity, carbon materials are of particular interest for the deposition of precious metal by means of electrochemical techniques [44,45,46].
In the present paper, for the first time in the literature, carbon-composition resistors (CCRs) were used. CCRs are composed of a mixture of pure C, as graphite, mixed with clay and some insulating ceramic component. The resistors become more conductive (and their value decreases) as the mixture’s carbon content increases.
CCRs were widely used as high-quality components in the construction of devices for high-quality audio reproduction (hi-fidelity audio, HiFi) in the 1960s. Although this technology has now been replaced by metal film resistors, their production is being continued for the construction of high-quality HiFI devices.
Given their manageability based on the relatively large diameter of their carbon disc (1.25 mm), CCRs were used and modified using different platinization protocols in order to define the most effective one in terms of HP monitoring.
In recent years, the use of disposable pencil lead (PL) graphite-based electrodes has been the subject of several reports in the literature [47,48,49,50]. It is widely known that the most stable form of carbon is graphite, which is the primary component of PL and is found in several natural materials. All carbons in graphite and GC are sp2 hybridized, which determines their high conductivity and facilitates analyte adsorption [51,52].
Graphite and clay are the main components of PLs, even though other components can be present [53]. It has been reported that the relationship between graphite and clay defines different types of leads [51]. Actually, while HB type pencil leads have an equal amount of clay and graphite, B type leads are softer and contain more graphite, while H type leads are harder and include more clay [53,54]. According to Kariuki [47], the addition of clay determines a significant part of the chemical (such as ion exchange) and structural (such as degree of disorder and surface shape) characteristics of pencil graphite leads. In the present paper, HB pencil leads of different diameters were used and modified, but, as proof of concept, another carbon-based material was used.

2. Materials and Methods

2.1. Chemicals and Reagents

All the chemicals as well as the Glucose Oxidase enzyme (GOx, 895 U/mL in PBS) were purchased from Sigma-Aldrich (Milan, Italy). All the in vitro experiments were performed in phosphate-buffered saline (PBS, 50 mM, pH = 7.4) composed (in g/L) as follows: NaCl 8.90, NaH2PO4 6.89 and NaOH 1.76. Hexachloroplatinic acid (H2PtCl6 6H2O, Hexachloroplatinic acid hexahydrate, HA, 10 mM and 20 mM) was dissolved in sulfuric acid (H2SO4, 0.1 M). The stock solution of ascorbic acid (AA, 100 mM) was obtained by solubilizing the powder in Chloridic acid (HCl) 0.01 N, while the hydrogen peroxide one (HP, 100 μM) was prepared by diluting the 30% stock solutions in double-distilled water. Polyorthophenyenediamine (PPD) polymer was obtained by dissolving o-Phenylenediamine (OPD, 300 mM) monomer powder in deoxygenated PBS. Stock glucose solution (GLU, 1 M) was obtained by solubilizing the powder in ultrapure water and leaving it for 24 h at room temperature to allow the equilibration of anomers and then keeping it at 4 °C. A polyethyleneimine (PEI) solution of 1% w/v was prepared by dilution of the stock solution (50% w/v) in bidistilled water. Ultrapure nitrogen (N2, >99.9%) was bought from Sapio s.r.l Special Gases Division (Caponago, Italy). Polyurethane (PU, 0.1%) was obtained by dissolving the pearls in pure tetrahydrofurane (THF).

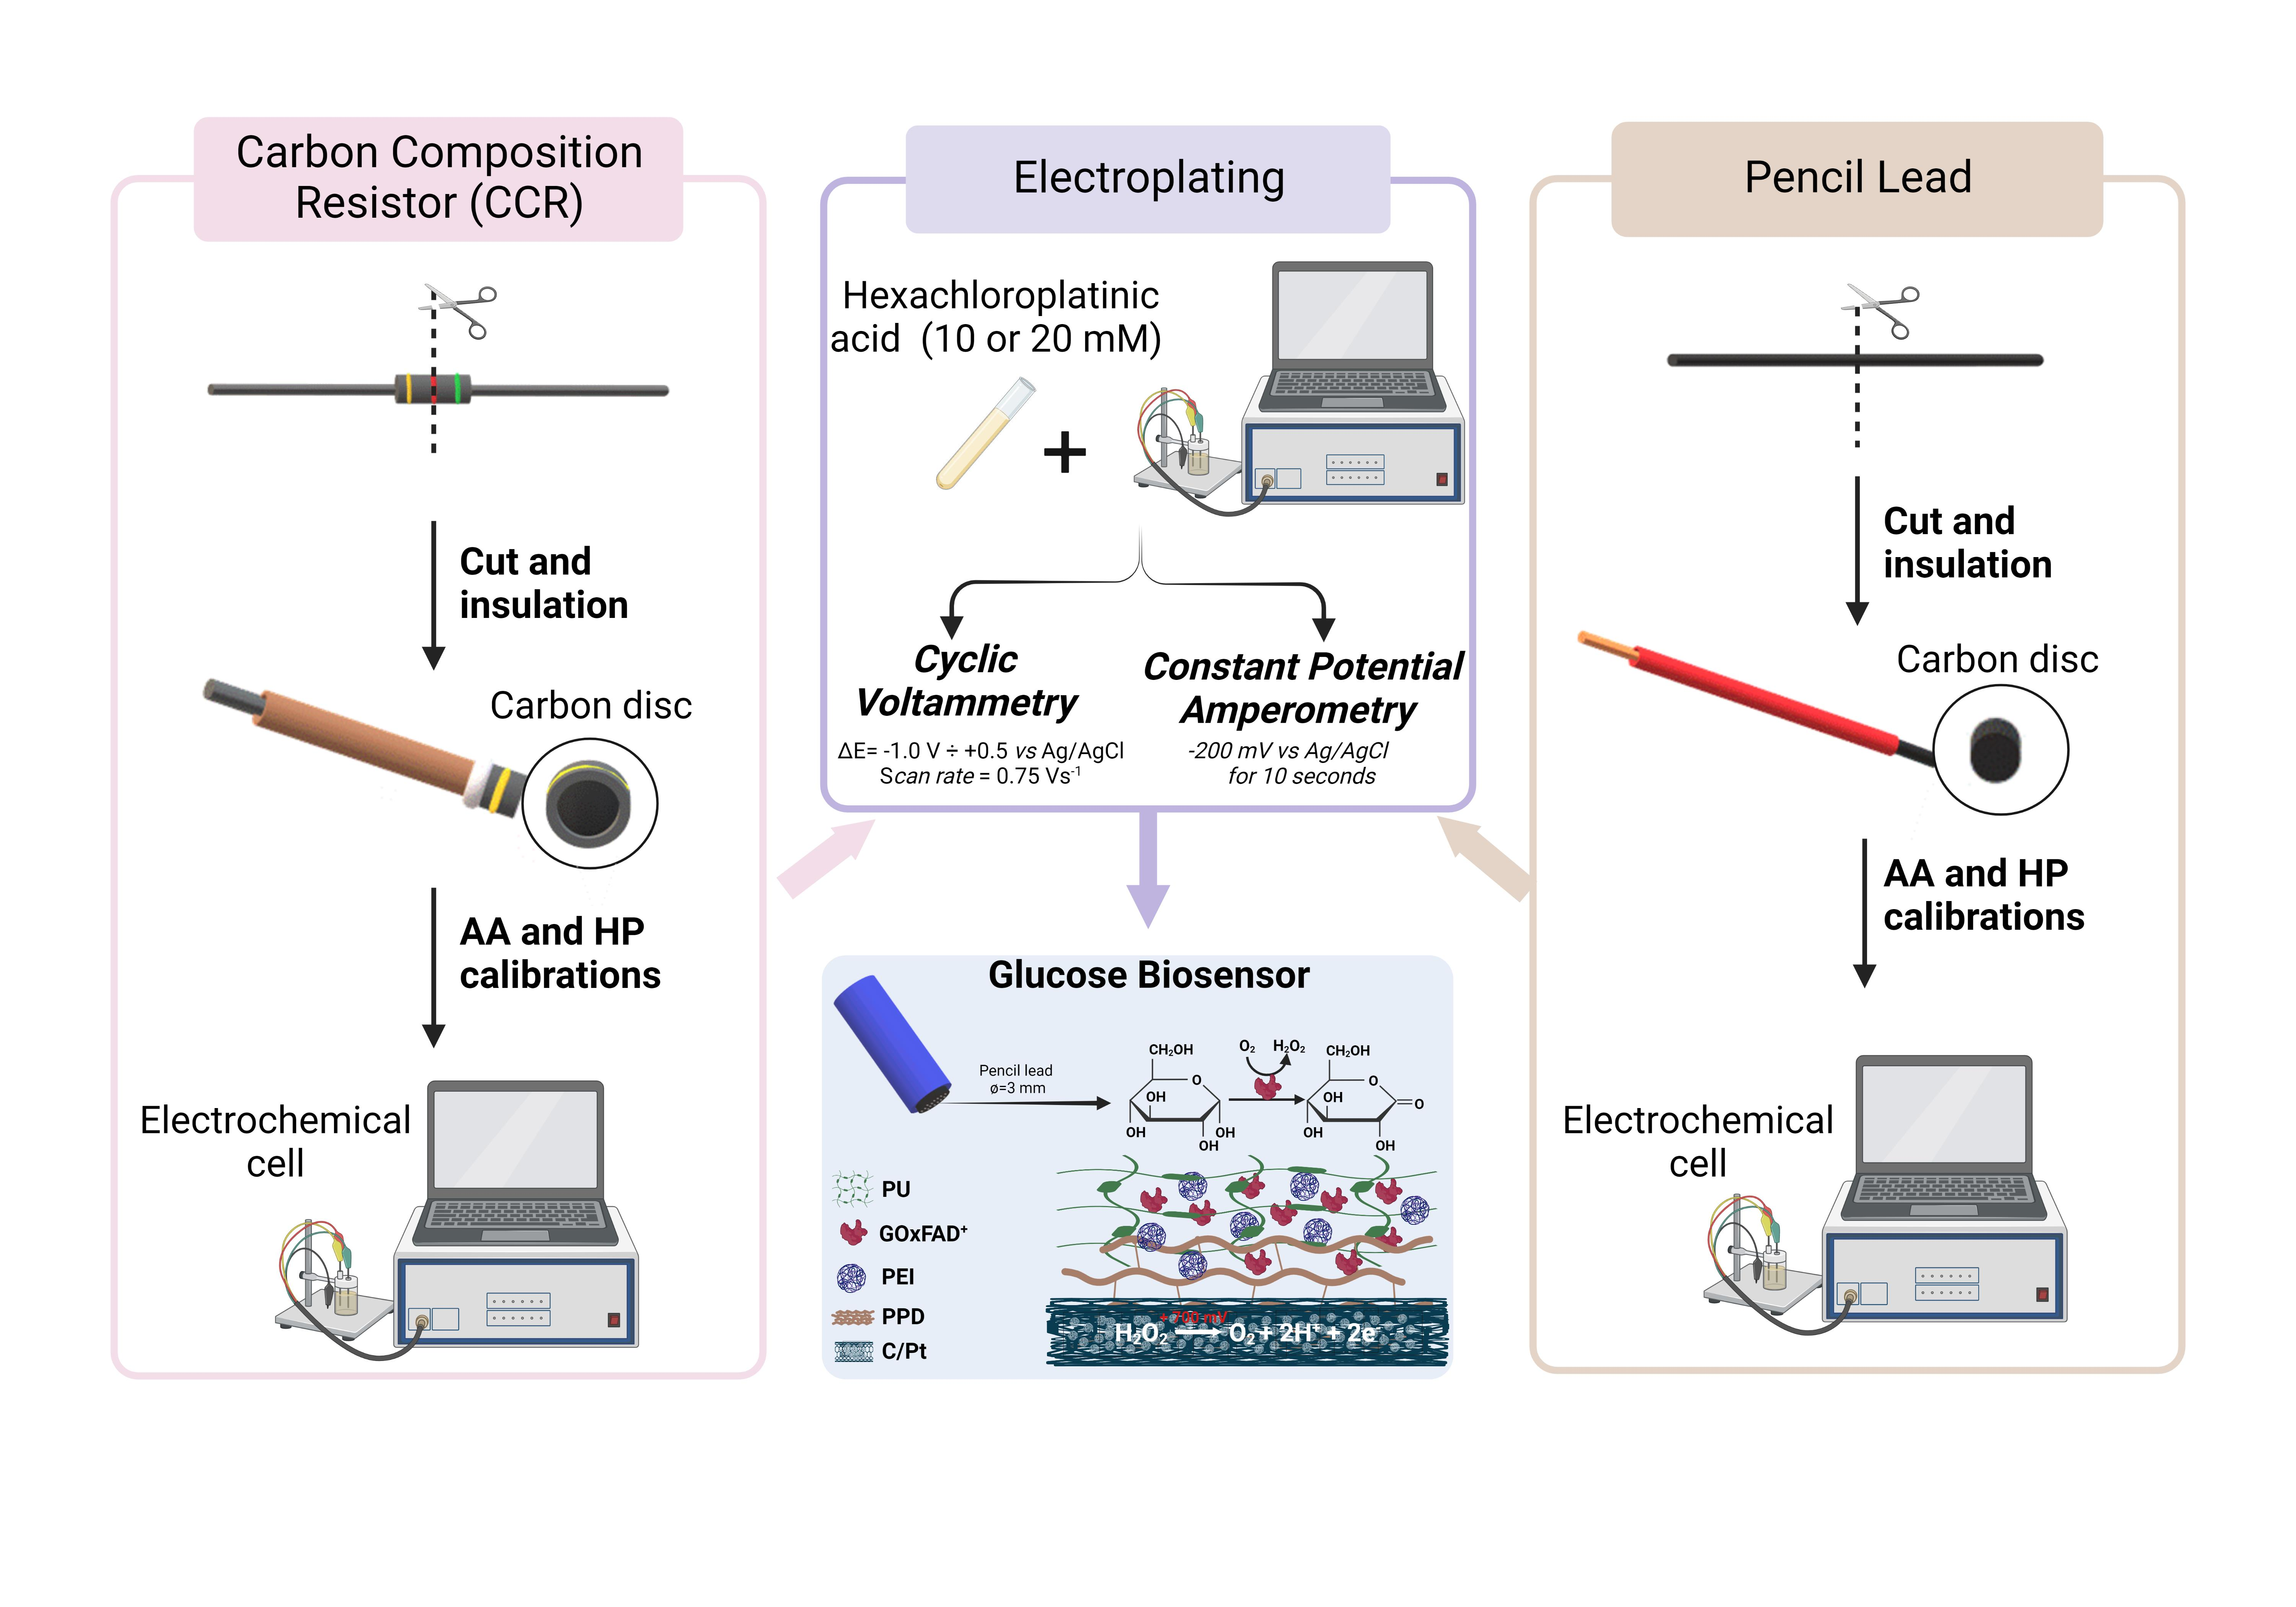
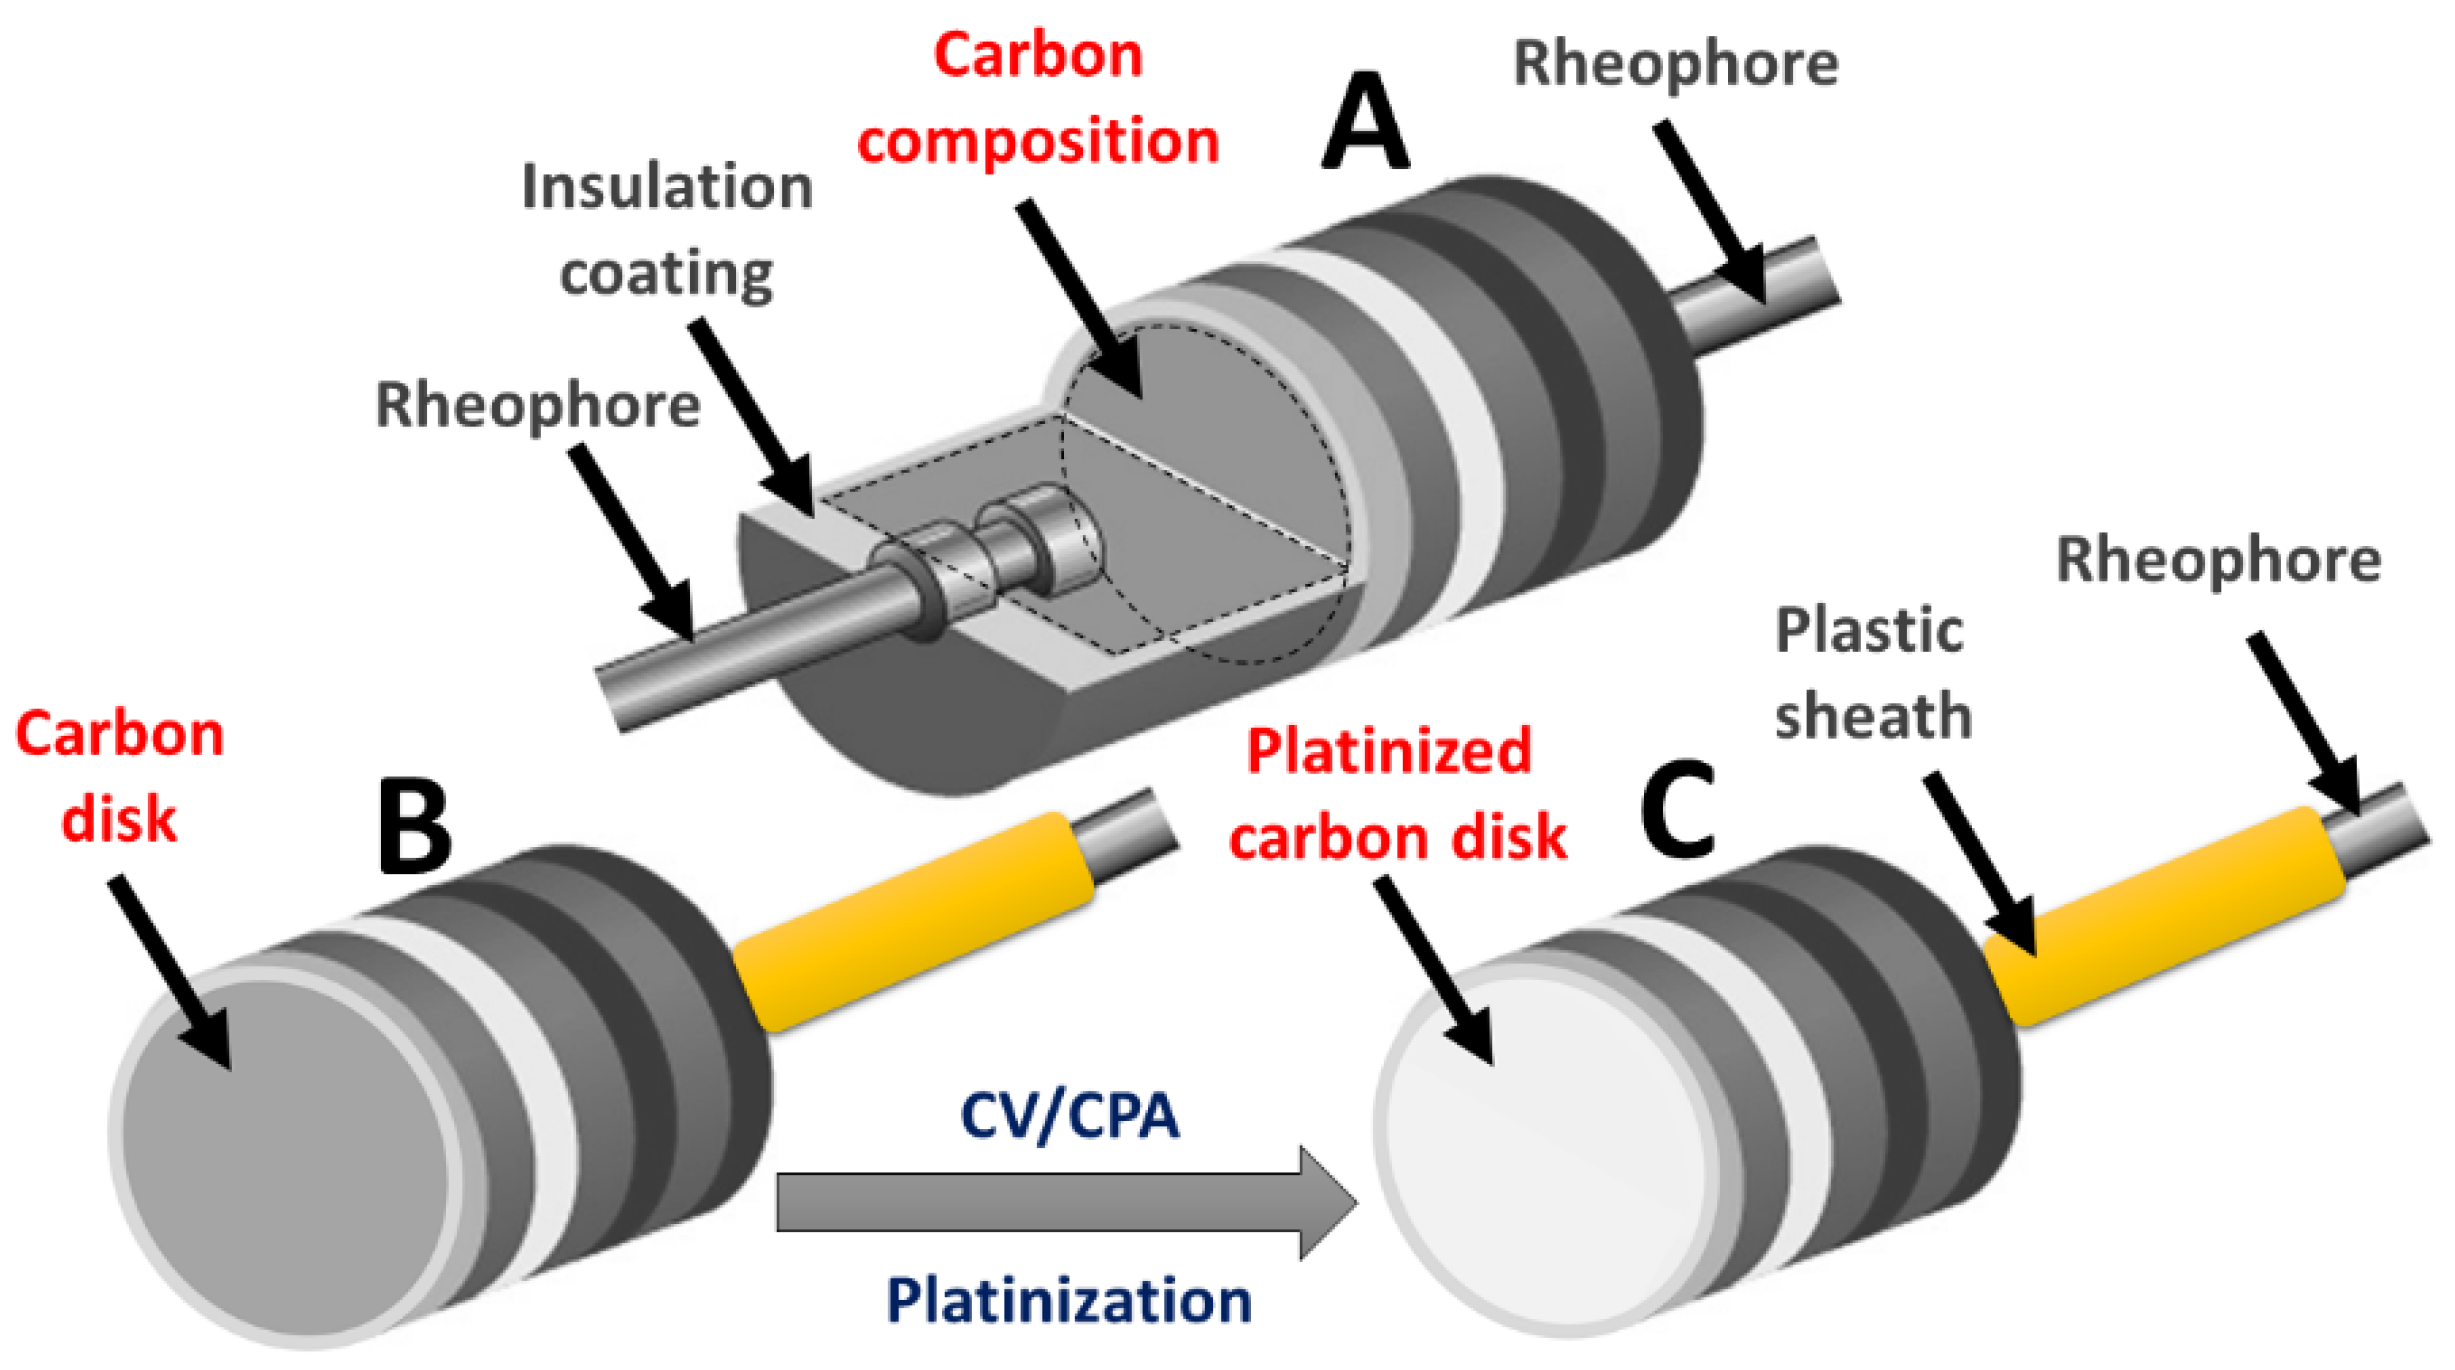
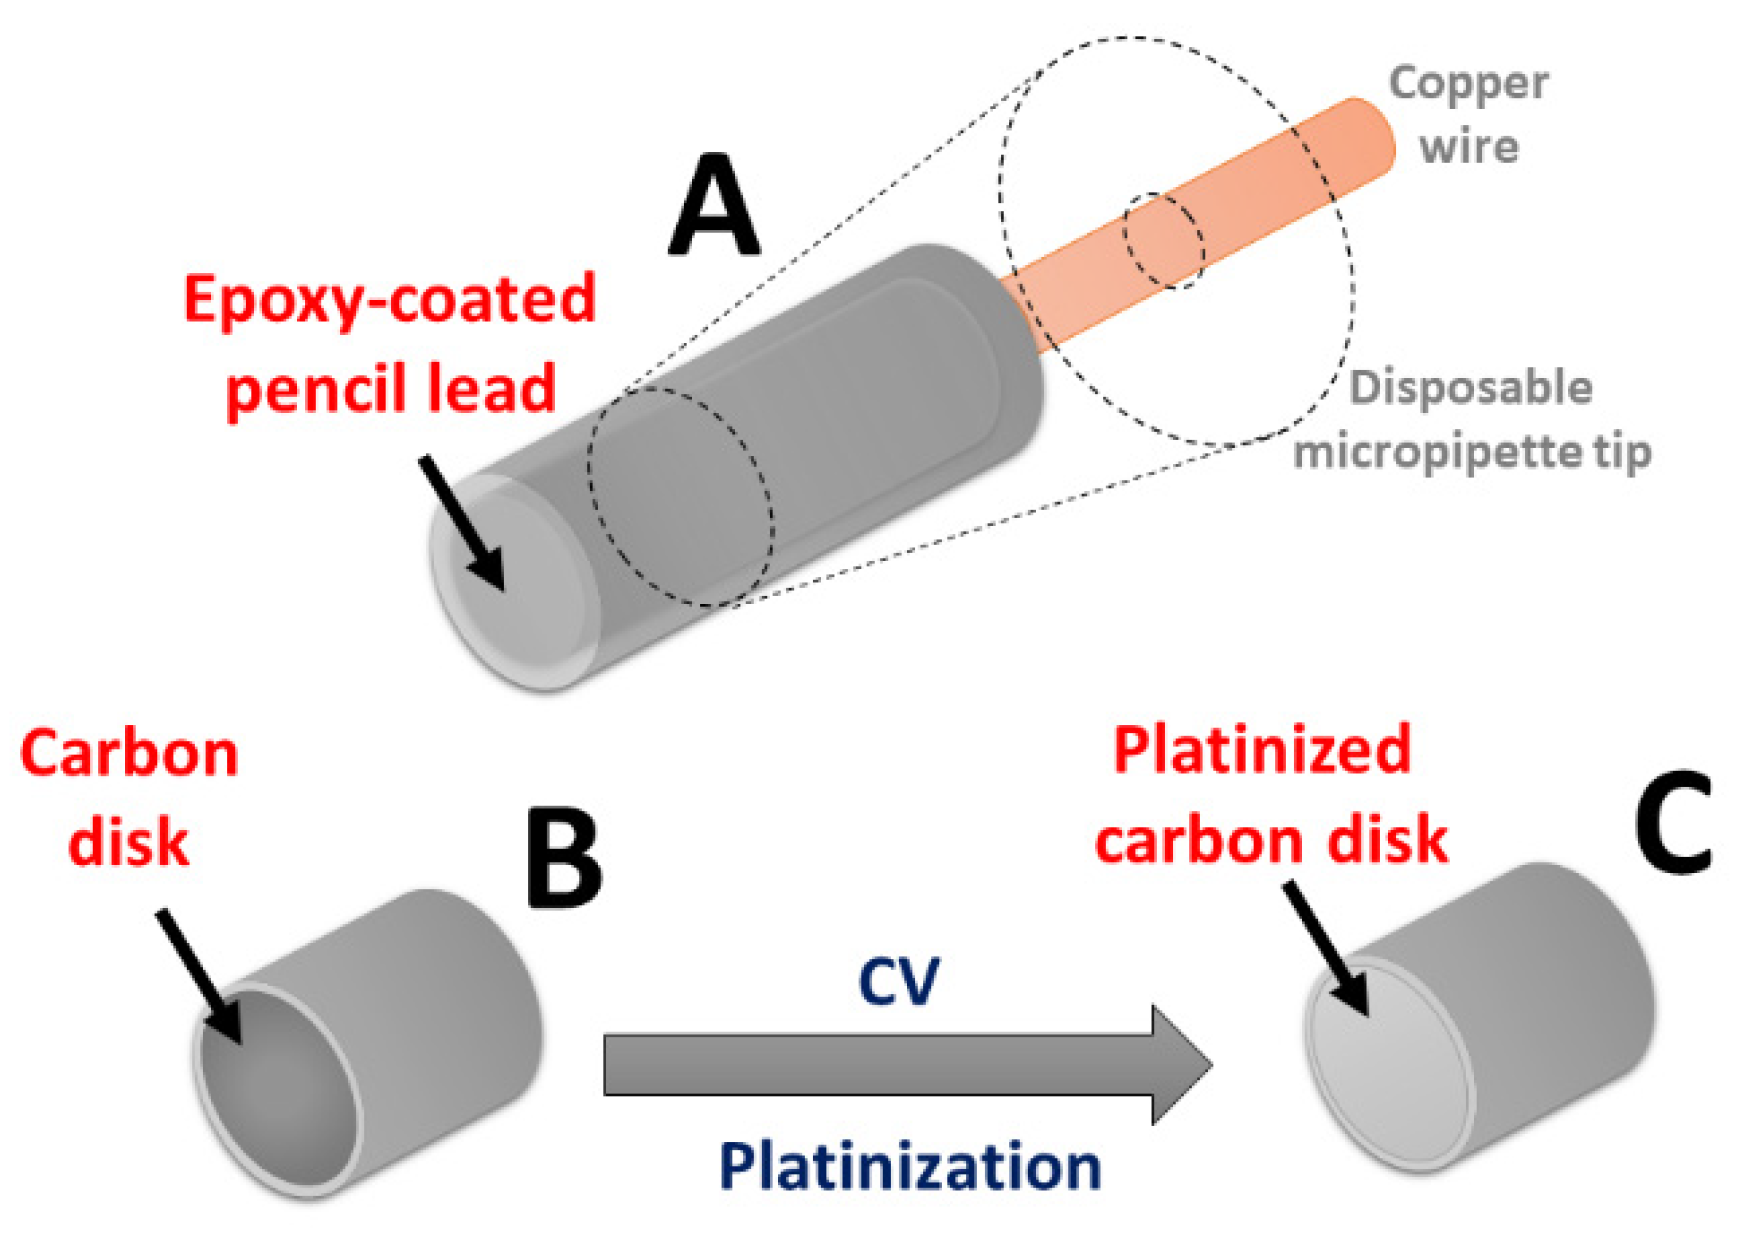
2.2. Preparation of CCR and Pencil Leads

Two different carbon-based microsensors, as displayed in Figure S1 of the Supplementary Material, made of different carbon materials were developed and characterized: carbon-composition resistors (CCR) and pencil leads (PL). The CCRs and PLs were made of mixtures of pure graphite.
The CCRs-based sensors (Ohmite, Warrenville, IL, USA) (Figure 1) were obtained using fixed-value resistors with a specific electrical resistance. Resistors are made up of a cylinder obtained by a mixture of graphite, clay and an insulating, usually ceramic, material with two metal terminals at the ends called rheophores. In the present project, CCRs with intermediate resistance values (1 KΩ) were used and were cut in half by means of an electrical drill in order to obtain two identical carbon disc sensors with the same diameter. The rheophores were then insulated with a portion of a plastic sheath, leaving a few millimeters free to allow current continuity between the potentiostat and the carbon disc. The junction between sheath and ceramic disc was insulated with epoxy glue (Pattex© 2022—Henkel Italia Srl, Milan, Italy). After construction, the microsensors were left to dry for 24 h at RT.
For the second design (Figure 2), commercial HB pencil leads (STAEDTLER®, Nuremberg, Germany) of different diameters (0.3, 0.5, 2.0 mm Ø) were used. While 0.5 and 2.0 mm diameter pencil leads were cut to 15 mm in length, 0.3 mm diameter PLs were cut to 7 mm instead. In all cases, a copper wire was wrapped around one edge, this being needed for guaranteeing electrical continuity with the potentiostat. Disposable micropipette tips (2 µL, 200 µL and 1000 µL, for pencil leads with diameters of 0.3, 0.5 and 2.0 mm respectively) were filled with epoxy glue and the pencil leads were then inserted inside. The microsensors were then left to dry for 24 h. The day after, the microsensors’ surfaces were gently polished using extra-fine emery paper (P600, 25.8 µm) and then using cardboard in order to clean the glue off the carbon disc and expose the active surface.

2.3. CCR and PL Platinization and Characterization Protocols

The CCRs were initially used in order to define the best platinization protocol.
Before platinization process, the CCRs were initially cleaned on a paper sheet and then calibrated by exposing them to increasing concentrations of HP and AA, in ranges between 0 and 150 µM and 0 and 1000 µM, respectively, in order to assess the monitoring of these compounds on bare carbon.
Then, the CCRs were subjected to different platinization protocols exploiting cyclic voltammetry (CV) and constant potential amperometry (CPA) techniques (Figure S2). In both cases, two different concentrations (10 mM and 20 mM in H2SO4 0.1 M) of HA were used. The HA solutions were used either deoxygenated, as previously described [44], obtained by bubbling pure N2 for 15 min, or untreated.
In the case of CV experiments, based on a previous publication [55], the following parameters were used: ΔE = −1.0 ÷ +0.5 V vs. Ag/AgCl with a scan rate = 0.75 Vs−1 (Figure S3).
Inspired by the paper of McKelvey, the platinization performed with CV was carried out by means of a series of 2 consecutive cycles followed by HP and AA calibrations. The full protocol required the repetition of the above-described series up to 5 times, leaving 15 min between the repetitions of the 2-cycle series, during which the solution containing HA was deoxygenated. Then, further platinization protocols were applied. Using the same abovementioned parameters, the first protocol provided the platinum deposition by means of 3 series of 2 consecutive cycles without any HP and AA calibration between the series, while the second provided the application of 6 consecutive CV cycles. In the latter two protocols, HP and AA were carried out only at the end of each platinization process (Figure S2).
The platinization protocol with CPA was conducted by applying a constant potential of −200 mV for 10 s, as previously reported [56,57,58]. After CPA platinization, the monitoring of HP and AA was performed, with the same protocol previously described.
In all protocols, HP and AA slopes derived from linear regression of calibration data were evaluated.
The most efficient protocol was identified by calculating the selectivity index through the ratio between the slope of HP and AA measured on the same sensor under the same conditions, as follows:
Selectivity index (SI) = slope HP/slope AA
The results for all protocols used are reported in Figure S3 of the Supplementary Material.
For PLs of all diameters, the protocol that gave the best results in terms of SI was applied. This protocol was based on the calibrations of HP and AA on bare carbon, followed by the platinization of the leads through 3 series of 2 consecutive cycles (without calibrations between the series) in CV, using a 10 mM solution of HA deoxygenated with N2 for 15 min (Figure S3). Given the obtained results, in particular based on the SI calculated (data not shown), but also based on the dimension of the sensor, the pencil leads with a diameter of 0.3 mm were used for the construction of the glucose biosensors as described in paragraph 2.5.

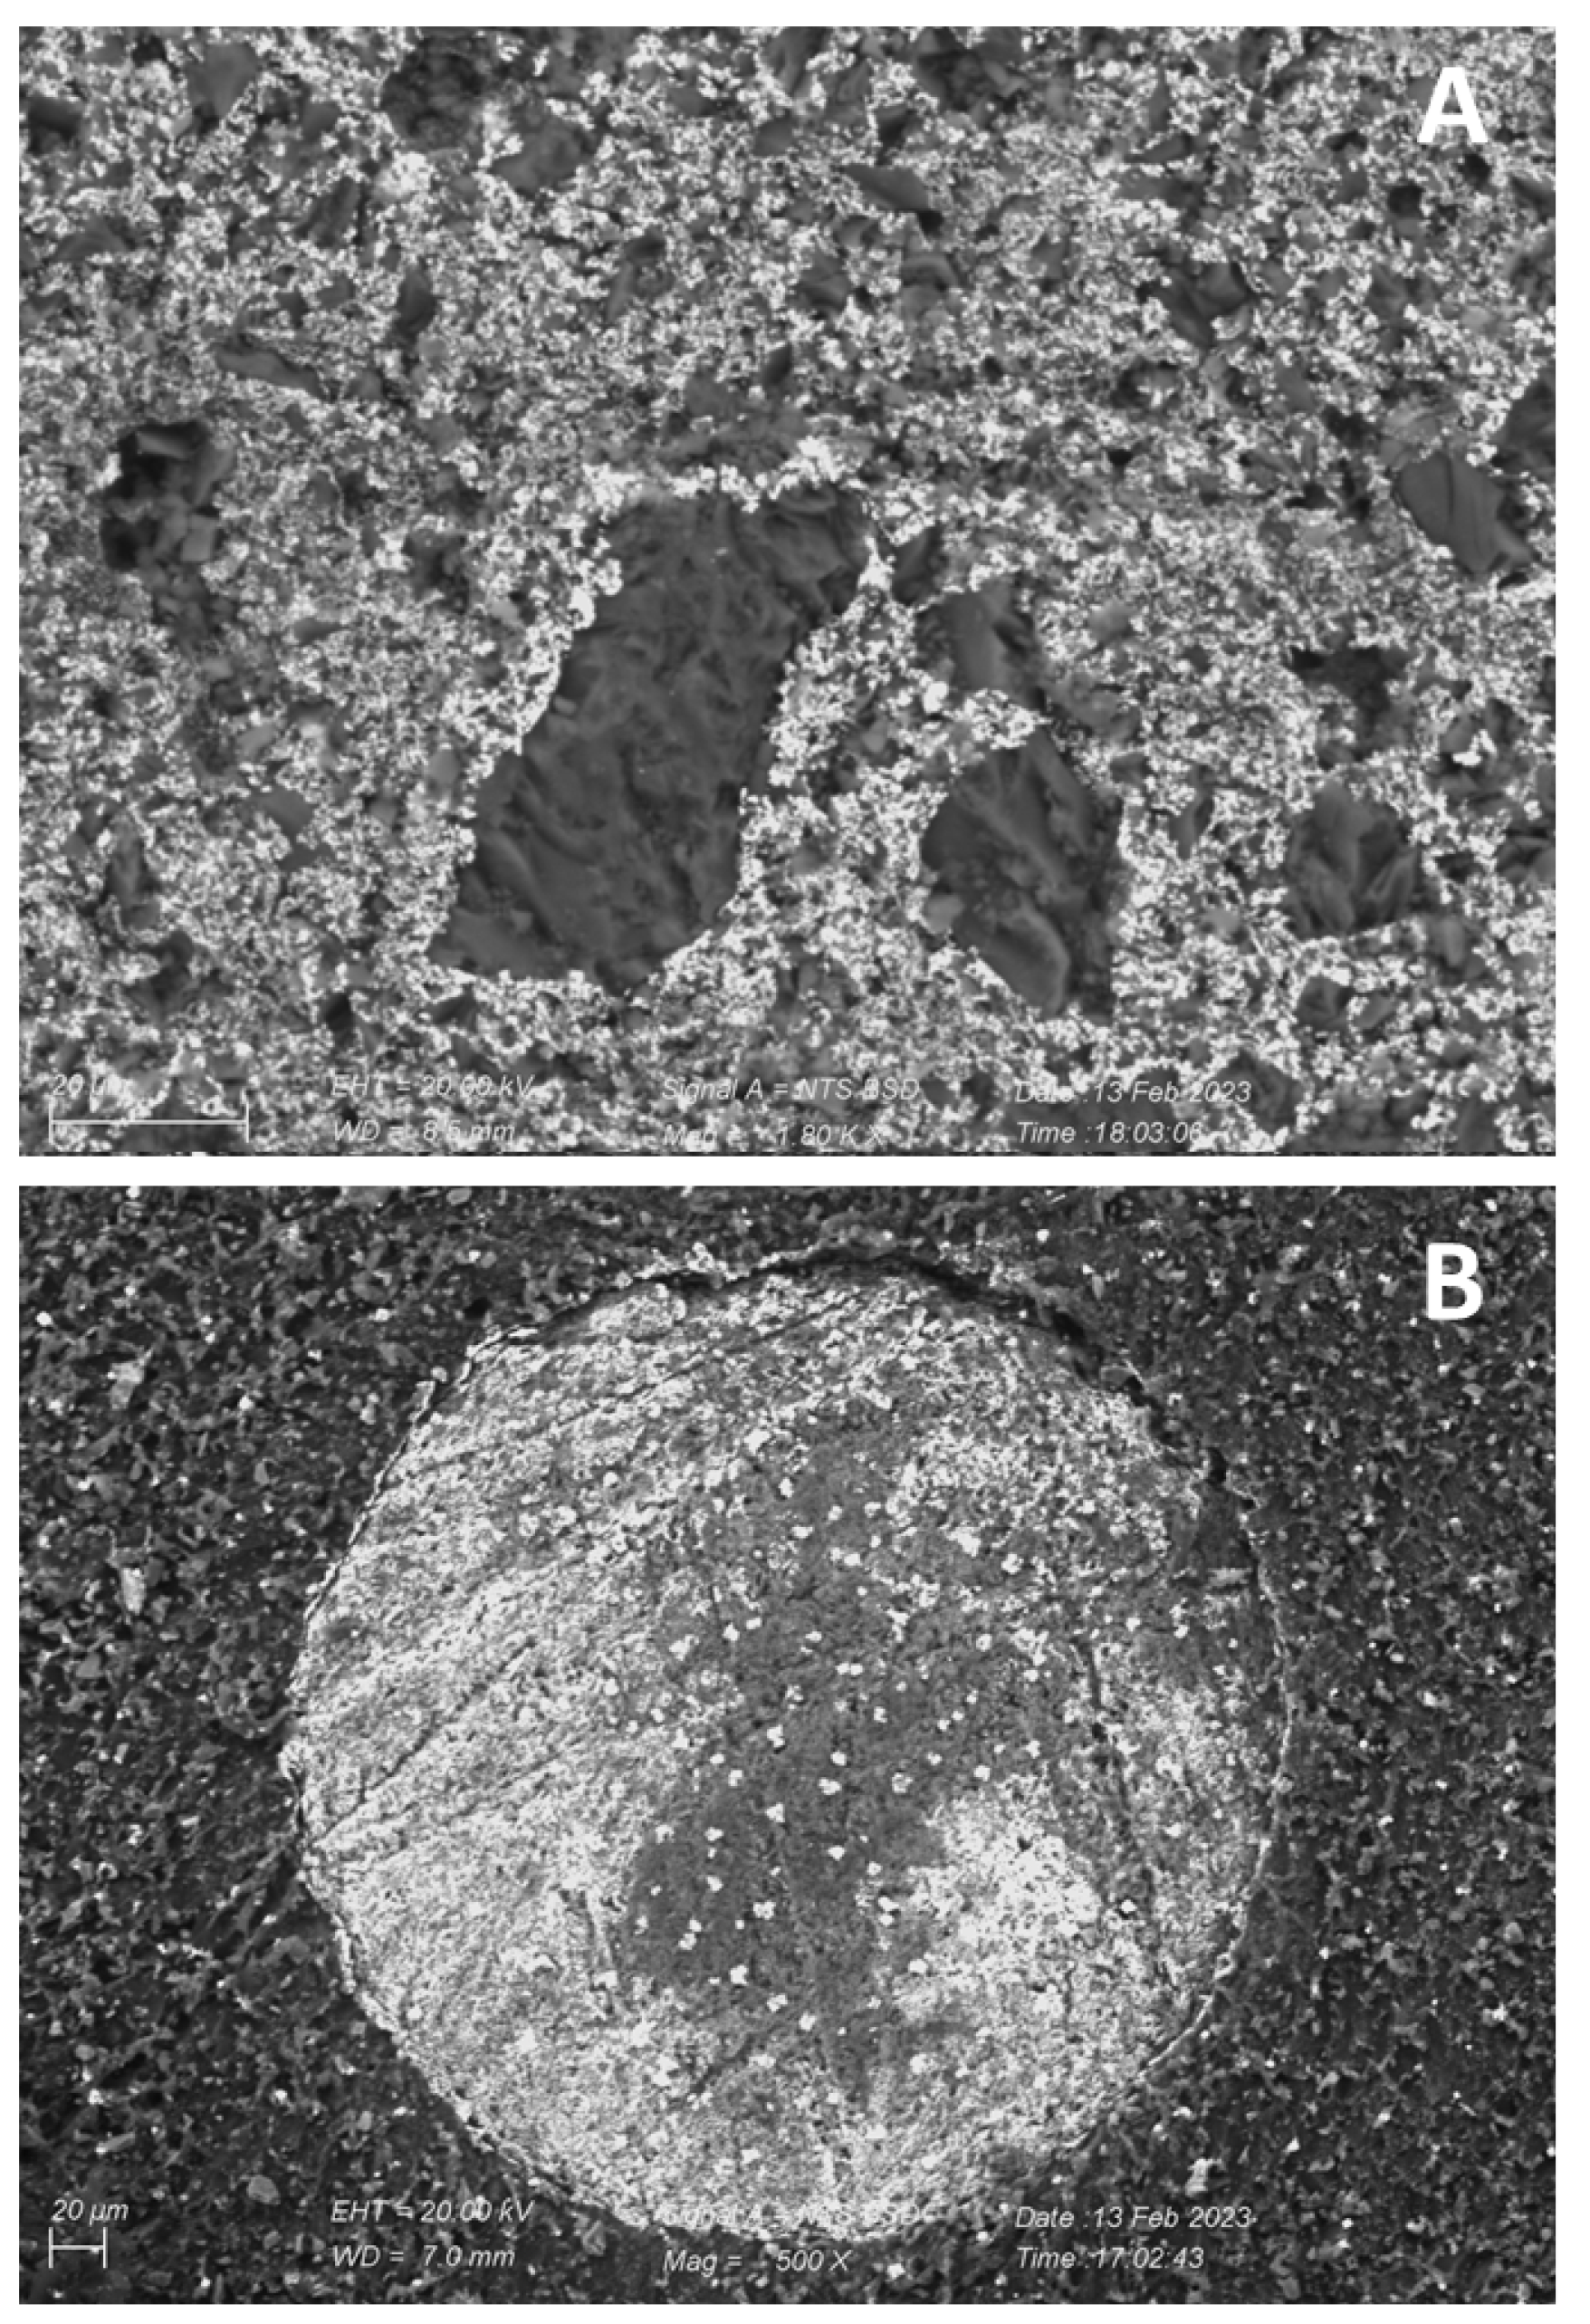
2.4. Scanning Electron Microscopy (SEM) Study of the Sensors

For SEM/EDX analysis, the samples were mounted on carbon stubs and scanned without any pretreatment by means of a Zeiss EVO LS10 Environmental Scanning Electron Microscope, in low-vacuum mode (pressure chamber 10 Pa) coupled with a back-scattered electron detector (BSD). The microanalysis was carried out using the energy-dispersive spectrometer (EDS) Inca X-Act (Oxford Instruments, Abingdon, UK).

2.5. Biosensor Construction and Characterization

Initially, the platinization of the carbon disc was carried out through the protocol indicated in the Section 2.3. Then, at Day 0, 0.3 Ø PL once platinized (Cplat) was suitably modified in order to obtain a biosensor for glucose as previously published [59,60,61]. In brief, after platinization, the leads were immersed in a solution consisting of OPD 300 mM in 12 mL of deoxygenated PBS while a positive potential of +0.7 V vs. Ag/AgCl reference was applied for 15 min in order to allow the deposition of PPD polymer. Then, the Cplat/PPD leads were placed deep in a PEI (1%) solution and permitted to dry for 5 min before dipping the leads in a GOx solution. These processes were repeated 4 more times. In the end, one layer of 0.1% PU was layered by means of a single dip.
At the end, the following design was obtained:
Cplat/PPD/[PEI(1%) − GOx]5/PU(0.1%)
The biosensors were then rinsed in pure water and put in 20 mL of fresh PBS, polarized with a potential of +0.7 V vs. Ag/AgCl, and left for overnight baseline stabilization.
On Day 1, the biosensors were put in fresh PBS and a calibration of AA was carried out in a range between 0 and 1000 µM in order to verify shielding against electroactive interfering compounds, as previously described [62,63].
Afterwards, the biosensors were exposed to increasing concentrations of glucose, ranging between 0 and 140 mM, in order to extrapolate the kinetics and analytical parameters.
As previously described [25,64,65], after calibrations, the biosensors were rinsed in pure water and kept at −80 °C. At Day 2, the biosensors were removed from the freezer and left for 30 min at RT, then subjected to the same calibration scheme performed on Day 1.

2.6. Instrumentation and Software

For all the experiments, a classical three-electrode cell was used, consisting of a beaker containing 20 mL of fresh PBS, four working electrodes represented by microsensors or biosensors, an Ag/AgCl (NaCl 3 M) reference electrode (Bioanalytical Systems, Inc., West Lafayette, IN, USA), and a high-surface stainless needle serving as the auxiliary. All electrochemical tests were conducted using a four-channel potentiostat (eDAQ Quadstat, e-Corder 410, eDAQ Europe, Warsaw, Poland) and Chart software (v 5.5, eDAQ Europe, Warsaw, Poland).

2.7. Statistical Analysis

Sensitivity to HP and AA are expressed as slope, obtained by the linear regression of the row data and given as nA/µM ± SEM (standard error of the mean). Data were compared for statistical difference (p values) by means of ANOVA.
The electrochemical data from the biosensor calibrations were VMAX and KM, expressed as nA and µM, respectively, and LRS was given as nA/µM.
All data were statistically estimated by using Graph-Pad Prism 9.3 software (San Diego, CA, USA).

3. Results and Discussion

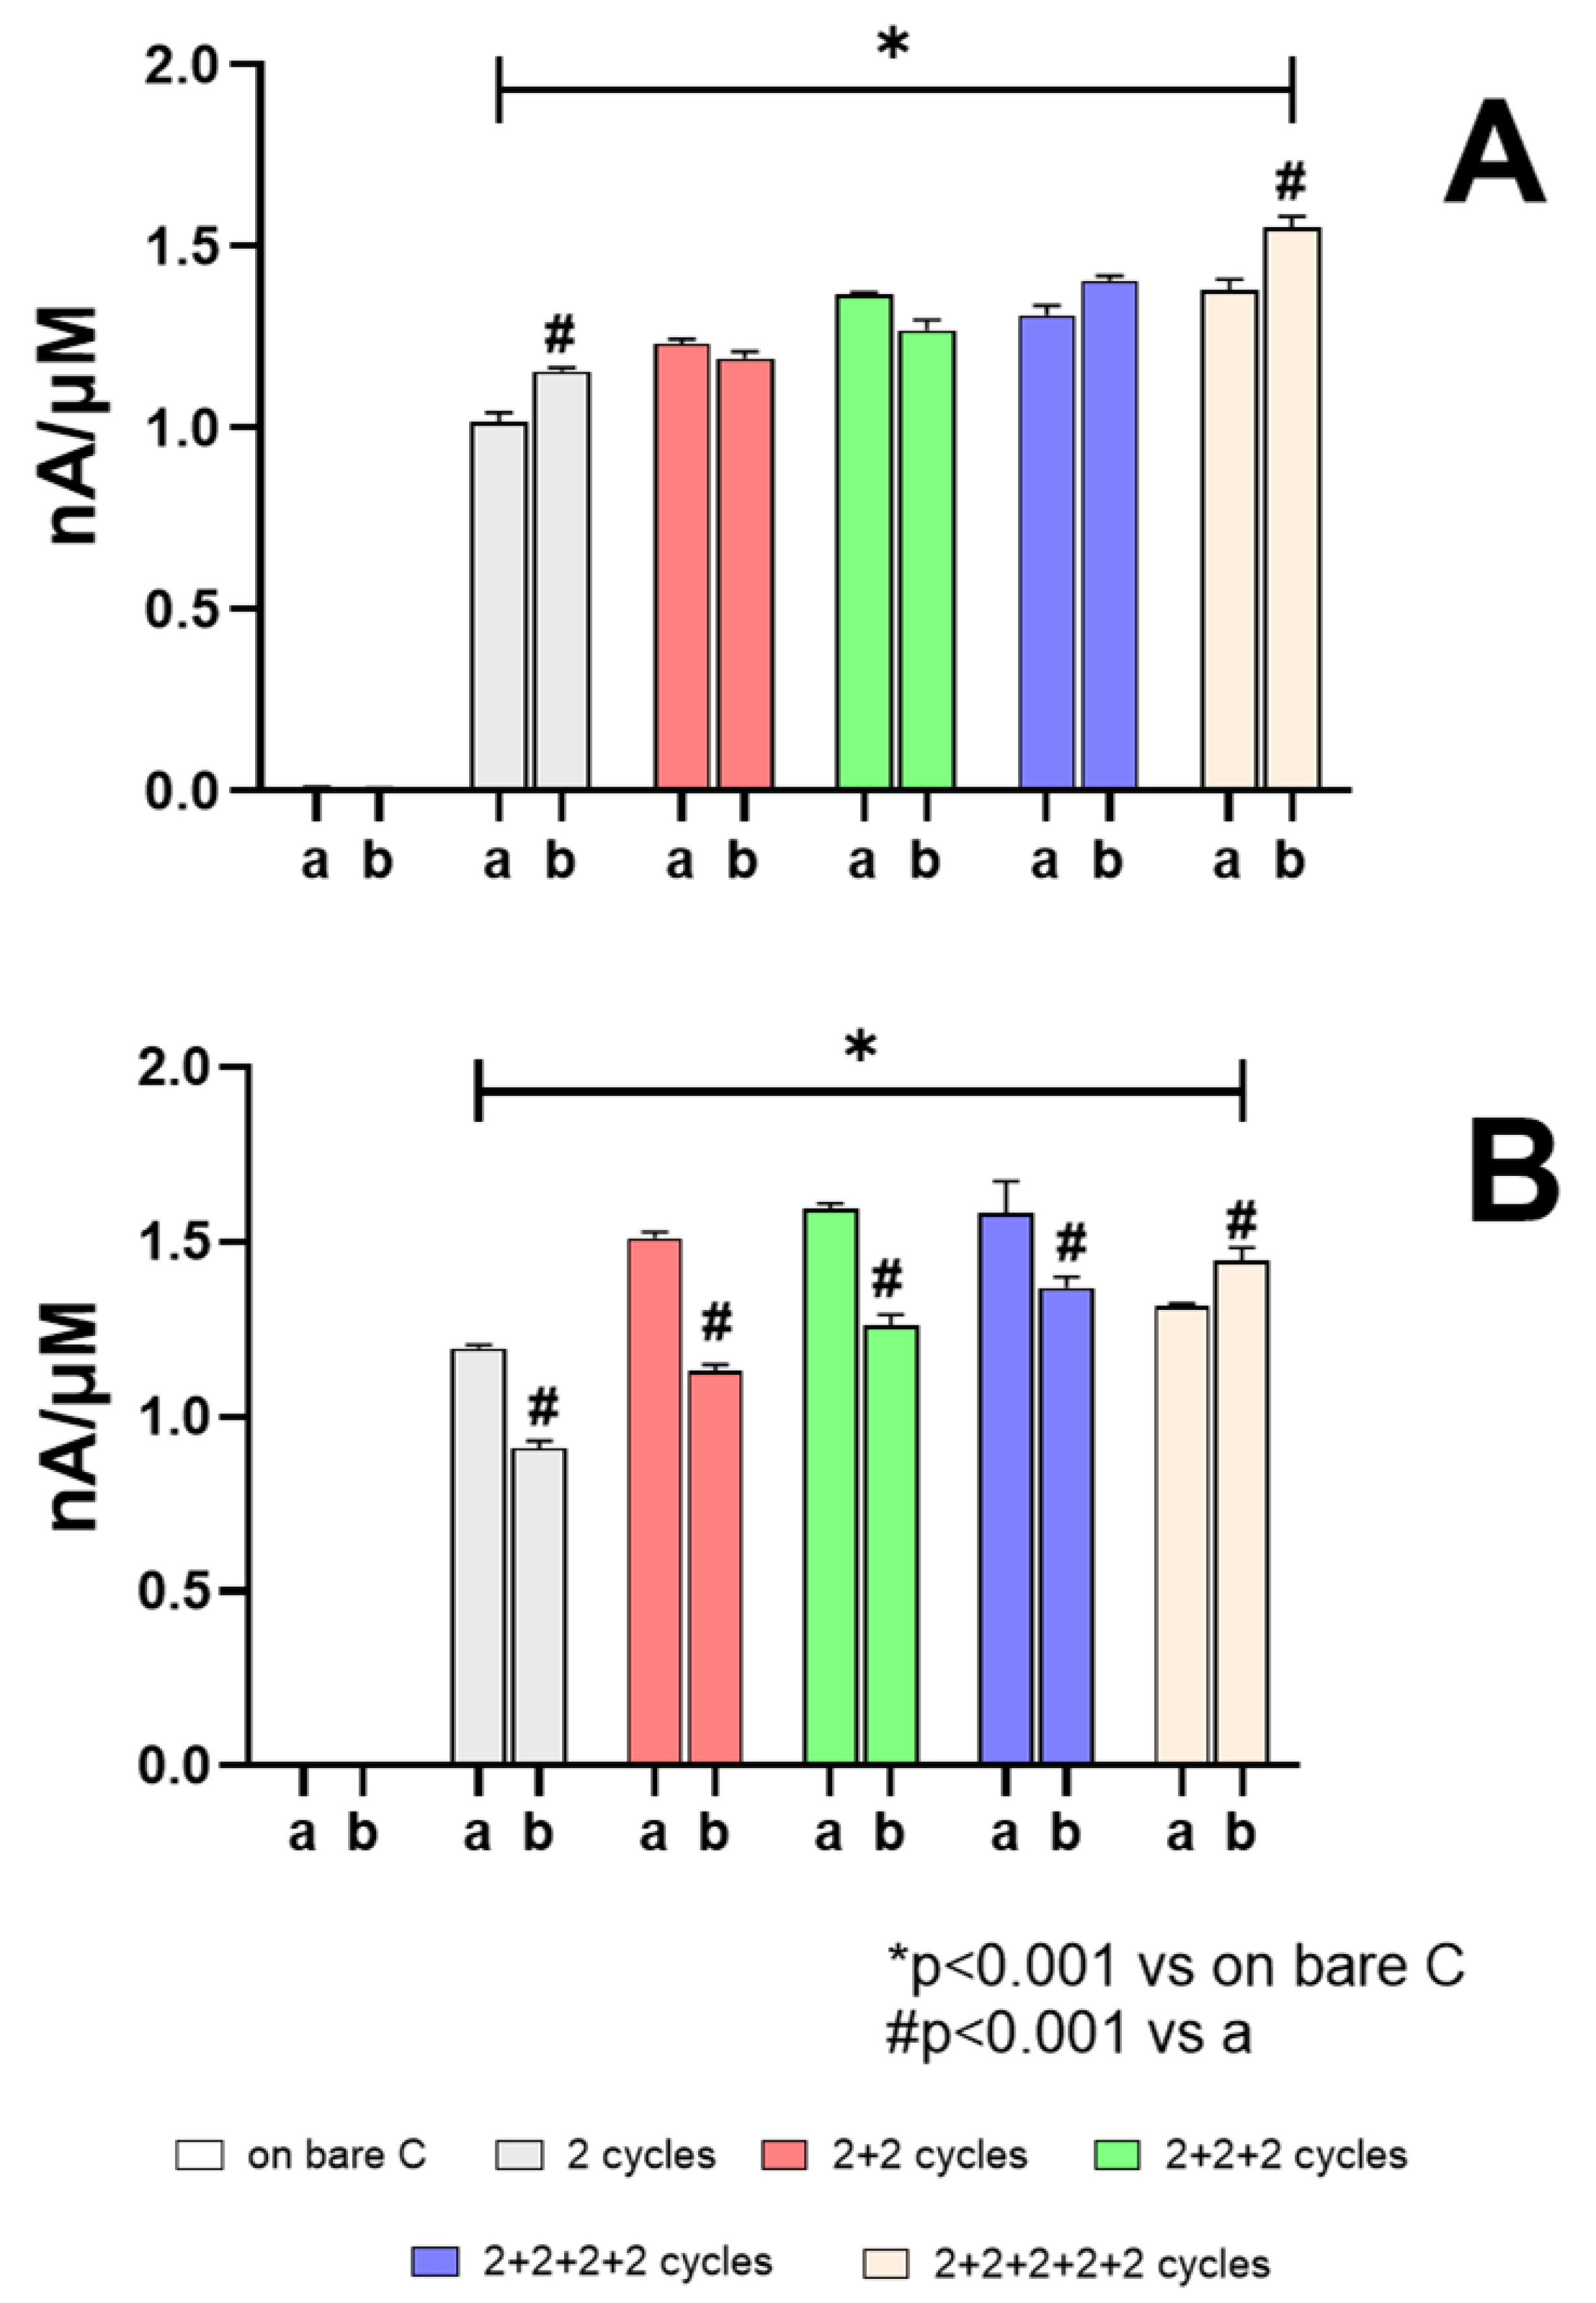
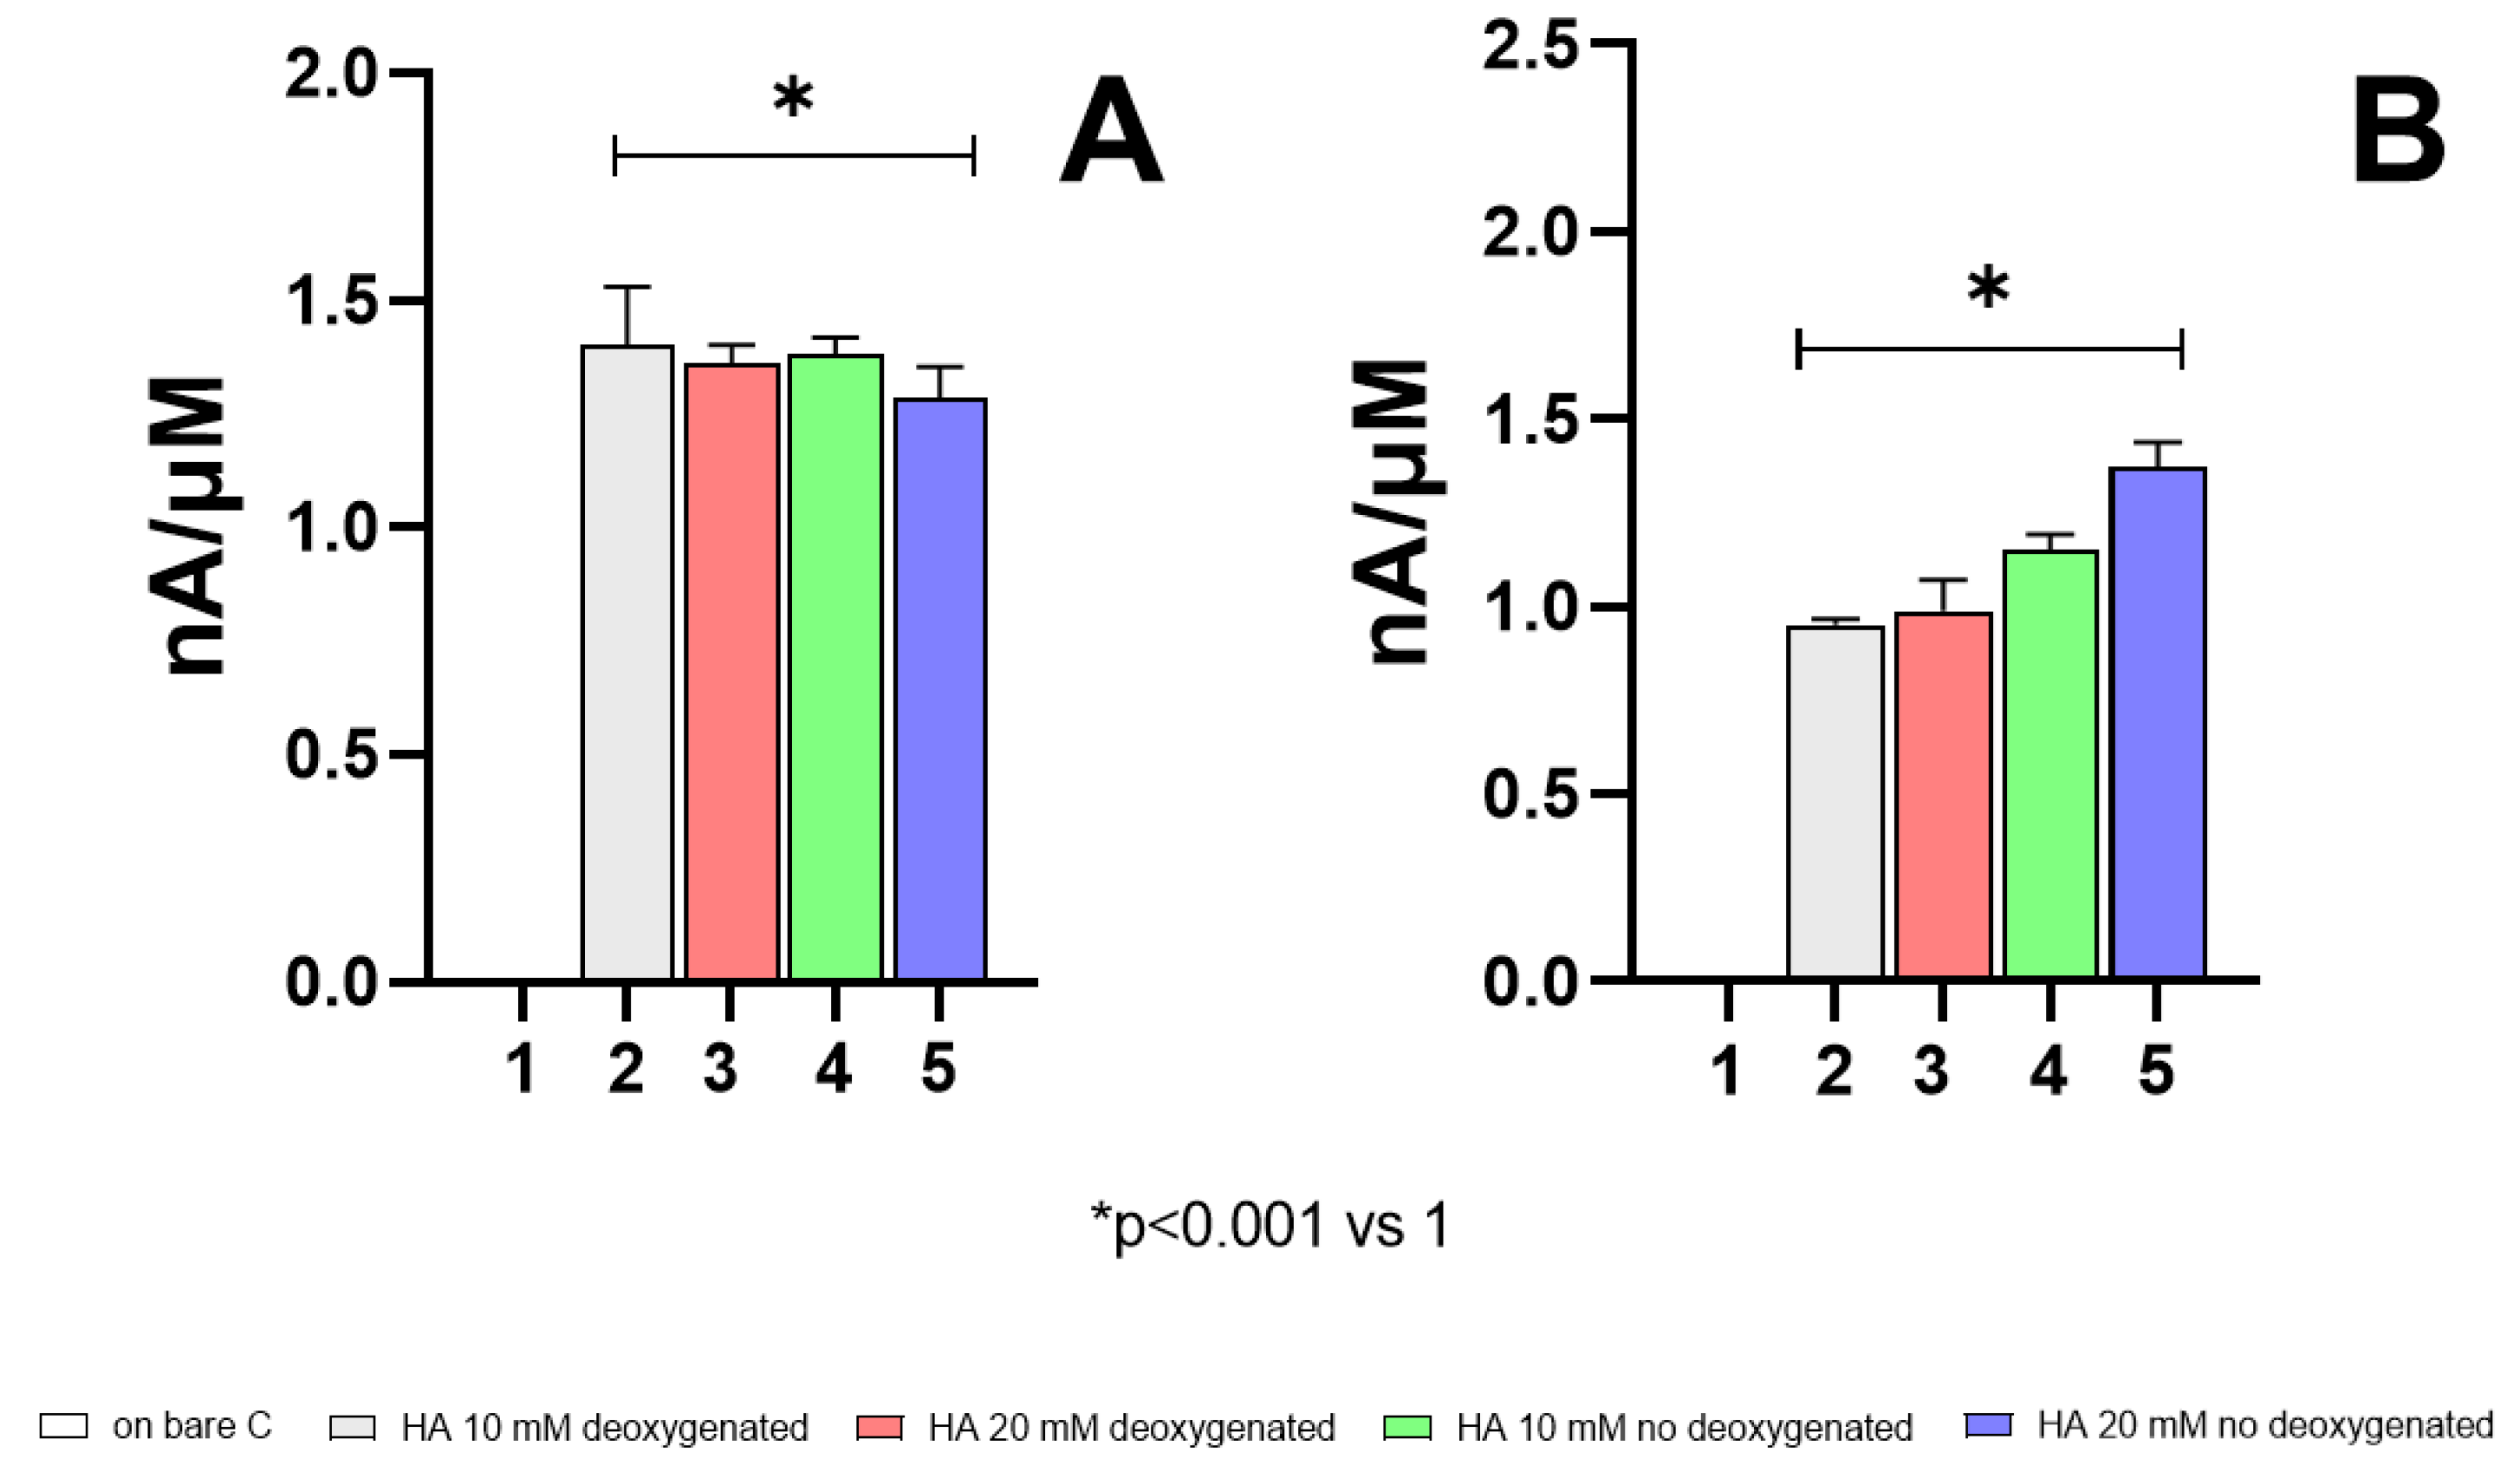
3.1. Role of HA Concentration and N2-Deoxygenation Protocol

As shown in Figure 3, the results from HP calibration are shown. In the graph are displayed the results obtained from 10 mM (Panel A) and 20 mM HA (Panel B) solutions, deoxygenated (a) and not deoxygenated (b) with N2. As highlighted in both panels, after each series of two cycles, in both conditions, significantly different (p < 0.001) HP slopes, when compared with bare C ones, were obtained.
As displayed in Panel A, HA 10 mM solution determined an increasing trend of HP sensitivity as the number of cycles increased, starting from 1.014 ± 0.028 nA/µM and reaching 1.381 ± 0.028 nA/µM for the deoxygenated solution (a), while starting from 1.155 ± 0.011 nA/µM and reaching 1.552 ± 0.030 nA/µM for the not-deoxygenated solution (b).
Moreover, no-deoxygenation protocol gave statistically different results compared to the deoxygenating protocol in only 2-cycles and 2 + 2 + 2 + 2 + 2 cycles experiments (p < 0.001 vs. a).
As demonstrated in Panel B, showing 20 mM solution results, a similar trend to Panel A was obtained, in particular for the not-deoxygenated solution (b), where HP slopes varied from 0.911 ± 0.019 nA/µM for 2 cycles up to 1.448 ± 0.036 nA/µM for 2 + 2 + 2 + 2 + 2 cycles. About the deoxygenated solution (a), a decrease was highlighted for 2 + 2 + 2 + 2 + 2 cycles. More, up to the 2 + 2 + 2 + 2 cycles protocol, HP slopes obtained from the deoxygenated solution were statistically lower than the ones obtained from the not-deoxygenated solution (p < 0.001 vs. a).
In Figure S5, AA calibration results for the same experiments are displayed. In Panel A, the platinization obtained from HA 10 mM caused an increasing AA sensitivity as the number of cycles increased, both in deoxygenated and not-deoxygenated solution, with statistical differences (p < 0.001) if compared with the respective bare C data, reaching the maximum values in 2 + 2 + 2 + 2 + 2 cycles equal to 0.683 ± 0.021 nA/µM and 0.858 ± 0.012 nA/µM, respectively.
In Panel B, AA data from platinization using 20 mM solution are shown. The not-oxygenated solution (b) caused a general increase in the AA slopes, which were significantly higher (p < 0.001) if compared with the respective ones on bare C value, up to the 2 + 2 + 2 cycles protocol, recording a maximum value of 0.445 ± 0.004 nA/µM. On the contrary, the deoxygenated solution (a) produced a global significant decrease in AA slopes when compared with the respective ones on bare value, settling around an average value of about 0.445 nA/µM.
As previously demonstrated [33,66], carbon-based transducers were less efficient in detecting HP. More, carbon alone cannot meet the catalytic requirements, and thus platinum layering plays an important role in ensuring the electrocatalytic activity of the carbonaceous support [42]. Actually, in our experiments this aspect was further stressed, since HP currents monitored on the carbonaceous supports were not appreciable. Moreover, the electrodeposition of platinum on the carbon surface significantly improved the catalytic monitoring of HP (Figure 3). In addition, it is clear that the sensitivity of the electrodes towards HP increased as the platinum deposition processes increased (Figure 3). The use of such transducers as a basis for the construction of amperometric biosensors also requires research concerning the electroactive interfering species possibly present in the matrix. In the case of neuroscience applications, these interferences are mainly generated by ascorbic acid [67,68,69,70]. Regarding AA detection, at low concentrations of HA, there was an increase in monitoring as the deposition of Pt increased. On the other hand, the use of a non-deoxygenated solution resulted in more efficient monitoring of AA, as can be seen from the data reported in Figure S5. Moreover, at high concentration of HA, the presence of oxygen caused a contrary trend compared to low concentrations; in fact, a decrease in sensitivity towards AA was monitored.
CCRs were not chosen for implantable biosensor construction not only for their quite large dimensions, which are not compatible with animal models, but also because the PPD polymer layering did not efficiently occur (data not shown), making the biosensor unshielded against any electroactive interfering species present in the matrix.
Additionally, from our experiments, it was not possible to deduce a unique effect related to the deoxygenation or otherwise of the solution containing HA, so the role of oxygen needs to be further investigated.

3.2. Cyclic Voltammetry vs. Constant Potential Amperometry

In Figure 4, the comparison between CV (Panel A) and CPA (Panel B) techniques is shown.
In Panel A, platinization was carried out with CV technique by means of three series of two consecutive CV cycles, with HP and AA calibration at the end of all series. All the experiments gave significantly different results (p < 0.001) if compared with bare C, settling around an average value of 1.358 nA/µM. No statistical differences were observed among different protocols.
Moreover, data obtained with this protocol resulted in no statistical differences from those obtained by performing HP calibration after each series of two consecutive cycles (data not shown).
In Panel B, CPA protocol results are displayed. Even the platinization obtained with CPA technique produced an increased, statistically higher (p < 0.001), sensitivity if compared with bare C. In this case, not-deoxygenated solution produced the greater increase in sensitivity to HP, equal to 1.153 ± 0.040 nA/µM and 1.374 ± 0.063 nA/µM for 10 mM and 20 mM HA solutions, respectively.
For HP slopes obtained with the CV protocol used in these experiments, results were not statistically different from those obtained with three series of two consecutive CV cycles, with HP and AA calibrations performed between each series, as shown in Figure 3 (Panel A and B, green columns) nor from data obtained after six consecutive CV cycles as displayed in Figure S6, in the Supplementary Material.
In Figure S6, AA slopes obtained with CV and CPA techniques are shown. While the platinization performed by CPA produced no statistically different slope values, the CV protocol caused slope values to be statistically higher (p < 0.001 vs. bare C value), reaching a maximum equal to 0.891 ± 0.052 nA/µM using the HA 10 mM deoxygenated solution.
From an observational study, it is clearly possible to deduce how the platinum deposition obtained via CV was more efficient when compared with data obtained using the CPA technique, since higher sensitivities towards HP are displayed. This phenomenon is probably due to more efficacious and structured platinum deposition. The same difference was highlighted in the monitoring of AA, which was higher for the sensors platinized via CV.

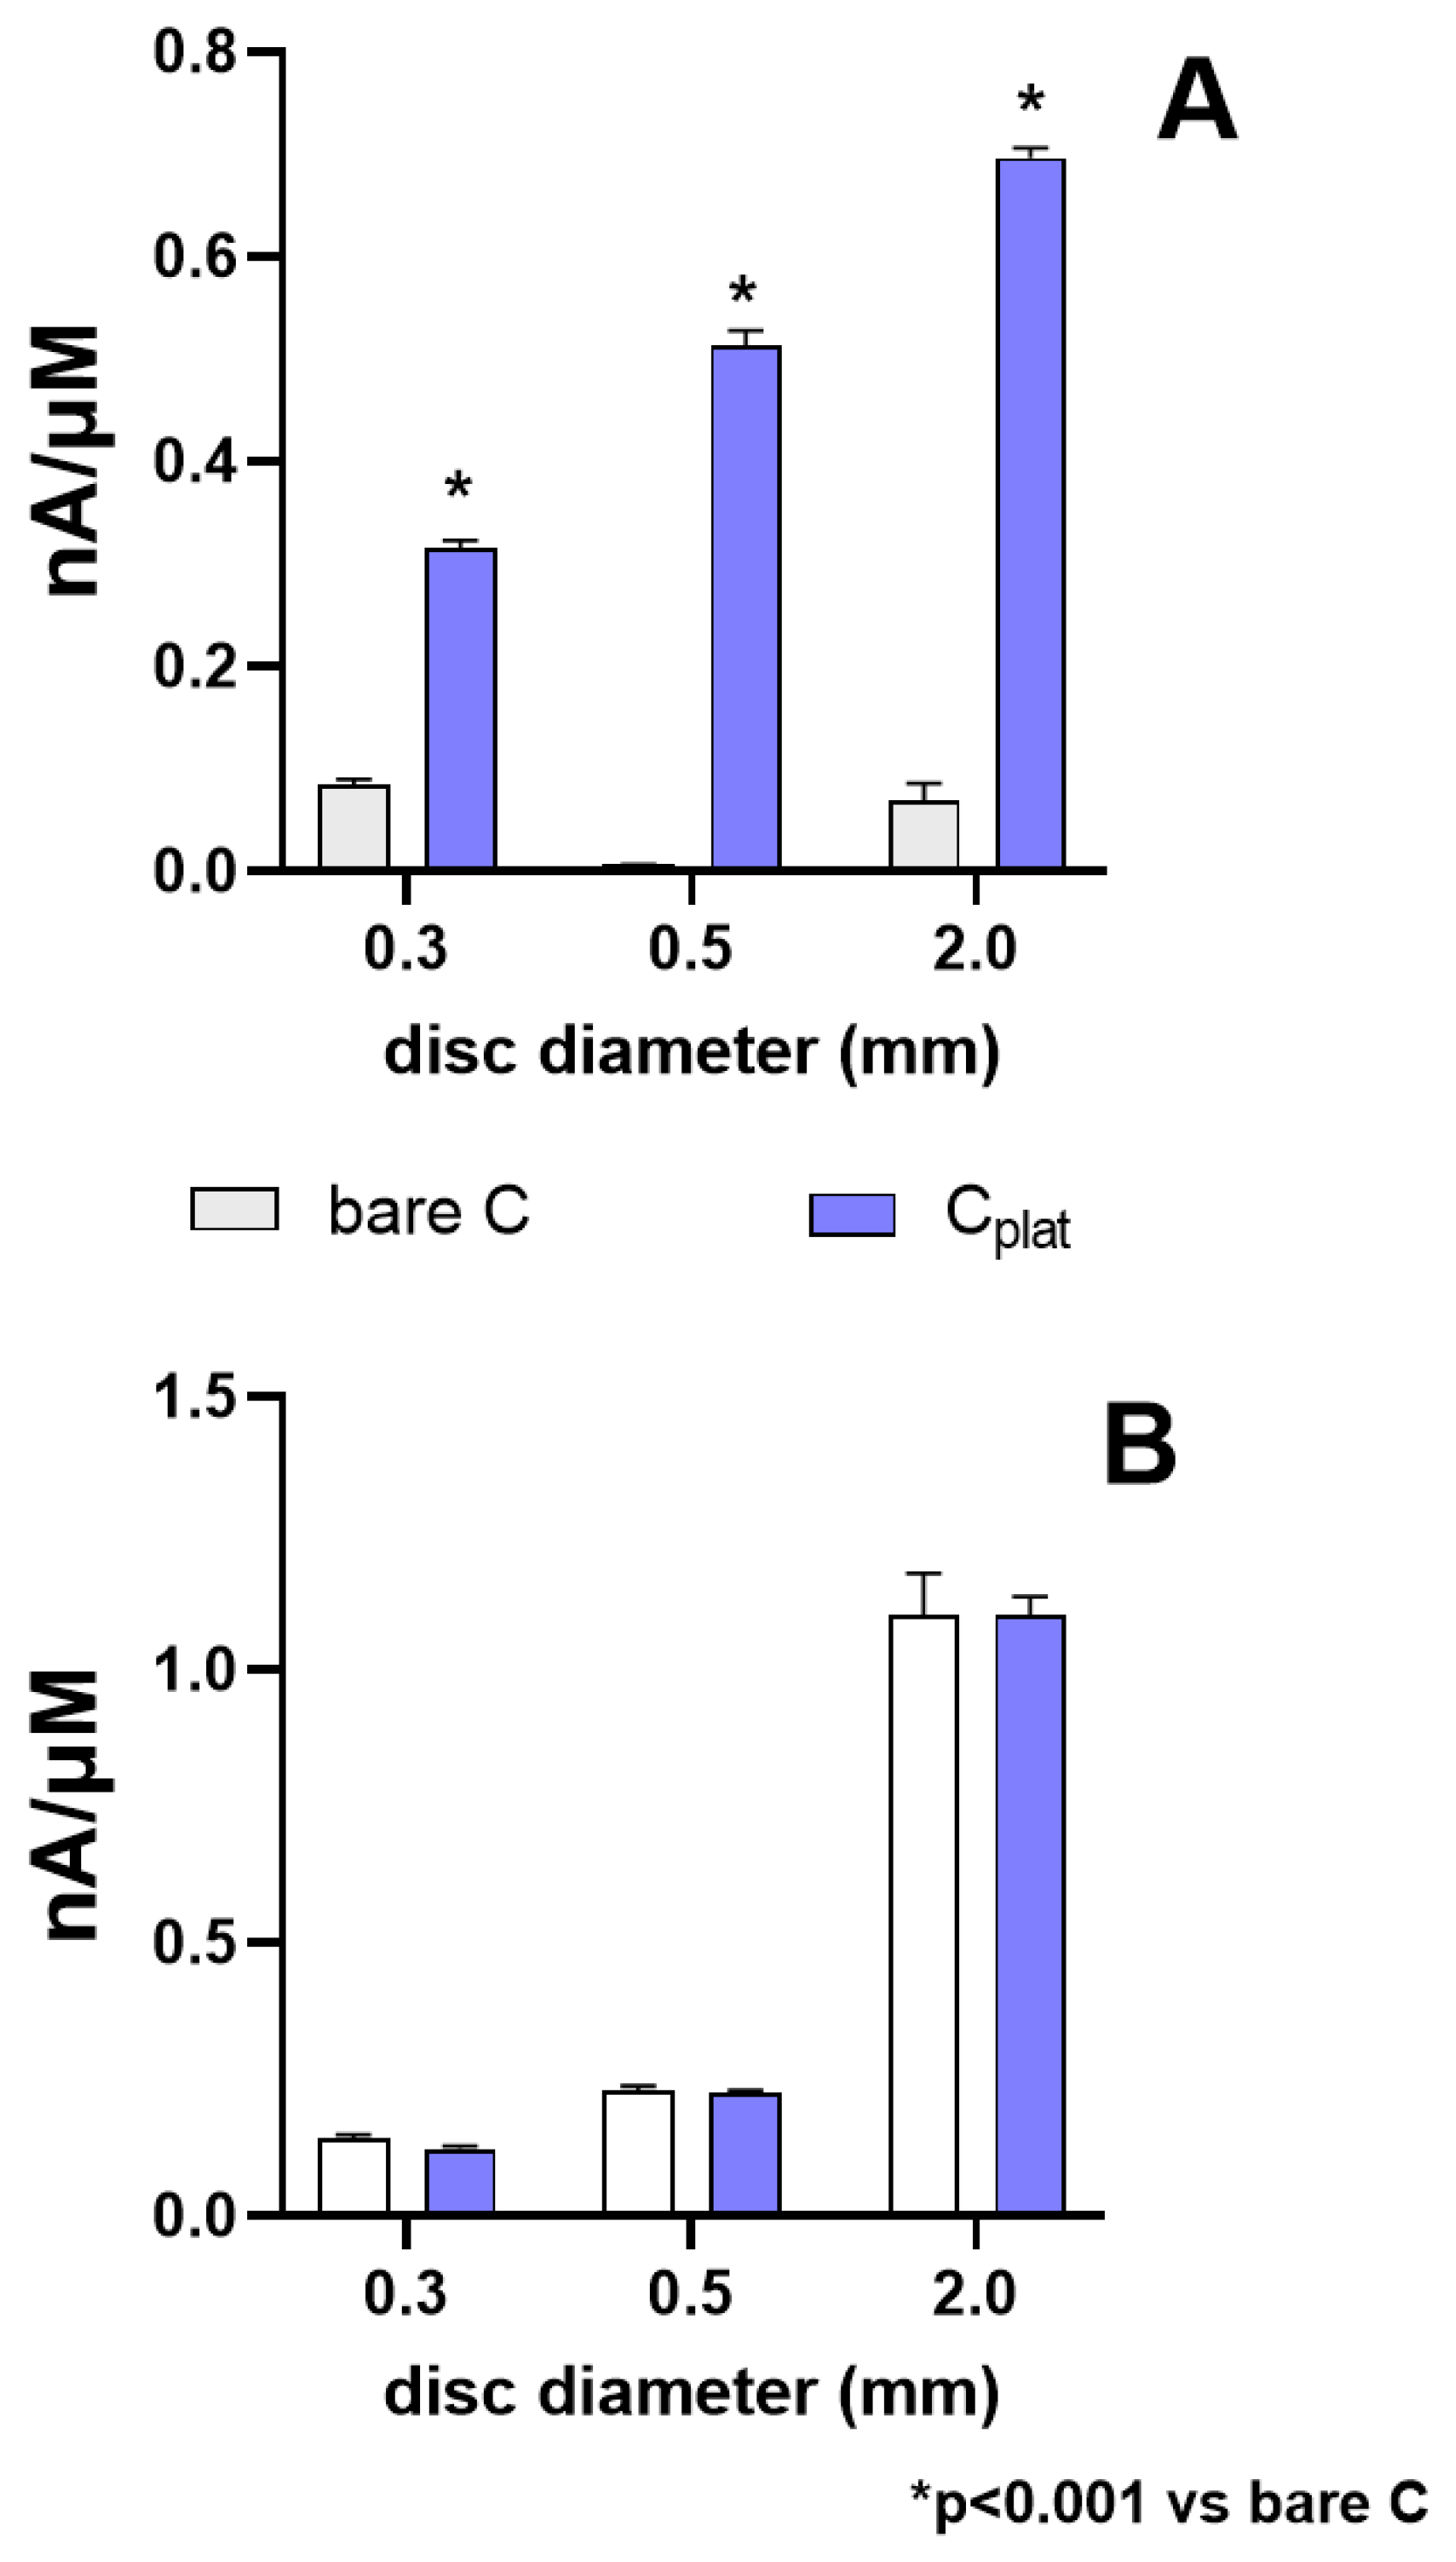
3.3. HP Sensitivity after Platinization on Pencil Leads

After the characterizations were carried out on the CCRs, the best protocol, determined according to the best selectivity index (SI; Figure S2) was applied to the PLs with different diameters.
As shown in Figure 5, sensitivity against HP (Panel A) and AA (Panel B) monitored on pencil leads of different diameters are displayed. Data were obtained by applying the most performant protocol found on the CCRs, as stated in Section 2.3.
In panel A, data from HP calibration are displayed and they demonstrate that platinization produced a statistically higher sensitivity for HP (p < 0.001 vs. bare C), increasing as the diameter of PLs increases. In actuality, the monitored slopes were 0.316 ± 0.007 nA/µM, 0.512 ± 0.015 nA/µM and 0.697 ± 0.010 nA/µM for 0.3, 0.5 and 2.0 mm, respectively.
In Panel B, data from AA calibration are displayed. Surprisingly, contrary to what happened with the CCRs, on all PLs, the platinization did not produce any statistical difference on AA monitoring if compared to the respective bare C values. In general, AA monitoring increased, in parallel to the increase in the diameter of the PLs.
Based on the obtained data, the SI for the PLs was calculated (data not shown). So, based on the SI value, but also by virtue of the small size compatible with an eventual implantation in animal models, the 0.3 mm Ø PLs were chosen for the construction of a glucose biosensor, as reported in Section 3.5.
Among carbon-based materials, PLs have largely been used not only because of their proprieties of chemical inertness, low background current, stability, disposability and ease of modification, but also because of their commercial availability and low cost [53,71]. Because of these features, PLs have been largely employed for electroanalytical monitoring in biological samples [51,72,73,74].
In the present paper, PLs were found to be particularly suitable for platinization, as platinum deposition produced a significant increase in HP monitoring, dependent on the pencil diameter. In some cases, HP monitoring was also present on bare C and, contrary to what occurred with the CCRs, the monitoring of AA was not influenced by the platinization process. These phenomena are most likely due to the presence of clay or impurities, such as resins, polymers or wax in the mixture constituting the leads [53].
Actually, based on the European Letter Scale, different types of leads are produced starting with different mixtures, dependent on the C amount or other components, needed to define their blackness or their degree of hardness. The amount of these excipients compared to graphite could influence the electrochemical response of the leads [53]. In fact, it has been demonstrated how additional clay can influence both the structural and chemical properties of PLs [47]. Therefore, a prospective work could envisage the use of different PLs with different compositions in order to evaluate the impact of these various components on the electrochemical behavior and the deposition of the platinum layer and the response to HP and AA.
Because of all the previous observations, PLs were found to be excellent candidates for the construction of an amperometric biosensor for glucose, in order to obtain a device that is not only sufficiently sensitive and performs well, but is also implantable in animal models.

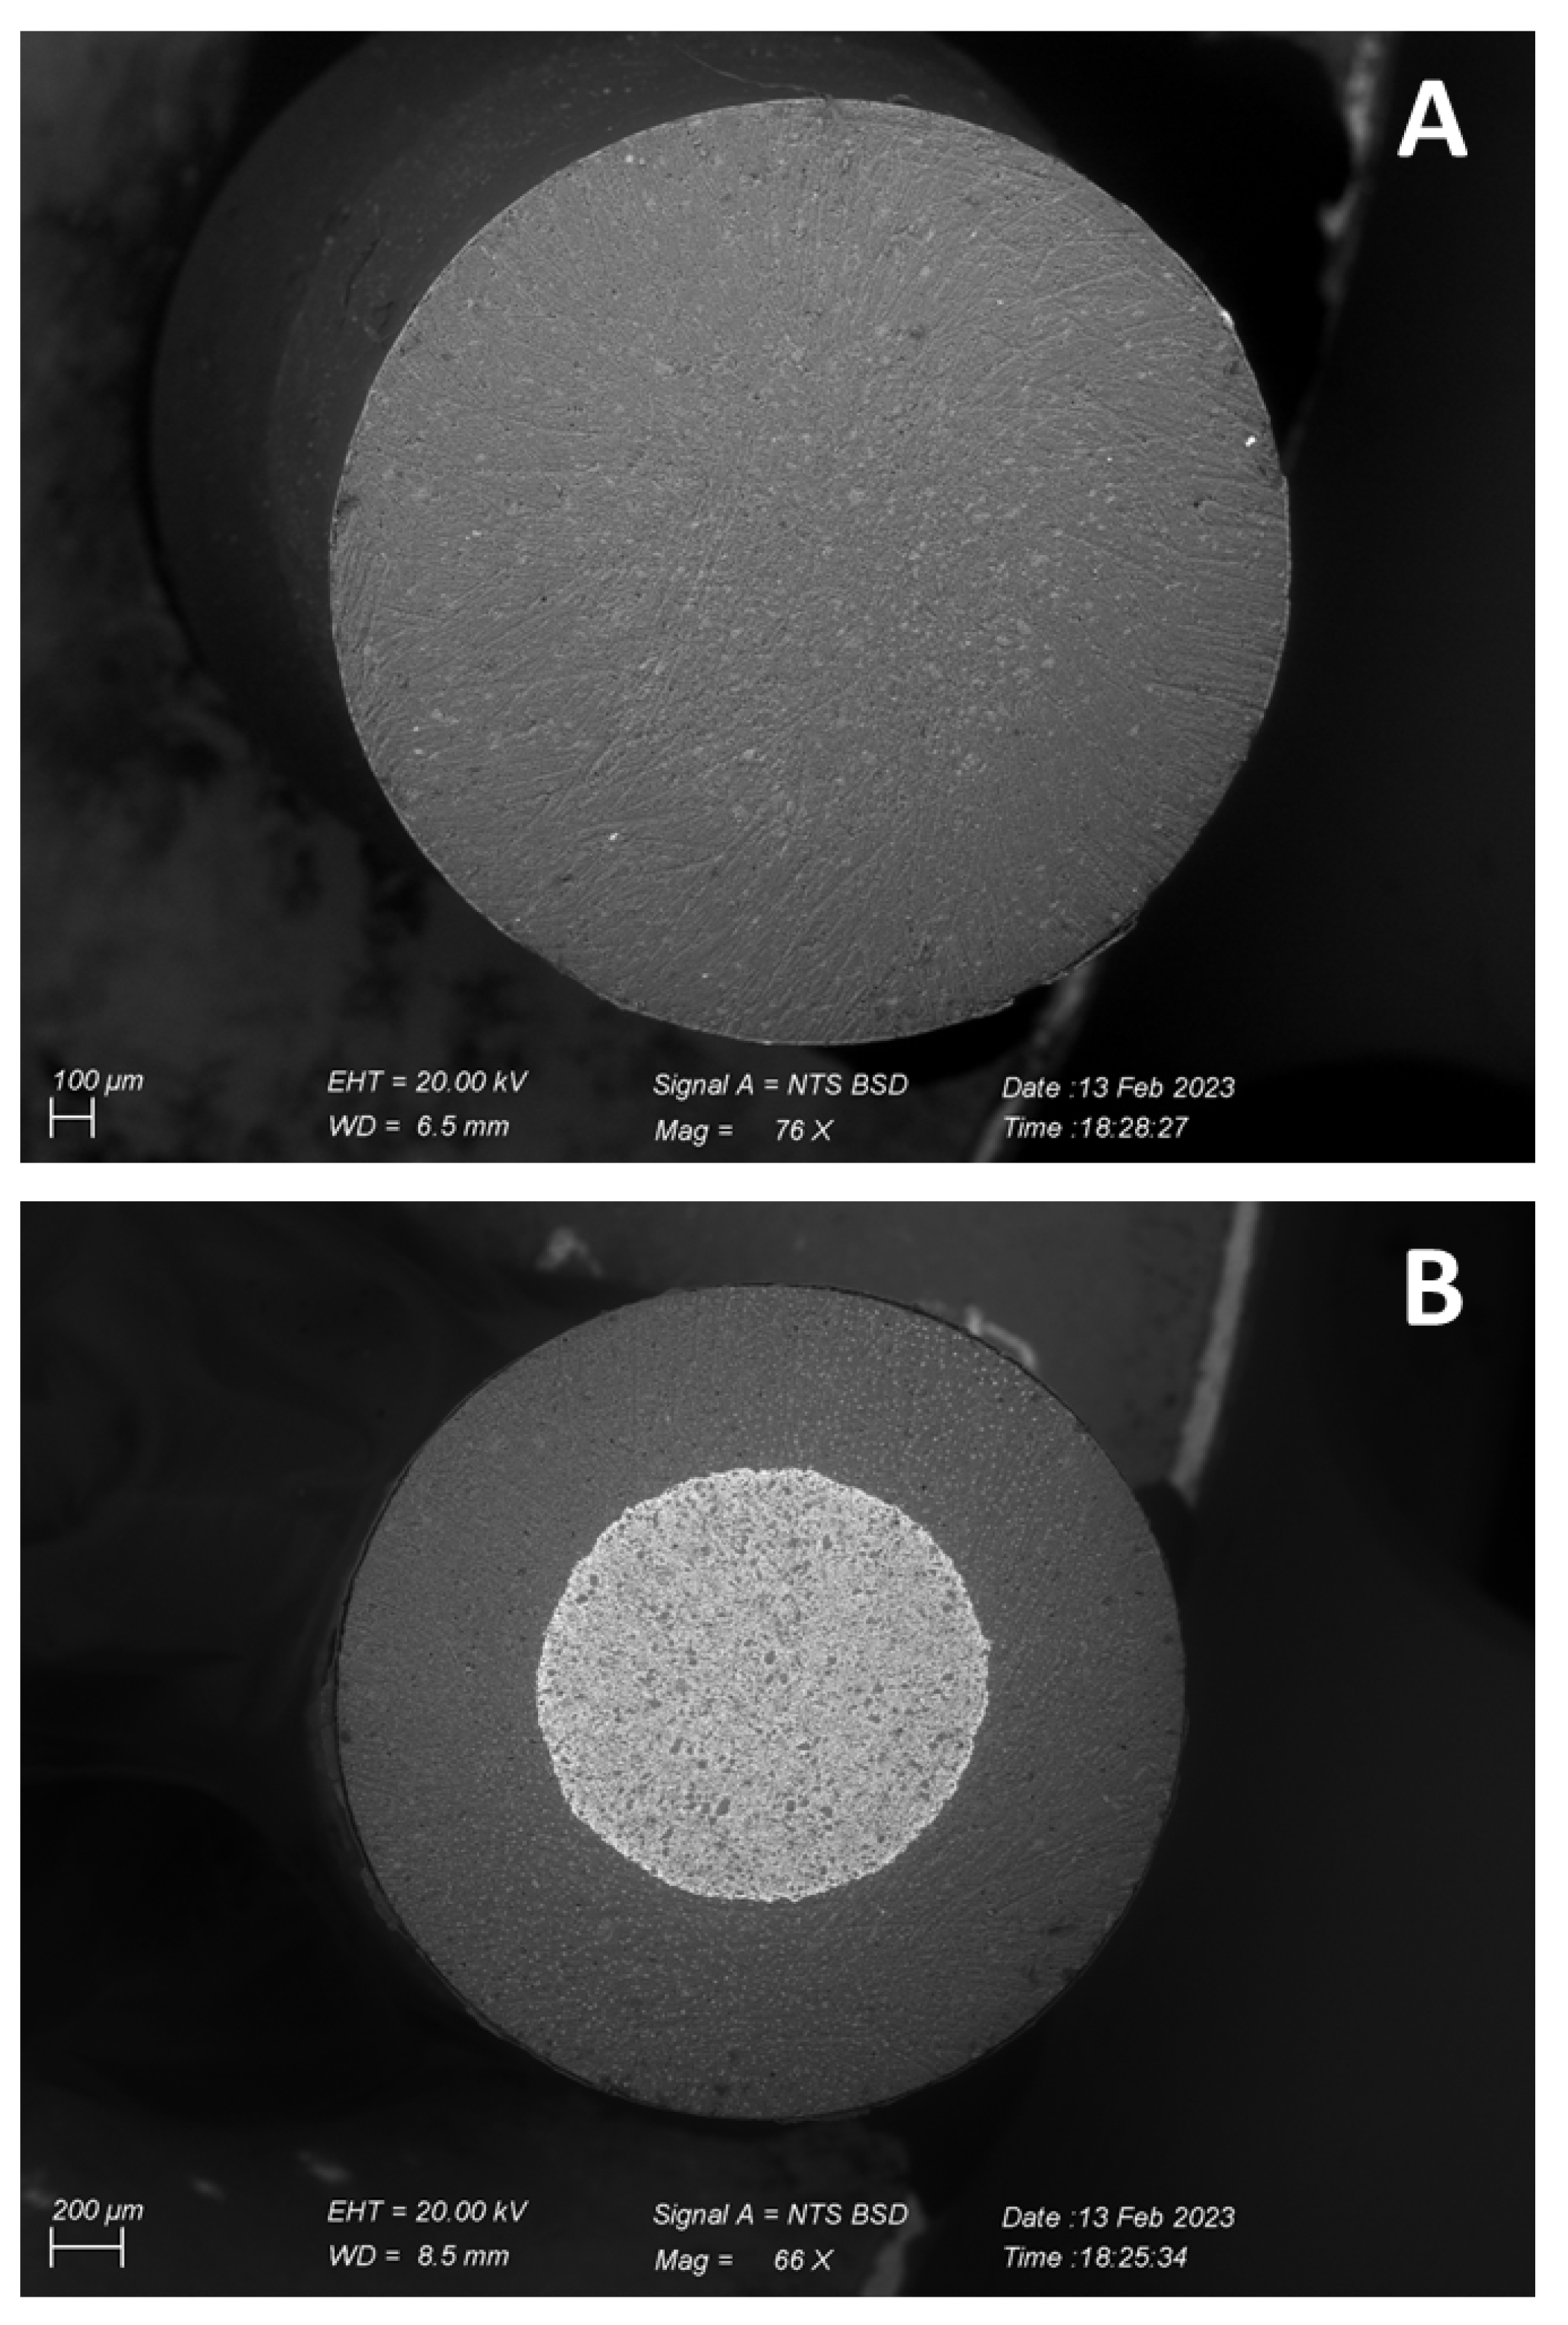
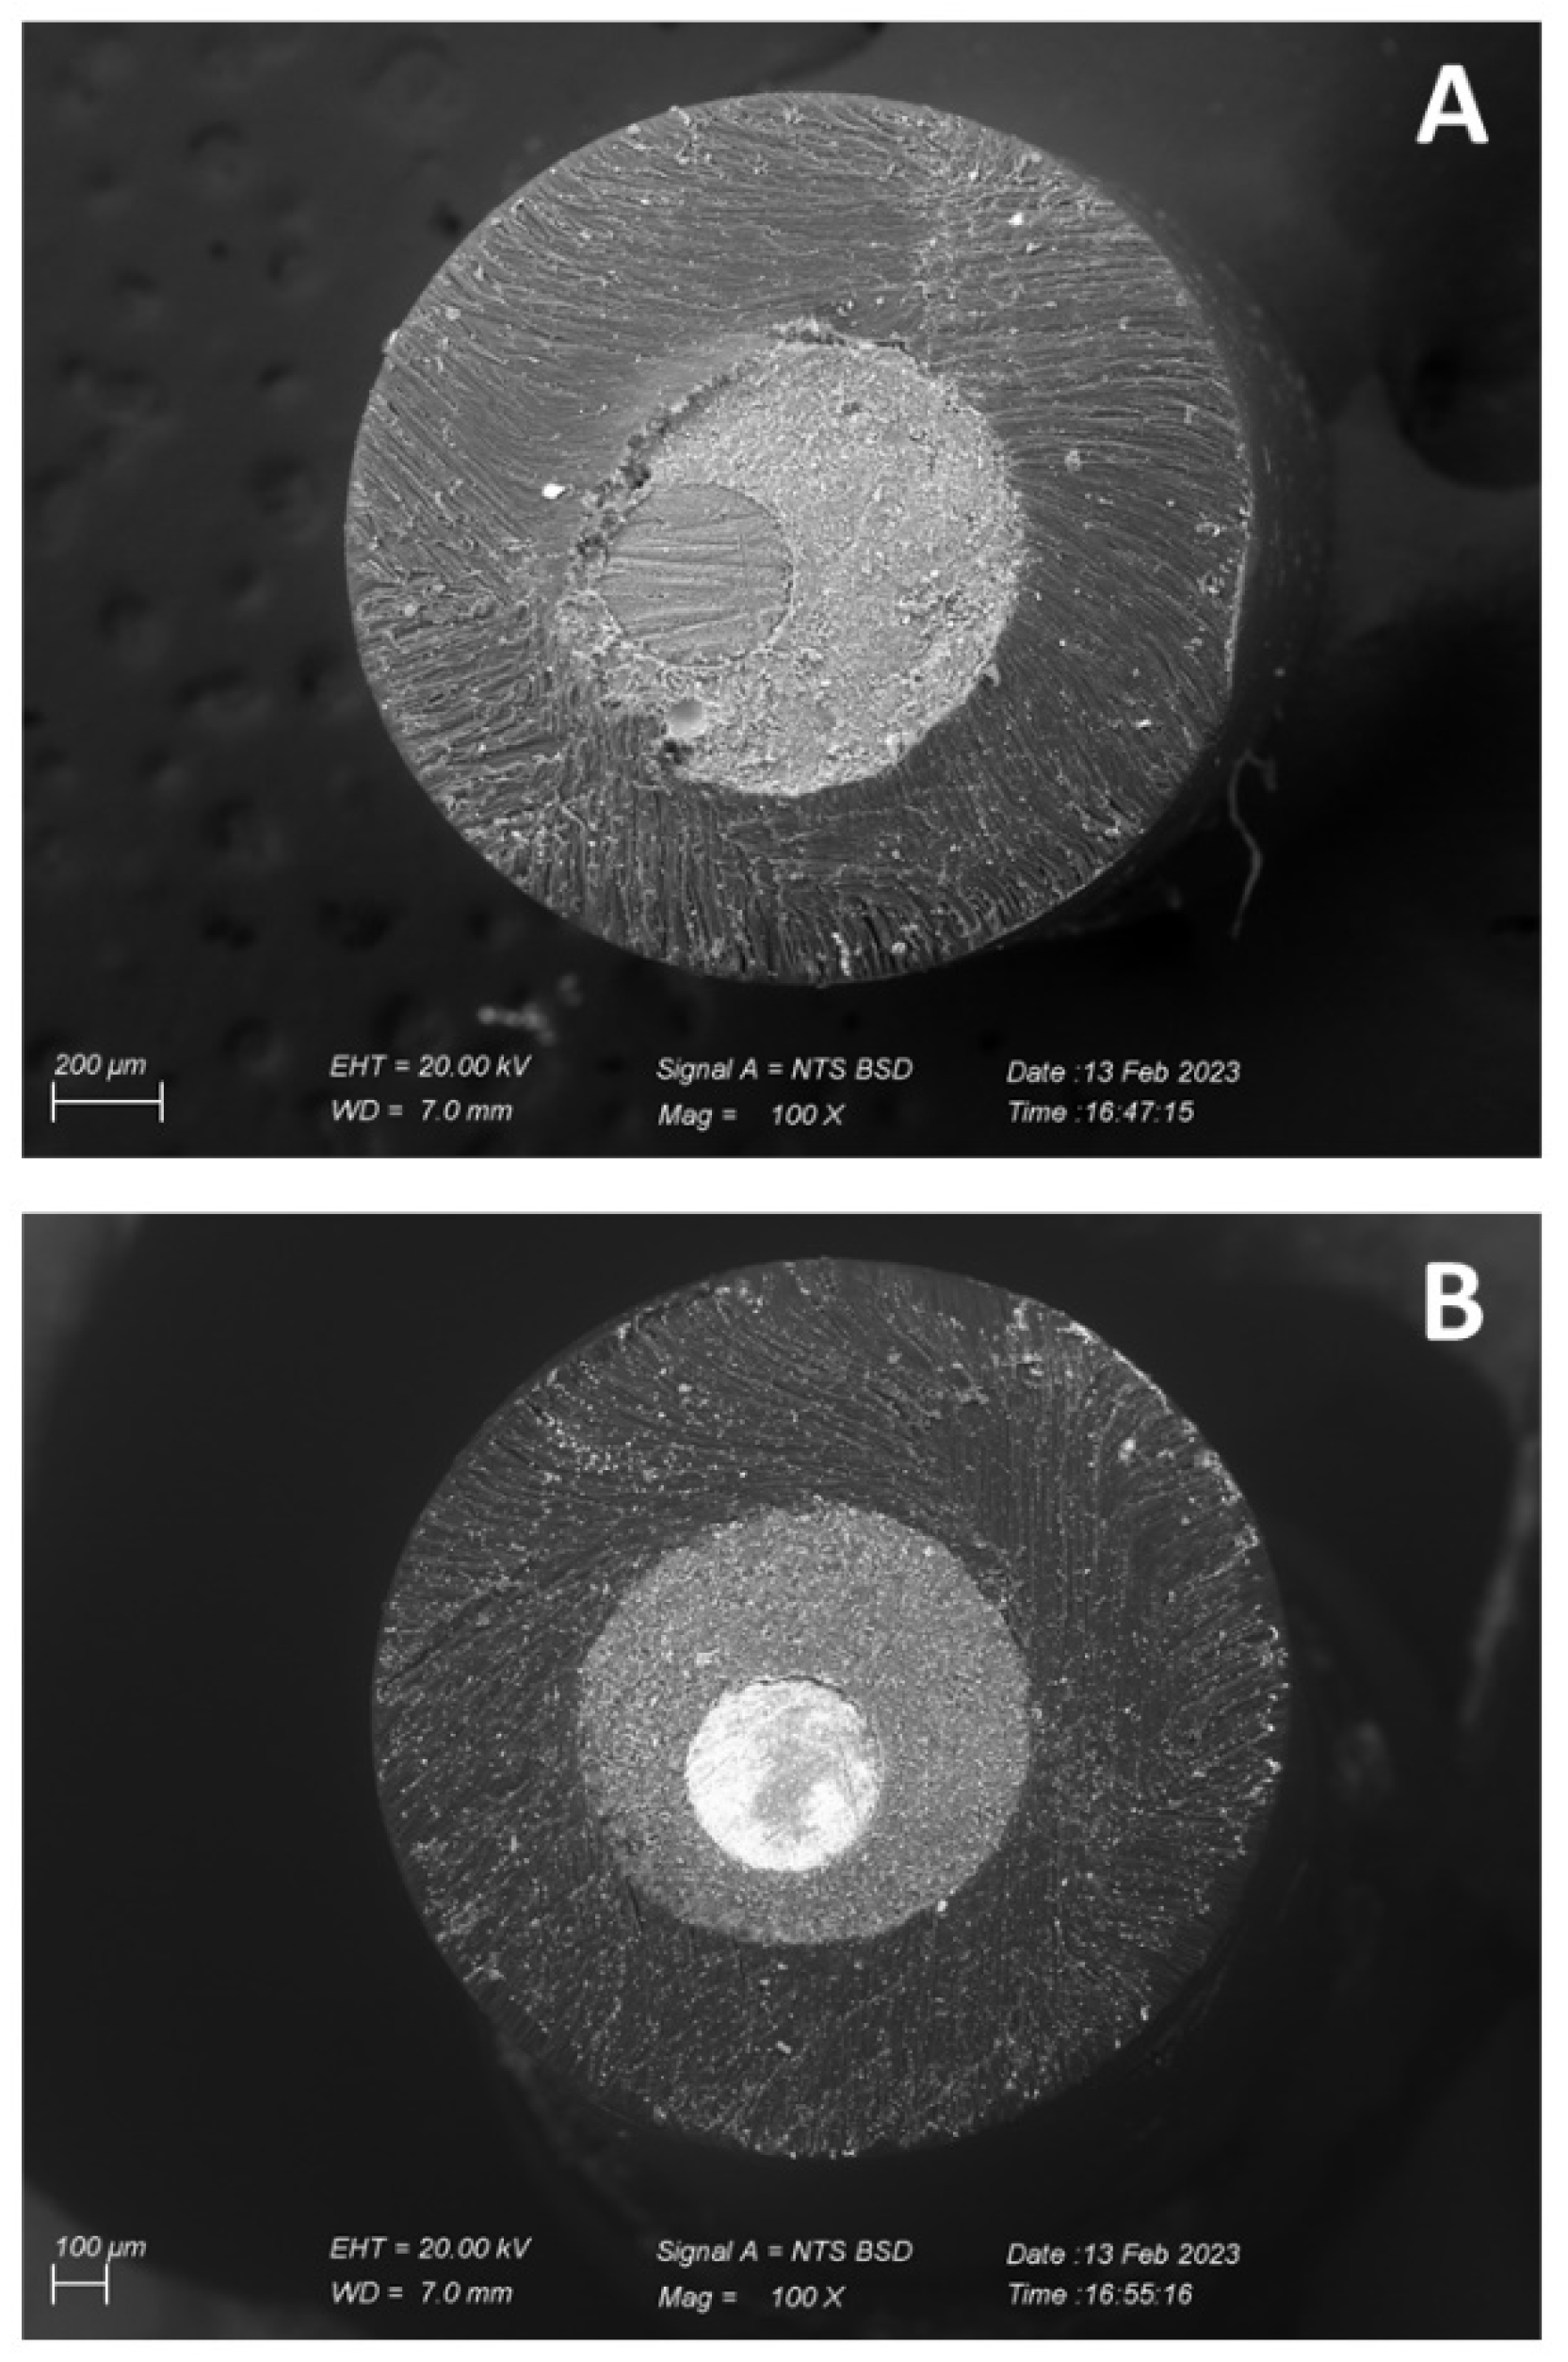
3.4. SEM Images Study

SEM images were obtained for CCR-based and 0.3 mm Ø pencil lead-based sensors, obtained with the best platinization protocol, as specified in the Section 2.3.
In Figure 6, the SEM images of CCRs without any treatment (Panel A) and platinized (Panel B) are shown. As can be seen from the picture, at low magnification, no distinction is made between carbonaceous and ceramic material (Panel A). Nevertheless, in Figure S8 it can be seen that the conductive zone is made up of regions of different granulometry with more homogeneous and larger areas separated by fine-grade zones, which are basically made up of silicates. Following platinization (Figure 6B), a clear distinction of the conductive region on the CCR is observed, with a clear and sharp deposition of heavier atomic elements. By increasing the magnifications (Figure S9), it is possible to highlight the formation of nanoparticle aggregates in the finer granulometry zones, isolated by regions corresponding to coarser particle size (Figure S9A). The average particle size ranges between 150 and 200 nm (Figure S9B,C). The spectrometric analysis (Figure S10) confirms the presence of Pt in particular in the regions with finer particle size and containing nanoparticles (%Pt = 19.49).
In Figure 7, the design of the sensor built with PL clearly stands out. In the picture, the carbonaceous surface of the transducer (the smaller central disc) is evidently highlighted before (Panel A) and after (Panel B) the platinization. At high magnification, the surface (Figure S11) of the graphite surface appears porous and homogeneous and mainly made up of carbon (85.33%). Following the platinization, an heterogeneous deposition of platinum is observed, with the formation of cross-links and pseudo-crystalline formations, which show a diameter of about 10 microns (Figure 8B).
Surprisingly, the spectrometric analysis demonstrates that the platinum is uniformly distributed over the whole surface and a concomitant accumulation of chlorine (but not Na) is observed at the crosslinks and pseudo-crystalline formations, probably related to the use of hexachloroplatinic acid (Figure S12).

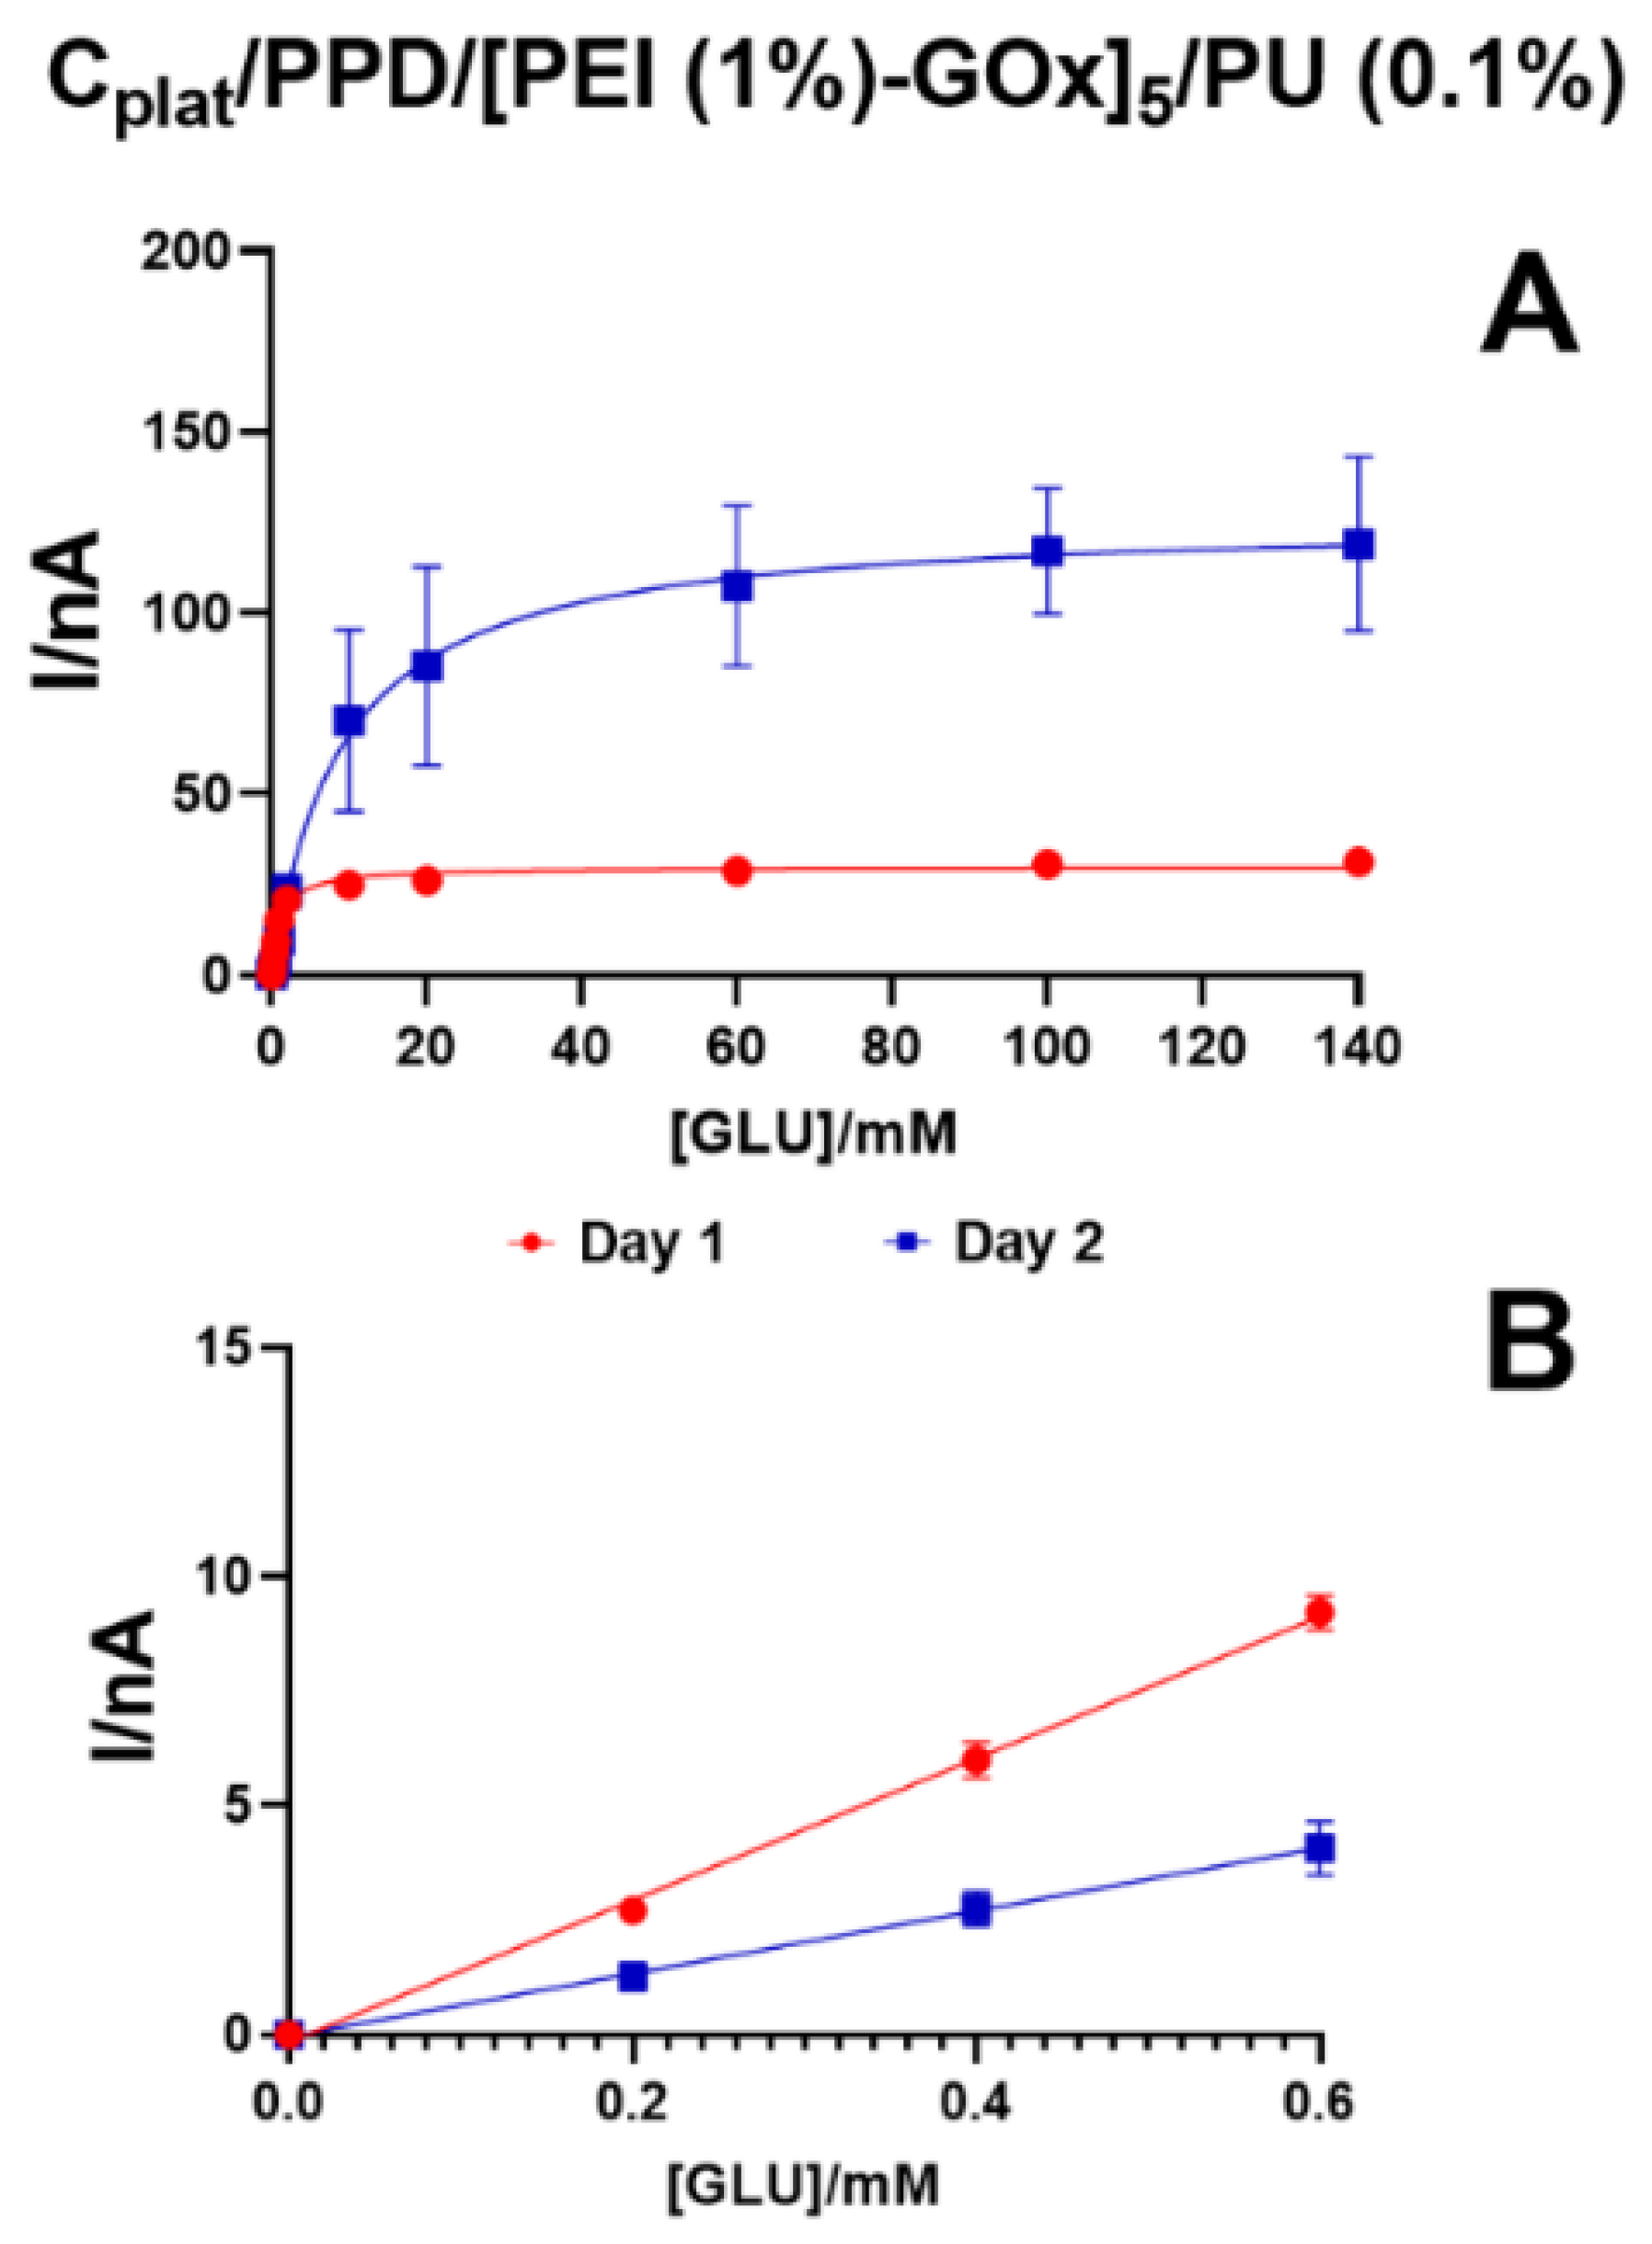
3.5. Glucose Biosensor Results

As shown in Figure 9, calibration data from biosensors (n = 4) with the following design are displayed:
Cplat/PPD/[PEI(1%) − GOx]5/PU(1%)
Calibrations were performed on Day 1 (red plot) and Day 2 (blue plot) after the biosensors’ conservation at −80 °C.
In Panel A, Michaelis–Menten kinetic plots are displayed. From the plot is highlighted how conservation at −80 °C produced an increase both in VMAXs and KMs. Actually, VMAX on Day 1 was 29.9 ± 1.4 nA while on Day 2 increased up to 126.4 ± 12.3 nA. Moreover, KMs ranged from 1.199 ± 0.240 µM on Day 1 and went up to 9.113 ± 3.353 µM on Day 2.
As shown in Panel B, even LRSs underwent changes from Day 1 to Day 2, where values were 15.490 ± 0.382 nA/µM and 6.868 ± 0.444 nA/µM, respectively.
In Figure S13, AA slopes obtained on bare C, after platinization and after PPD polymer deposition are displayed. As shown in Figure S6, even in these experiments, the platinization of the 0.3 mm PLs did not produce any significative variation in AA monitoring. As expected, the deposition of the PPD polymer determined a significant (p < 0.001 vs. on bare C) decrease in AA monitoring of about 87%, showing that even on the platinized carbon, the formation of the PPD polymer took place correctly even if not fully performing.
As shown in Figure 9, platinized PLs were found to be highly suitable for amperometric biosensors. The platinum layer was found to be well-suited to the enzyme, which was able to perform its catalytic activities against glucose. Moreover, contrary to what is reported in some of the literature, in which the deposited platinum layer has a short life [33], the platinum coating obtained with our protocols was found to be resistant not only to repeated calibrations, as shown in Figure 3, but also to the freezing/thawing processes undergone by the biosensor. The devices constructed on platinized PLs had the same behavior compared to those built on platinum wires, as previously described [59,60,61,75,76,77], also with regard to the process of electropolymerization of PPD. In fact, as shown in Figure S6, the monitoring of AA on the platinized and PPD polymerized PLs underwent a significant decrease, demonstrating that the formation of the PPD polymer occurred correctly and that the same polymer behaved as a barrier against the interfering electroactive species. Contrary to what occurs on Pt wires, in which the shielding following PPD stratification reaches values higher than 99%, in the devices developed in the present work, this shielding reached about 87%. These data are actually of great importance, as this makes these devices usable in most matrices, not necessarily biological ones; however, it is not sufficiently performing for monitoring in the neuronal spaces of preclinical models. With regard to this aspect, the use of other hydrosoluble monomers capable of producing permselective polymers [78,79,80,81] is foreseen in order to improve shielding against AA and obtain better selectivity for use in animal models.

4. Conclusions

In the present study, we demonstrated how widely and easily available industrial graphite-based products can be platinized in order to produce transducers for HP detection and the construction of first-generation amperometric biosensors (oxidase-based). In particular, in this project, for the first time, CCRs were used as sensors and the obtained results are encouraging overall. In contrast to pencil leads, CCRs have shown limitations in the electrosynthesis of permselective films and, at present, are not particularly suitable for the construction of biosensors capable of effectively rejecting the oxidizable interferents eventually present in the matrix. Studies are underway to use other monomers (such as eugenol, isoeugenol, magnolol) for the creation of more performing shielding layers than PPD.

Supplementary Materials

The following supporting information can be downloaded at: https://www.mdpi.com/article/10.3390/chemosensors11030153/s1, Figure S1: Pictures of the carbonaceous sensors used in the present paper. A: Carbon composite resistor—1.250 mm Ø; B: pencil lead—0.3 mm Ø; C: pencil lead—0.5 mm Ø; D: pencil lead—2.0 mm Ø. Figure S2: Scheme of the platinization protocols used in the present paper. Figure S3: In Panel A is reported a representative CV cycle performed on CCR (red dotted line) and on PL (blue dotted line) obtained by applying the following parameters: ΔE = −1.0 ÷ +0.5 V vs. Ag/AgCl, scan rate = 0.75 Vs−1. The voltammograms were obtained in a deoxygenated solution of HA 10 mM. In Panel B is highlighted the graph obtained by applying CPA parameters (Eapp = −200 mV vs. Ag/AgCl, t = 10 s) on CCR. Figure S4: Selectivity indexes (SI) calculated for all the CV platinization protocols used. Figure S5: AA slopes, expressed as nA/µM ± SEM, resulting from CV protocols after 2 cycle series using 10 mM (panel A) or 20 mM (panel B) HA solution deoxygenated (a) and not deoxygenated (b). n = 4; *: p < 0.001 vs. respective on bare a; #: p < 0.001 vs. respective on bare b. Figure S6: AA slopes, expressed as nA/µM ± SEM, obtained from 2 + 2 + 2 CV cycles (Panel A) and CPA (Panel B) using different HA solutions: 1: on bare C; 2: HA 10 mM deoxygenated, 3: HA 20 mM deoxygenated, 4: HA 10 mM not-deoxygenated, 5: HA 20 mM not-deoxygenated. * p < 0.001 vs. on bare C. Figure S7: HP (Panel A) and AA (Panel B) monitoring on microsensors obtained with 6 consecutive CV cycles. Slopes are given as nA/µM ± SEM; n = 4; * p < 0.001 vs. 1. Figure S8: Scanning electron micrographs of CCR carbonaceous surface (800× of magnification). In the inset is the magnification (1800× magnification) of an area with fine granulometry of the surface. The dashed curved line indicates the zone of separation between the carbon and ceramic surfaces. Figure S9: Scanning electron micrographs of platinized CCR surface at different magnifications (1800× panel A, 8830× Panel B, 2500× Panel C). Figure S10: EDX Spectrometric analysis of selected areas of platinized CCR surface. On the left, scanning micrograph is shown, while on the right spectra and percentage composition are reported instead. The orange cross indicates the exact area where the the spectrometric analysis was carried out. Figure S11: Scanning electron micrographs of 0.3 mm Ø PL-based sensor at 800× (Panel A) and 1800× (Panel B) of magnification. In Panel C the EDX spectrometric analysis of a specific area of the surface is reported. The orange cross indicates the exact area where the spectrometric analysis was carried out. Figure S12: Scanning electron micrographs of PL-based sensor at 800× (Panel A) and 1800× (Panel B) magnification. In Panel C the EDX spectrometric analysis of a specific area of the surface is reported. The orange cross indicates the exact area where the spectrometric analysis was carried out. Figure S13: AA slopes, expressed as nA/µM ± SEM, calculated for PLs 0.3 mm of diameter before and after biosensor (n = 4) construction. Data were obtained on bare C (white column), after platinization (red column) and after PPD deposition (blue column). *: p < 0.001 vs. on bare C.

Author Contributions

Investigation: M.C. and C.S.; SEM/EDX Investigation: S.M.; Methodology: G.R.; Writing—original draft: G.R.; Vsualization: S.M.; Supervision: G.R. and P.A.S.; Project administration: G.R. and P.A.S.; Funding acquisition: G.R. and P.A.S.; Conceptualization: P.A.S.; Writing—review & editing: P.A.S. All authors have read and agreed to the published version of the manuscript.

Funding

This research received no external funding.

Institutional Review Board Statement

Not applicable.

Informed Consent Statement

Not applicable.

Data Availability Statement

Not applicable.

Conflicts of Interest

The authors declare no conflict of interest.

References

  1. Thakur, M.S.; Ragavan, K.V. Biosensors in Food Processing. J. Food Sci. Technol. 2013, 50, 625–641. [Google Scholar] [CrossRef] [PubMed] [Green Version]
  2. Farina, D.; Zinellu, M.; Fanari, M.; Porcu, M.C.; Scognamillo, S.; Puggioni, G.M.G.; Rocchitta, G.; Serra, P.A.; Pretti, L. Development of a Biosensor Telemetry System for Monitoring Fermentation in Craft Breweries. Food Chem. 2017, 218, 479–486. [Google Scholar] [CrossRef]
  3. Barberis, A.; Spissu, Y.; Bazzu, G.; Fadda, A.; Azara, E.; Sanna, D.; Schirra, M.; Serra, P.A. Development and Characterization of an Ascorbate Oxidase-Based Sensor–Biosensor System for Telemetric Detection of AA and Antioxidant Capacity in Fresh Orange Juice. Anal. Chem. 2014, 86, 8727–8734. [Google Scholar] [CrossRef] [PubMed]
  4. Villalonga, A.; Sánchez, A.; Mayol, B.; Reviejo, J.; Villalonga, R. Electrochemical Biosensors for Food Bioprocess Monitoring. Curr. Opin. Food Sci. 2022, 43, 18–26. [Google Scholar] [CrossRef]
  5. Tetyana, P.; Shumbula, P.M.; Njengele-Tetyana, Z. Biosensors: Design, Development and Applications. In Nanopores; Ameen, S., Akhtar, M.S., Shin, H.-S., Eds.; IntechOpen: London, UK, 2021; ISBN 978-1-83880-209-7. [Google Scholar]
  6. Wang, K.; Lin, X.; Zhang, M.; Li, Y.; Luo, C.; Wu, J. Review of Electrochemical Biosensors for Food Safety Detection. Biosensors 2022, 12, 959. [Google Scholar] [CrossRef] [PubMed]
  7. Wang, J. Amperometric Biosensors for Clinical and Therapeutic Drug Monitoring: A Review. J. Pharm. Biomed. Anal. 1999, 19, 47–53. [Google Scholar] [CrossRef] [PubMed]
  8. Pupim Ferreira, A.A.; Venturini, C.; de Souza Castilho, M.; Canaverolo, N.; Vinicius, M.; dos Santos, G.P.; Sadao, C.; Vicente, A.; Yamanak, H. Amperometric Biosensor for Diagnosis of Disease. In State of the Art in Biosensors-Environmental and Medical Applications; Rinken, T., Ed.; InTech: Singapore, 2013; ISBN 978-953-51-1035-4. [Google Scholar]
  9. Haleem, A.; Javaid, M.; Singh, R.P.; Suman, R.; Rab, S. Biosensors Applications in Medical Field: A Brief Review. Sens. Int. 2021, 2, 100100. [Google Scholar] [CrossRef]
  10. Alhadrami, H.A. Biosensors: Classifications, Medical Applications, and Future Prospective. Biotechnol. Appl. Biochem. 2018, 65, 497–508. [Google Scholar] [CrossRef] [PubMed]
  11. Wang, S.; Liu, Y.; Zhu, A.; Tian, Y. In Vivo Electrochemical Biosensors: Recent Advances in Molecular Design, Electrode Materials, and Electrochemical Devices. Anal. Chem. 2023, 95, 388–406. [Google Scholar] [CrossRef]
  12. Pedersen, O.; Revsbech, N.P.; Shabala, S. Microsensors in Plant Biology: In Vivo Visualization of Inorganic Analytes with High Spatial and/or Temporal Resolution. J. Exp. Bot. 2020, 71, 3941–3954. [Google Scholar] [CrossRef]
  13. Dzyadevych, S.V.; Arkhypova, V.N.; Soldatkin, A.P.; El’skaya, A.V.; Martelet, C.; Jaffrezic-Renault, N. Amperometric Enzyme Biosensors: Past, Present and Future. IRBM 2008, 29, 171–180. [Google Scholar] [CrossRef]
  14. Merchant, S.A.; Tran, T.O.; Meredith, M.T.; Cline, T.C.; Glatzhofer, D.T.; Schmidtke, D.W. High-Sensitivity Amperometric Biosensors Based on Ferrocene-Modified Linear Poly(Ethylenimine). Langmuir 2009, 25, 7736–7742. [Google Scholar] [CrossRef] [PubMed]
  15. Sadeghi, S.J. Amperometric Biosensors. In Encyclopedia of Biophysics; Roberts, G.C.K., Ed.; Springer: Berlin/Heidelberg, Germany, 2013; pp. 61–67. ISBN 978-3-642-16711-9. [Google Scholar]
  16. Ahmed, S.; Shaikh, N.; Pathak, N.; Sonawane, A.; Pandey, V.; Maratkar, S. An Overview of Sensitivity and Selectivity of Biosensors for Environmental Applications. In Tools, Techniques and Protocols for Monitoring Environmental Contaminants; Elsevier: Amsterdam, The Netherlands, 2019; pp. 53–73. ISBN 978-0-12-814679-8. [Google Scholar]
  17. Liu, Z.; Tian, Y. Recent Advances in Development of Devices and Probes for Sensing and Imaging in the Brain. Sci. China Chem. 2021, 64, 915–931. [Google Scholar] [CrossRef]
  18. Bojesen, K.B.; Andersen, K.A.; Rasmussen, S.N.; Baandrup, L.; Madsen, L.M.; Glenthøj, B.Y.; Rostrup, E.; Broberg, B.V. Glutamate Levels and Resting Cerebral Blood Flow in Anterior Cingulate Cortex Are Associated at Rest and Immediately Following Infusion of S-Ketamine in Healthy Volunteers. Front. Psychiatry 2018, 9, 22. [Google Scholar] [CrossRef] [PubMed] [Green Version]
  19. Zhu, Y.-C.; Mei, L.-P.; Ruan, Y.-F.; Zhang, N.; Zhao, W.-W.; Xu, J.-J.; Chen, H.-Y. Enzyme-Based Biosensors and Their Applications. In Advances in Enzyme Technology; Elsevier: Amsterdam, The Netherlands, 2019; pp. 201–223. ISBN 978-0-444-64114-4. [Google Scholar]
  20. Kaur, J.; Choudhary, S.; Chaudhari, R.; Jayant, R.D.; Joshi, A. Enzyme-Based Biosensors. In Bioelectronics and Medical Devices; Elsevier: Amsterdam, The Netherlands, 2019; pp. 211–240. ISBN 978-0-08-102420-1. [Google Scholar]
  21. Bhalla, N.; Jolly, P.; Formisano, N.; Estrela, P. Introduction to Biosensors. Essays Biochem. 2016, 60, 1–8. [Google Scholar] [CrossRef] [PubMed] [Green Version]
  22. Stoytcheva, M.; Zlatev, R.; Velkova, Z.; Valdez, B.; Ovalle, M. Analytical Characteristics of Electrochemical Biosensors. Port. Electrochim. Acta 2009, 27, 353–362. [Google Scholar] [CrossRef]
  23. Wahart, A.J.C.; Staniland, J.; Miller, G.J.; Cosgrove, S.C. Oxidase Enzymes as Sustainable Oxidation Catalysts. R. Soc. Open Sci. 2022, 9, 211572. [Google Scholar] [CrossRef]
  24. Rathee, K.; Dhull, V.; Dhull, R.; Singh, S. Biosensors Based on Electrochemical Lactate Detection: A Comprehensive Review. Biochem. Biophys. Rep. 2016, 5, 35–54. [Google Scholar] [CrossRef] [Green Version]
  25. Bacciu, A.; Arrigo, P.; Migheli, R.; Peana, A.T.; Rocchitta, G.; Serra, P.A. A Study on the Combination of Enzyme Stabilizers and Low Temperatures in the Long-Term Storage of Glutamate Biosensor. Chemosensors 2021, 9, 129. [Google Scholar] [CrossRef]
  26. Rocchitta, G.; Secchi, O.; Alvau, M.D.; Migheli, R.; Calia, G.; Bazzu, G.; Farina, D.; Desole, M.S.; O’Neill, R.D.; Serra, P.A. Development and Characterization of an Implantable Biosensor for Telemetric Monitoring of Ethanol in the Brain of Freely Moving Rats. Anal. Chem. 2012, 84, 7072–7079. [Google Scholar] [CrossRef]
  27. Wang, H.; Lang, Q.; Liang, B.; Liu, A. Electrochemical Glucose Biosensor Based on Glucose Oxidase Displayed on Yeast Surface. In Yeast Surface Display; Liu, B., Ed.; Methods in Molecular Biology; Springer: New York, NY, USA, 2015; Volume 1319, pp. 233–243. ISBN 978-1-4939-2747-0. [Google Scholar]
  28. Zhang, M.; Zhang, J.; Ding, Z.; Wang, H.; Huang, L.; Feng, X. Laser-Induced Graphene Arrays-Based Three-Phase Interface Enzyme Electrode for Reliable Bioassays. Biomimetics 2023, 8, 26. [Google Scholar] [CrossRef] [PubMed]
  29. Raymundo-Pereira, P.A.; Silva, T.A.; Caetano, F.R.; Ribovski, L.; Zapp, E.; Brondani, D.; Bergamini, M.F.; Marcolino, L.H.; Banks, C.E.; Oliveira, O.N.; et al. Polyphenol Oxidase-Based Electrochemical Biosensors: A Review. Anal. Chim. Acta 2020, 1139, 198–221. [Google Scholar] [CrossRef] [PubMed]
  30. Dudkaitė, V.; Bagdžiūnas, G. Functionalization of Glucose Oxidase in Organic Solvent: Towards Direct Electrical Communication across Enzyme-Electrode Interface. Biosensors 2022, 12, 335. [Google Scholar] [CrossRef] [PubMed]
  31. Bauer, J.A.; Zámocká, M.; Majtán, J.; Bauerová-Hlinková, V. Glucose Oxidase, an Enzyme “Ferrari”: Its Structure, Function, Production and Properties in the Light of Various Industrial and Biotechnological Applications. Biomolecules 2022, 12, 472. [Google Scholar] [CrossRef] [PubMed]
  32. O’Neill, R.D.; Chang, S.-C.; Lowry, J.P.; McNeil, C.J. Comparisons of Platinum, Gold, Palladium and Glassy Carbon as Electrode Materials in the Design of Biosensors for Glutamate. Biosens. Bioelectron. 2004, 19, 1521–1528. [Google Scholar] [CrossRef] [Green Version]
  33. Chatard, C.; Sabac, A.; Moreno-Velasquez, L.; Meiller, A.; Marinesco, S. Minimally Invasive Microelectrode Biosensors Based on Platinized Carbon Fibers for in Vivo Brain Monitoring. ACS Cent. Sci. 2018, 4, 1751–1760. [Google Scholar] [CrossRef]
  34. Salazar, P.; Martín, M.; O’Neill, R.D.; González-Mora, J.L. In Vivo Biosensor Based on Prussian Blue for Brain Chemistry Monitoring: Methodological Review and Biological Applications. In In Vivo Neuropharmacology and Neurophysiology; Philippu, A., Ed.; Neuromethods; Springer: New York, NY, USA, 2017; Volume 121, pp. 155–179. ISBN 978-1-4939-6488-8. [Google Scholar]
  35. Zain, Z.M.; O’Neill, R.D.; Lowry, J.P.; Pierce, K.W.; Tricklebank, M.; Dewa, A.; Ghani, S.A. Development of an Implantable D-Serine Biosensor for in Vivo Monitoring Using Mammalian d-Amino Acid Oxidase on a Poly (o-Phenylenediamine) and Nafion-Modified Platinum–Iridium Disk Electrode. Biosens. Bioelectron. 2010, 25, 1454–1459. [Google Scholar] [CrossRef] [Green Version]
  36. Ford, R.; Quinn, S.; O’Neill, R. Characterization of Biosensors Based on Recombinant Glutamate Oxidase: Comparison of Crosslinking Agents in Terms of Enzyme Loading and Efficiency Parameters. Sensors 2016, 16, 1565. [Google Scholar] [CrossRef] [Green Version]
  37. Lowry, J.P.; McAteer, K.; El Atrash, S.S.; Duff, A.; O’Neill, R.D. Characterization of Glucose Oxidase-Modified Poly(Phenylenediamine)-Coated Electrodes in Vitro and in Vivo: Homogeneous Interference by Ascorbic Acid in Hydrogen Peroxide Detection. Anal. Chem. 1994, 66, 1754–1761. [Google Scholar] [CrossRef] [Green Version]
  38. Deng, Z.; Zhao, L.; Zhou, H.; Xu, X.; Zheng, W. Recent Advances in Electrochemical Analysis of Hydrogen Peroxide towards in Vivo Detection. Process Biochem. 2022, 115, 57–69. [Google Scholar] [CrossRef]
  39. Samad, S.; Loh, K.S.; Wong, W.Y.; Lee, T.K.; Sunarso, J.; Chong, S.T.; Wan Daud, W.R. Carbon and Non-Carbon Support Materials for Platinum-Based Catalysts in Fuel Cells. Int. J. Hydrogen Energy 2018, 43, 7823–7854. [Google Scholar] [CrossRef]
  40. Lee, W.-J.; Bera, S.; Kim, C.M.; Koh, E.-K.; Hong, W.-P.; Oh, S.-J.; Cho, E.; Kwon, S.-H. Synthesis of Highly Dispersed Pt Nanoparticles into Carbon Supports by Fluidized Bed Reactor Atomic Layer Deposition to Boost PEMFC Performance. NPG Asia Mater. 2020, 12, 40. [Google Scholar] [CrossRef]
  41. Wang, J.X.; Inada, H.; Wu, L.; Zhu, Y.; Choi, Y.; Liu, P.; Zhou, W.-P.; Adzic, R.R. Oxygen Reduction on Well-Defined Core−Shell Nanocatalysts: Particle Size, Facet, and Pt Shell Thickness Effects. J. Am. Chem. Soc. 2009, 131, 17298–17302. [Google Scholar] [CrossRef] [PubMed]
  42. Balint, L.-C.; Hulka, I.; Kellenberger, A. Pencil Graphite Electrodes Decorated with Platinum Nanoparticles as Efficient Electrocatalysts for Hydrogen Evolution Reaction. Materials 2021, 15, 73. [Google Scholar] [CrossRef] [PubMed]
  43. Yang, J.; Kim, S.H.; Kwak, S.K.; Song, H.-K. Curvature-Induced Metal–Support Interaction of an Islands-by-Islands Composite of Platinum Catalyst and Carbon Nano-Onion for Durable Oxygen Reduction. ACS Appl. Mater. Interfaces 2017, 9, 23302–23308. [Google Scholar] [CrossRef] [PubMed]
  44. Domínguez-Domínguez, S.; Arias-Pardilla, J.; Berenguer-Murcia, Á.; Morallón, E.; Cazorla-Amorós, D. Electrochemical Deposition of Platinum Nanoparticles on Different Carbon Supports and Conducting Polymers. J. Appl. Electrochem. 2008, 38, 259–268. [Google Scholar] [CrossRef] [Green Version]
  45. Lin, L.; Miao, N.; Wallace, G.G.; Chen, J.; Allwood, D.A. Engineering Carbon Materials for Electrochemical Oxygen Reduction Reactions. Adv. Energy Mater. 2021, 11, 2100695. [Google Scholar] [CrossRef]
  46. Saipanya, S.; Sarakonsri, T.; Wongtap, P. Electrochemical Deposition of Precious Metal on Carbon Nanotube for Methanol Oxidation. Mater. Res. Bull. 2012, 47, 2765–2766. [Google Scholar] [CrossRef]
  47. Kariuki, J.K. An Electrochemical and Spectroscopic Characterization of Pencil Graphite Electrodes. J. Electrochem. Soc. 2012, 159, H747–H751. [Google Scholar] [CrossRef]
  48. Torrinha, Á.; Amorim, C.G.; Montenegro, M.C.B.S.M.; Araújo, A.N. Biosensing Based on Pencil Graphite Electrodes. Talanta 2018, 190, 235–247. [Google Scholar] [CrossRef]
  49. de Lima, L.F.; Ferreira, A.L.; Torres, M.D.T.; de Araujo, W.R.; de la Fuente-Nunez, C. Minute-Scale Detection of SARS-CoV-2 Using a Low-Cost Biosensor Composed of Pencil Graphite Electrodes. Proc. Natl. Acad. Sci. USA 2021, 118, e2106724118. [Google Scholar] [CrossRef] [PubMed]
  50. Aiassa, S.; Yilmaz, S.; Carrara, S.; Demarchi, D. Pencil Graphite Needle-Shaped Biosensor for Anaesthetic Monitoring in Human Serum. In Proceedings of the 2020 IEEE SENSORS, Rotterdam, The Netherlands, 25–28 October 2020; IEEE: Piscataway, NJ, USA, 2020; pp. 1–4. [Google Scholar]
  51. Akanda, M.d.R.; Sohail, M.; Aziz, M.d.A.; Kawde, A.-N. Recent Advances in Nanomaterial-Modified Pencil Graphite Electrodes for Electroanalysis. Electroanalysis 2016, 28, 408–424. [Google Scholar] [CrossRef]
  52. McCreery, R.L. Advanced Carbon Electrode Materials for Molecular Electrochemistry. Chem. Rev. 2008, 108, 2646–2687. [Google Scholar] [CrossRef] [PubMed]
  53. David, I.G.; Popa, D.-E.; Buleandra, M. Pencil Graphite Electrodes: A Versatile Tool in Electroanalysis. J. Anal. Methods Chem. 2017, 2017, 1905968. [Google Scholar] [CrossRef] [Green Version]
  54. Tavares, P.H.C.P.; Barbeira, P.J.S. Influence of Pencil Lead Hardness on Voltammetric Response of Graphite Reinforcement Carbon Electrodes. J. Appl. Electrochem. 2008, 38, 827–832. [Google Scholar] [CrossRef]
  55. McKelvey, K.; Nadappuram, B.P.; Actis, P.; Takahashi, Y.; Korchev, Y.E.; Matsue, T.; Robinson, C.; Unwin, P.R. Fabrication, Characterization, and Functionalization of Dual Carbon Electrodes as Probes for Scanning Electrochemical Microscopy (SECM). Anal. Chem. 2013, 85, 7519–7526. [Google Scholar] [CrossRef]
  56. Lourenço, C.F.; Caetano, M.; Ledo, A.; Barbosa, R.M. Platinized Carbon Fiber-Based Glucose Microbiosensor Designed for Metabolic Studies in Brain Slices. Bioelectrochemistry 2019, 130, 107325. [Google Scholar] [CrossRef]
  57. Dias, C.; Fernandes, E.; Barbosa, R.M.; Ledo, A. A Platinized Carbon Fiber Microelectrode-Based Oxidase Biosensor for Amperometric Monitoring of Lactate in Brain Slices. Sensors 2022, 22, 7011. [Google Scholar] [CrossRef]
  58. Fernandes, E.; Ledo, A.; Barbosa, R.M. Design and Evaluation of a Lactate Microbiosensor: Toward Multianalyte Monitoring of Neurometabolic Markers In Vivo in the Brain. Molecules 2022, 27, 514. [Google Scholar] [CrossRef]
  59. Calia, G.; Rocchitta, G.; Migheli, R.; Puggioni, G.; Spissu, Y.; Bazzu, G.; Mazzarello, V.; Lowry, J.; O’Neill, R.; Desole, M.; et al. Biotelemetric Monitoring of Brain Neurochemistry in Conscious Rats Using Microsensors and Biosensors. Sensors 2009, 9, 2511–2523. [Google Scholar] [CrossRef] [PubMed]
  60. Rocchitta, G.; Secchi, O.; Alvau, M.D.; Farina, D.; Bazzu, G.; Calia, G.; Migheli, R.; Desole, M.S.; O’Neill, R.D.; Serra, P.A. Simultaneous Telemetric Monitoring of Brain Glucose and Lactate and Motion in Freely Moving Rats. Anal. Chem. 2013, 85, 10282–10288. [Google Scholar] [CrossRef]
  61. Barberis, A.; Garbetta, A.; Cardinali, A.; Bazzu, G.; D’Antuono, I.; Rocchitta, G.; Fadda, A.; Linsalata, V.; D’Hallewin, G.; Serra, P.A.; et al. Real-Time Monitoring of Glucose and Phenols Intestinal Absorption through an Integrated Caco-2TC7cells/Biosensors Telemetric Device: Hypoglycemic Effect of Fruit Phytochemicals. Biosens. Bioelectron. 2017, 88, 159–166. [Google Scholar] [CrossRef]
  62. Kirwan, S.; Rocchitta, G.; McMahon, C.; Craig, J.; Killoran, S.; O’Brien, K.; Serra, P.; Lowry, J.; O’Neill, R. Modifications of Poly(o-Phenylenediamine) Permselective Layer on Pt-Ir for Biosensor Application in Neurochemical Monitoring. Sensors 2007, 7, 420–437. [Google Scholar] [CrossRef] [Green Version]
  63. McMahon, C.P.; Rocchitta, G.; Serra, P.A.; Kirwan, S.M.; Lowry, J.P.; O’Neill, R.D. Control of the Oxygen Dependence of an Implantable Polymer/Enzyme Composite Biosensor for Glutamate. Anal. Chem. 2006, 78, 2352–2359. [Google Scholar] [CrossRef] [PubMed] [Green Version]
  64. Puggioni, G.; Calia, G.; Arrigo, P.; Bacciu, A.; Bazzu, G.; Migheli, R.; Fancello, S.; Serra, P.; Rocchitta, G. Low-Temperature Storage Improves the Over-Time Stability of Implantable Glucose and Lactate Biosensors. Sensors 2019, 19, 422. [Google Scholar] [CrossRef] [PubMed] [Green Version]
  65. Fois, M.; Arrigo, P.; Bacciu, A.; Monti, P.; Marceddu, S.; Rocchitta, G.; Serra, P.A. The Presence of Polysaccharides, Glycerol, and Polyethyleneimine in Hydrogel Enhances the Performance of the Glucose Biosensor. Biosensors 2019, 9, 95. [Google Scholar] [CrossRef] [PubMed] [Green Version]
  66. Tujunen, N.; Kaivosoja, E.; Protopopova, V.; Valle-Delgado, J.J.; Österberg, M.; Koskinen, J.; Laurila, T. Electrochemical Detection of Hydrogen Peroxide on Platinum-Containing Tetrahedral Amorphous Carbon Sensors and Evaluation of Their Biofouling Properties. Mater. Sci. Eng. C 2015, 55, 70–78. [Google Scholar] [CrossRef] [Green Version]
  67. Bacciu, A.; Arrigo, P.; Delogu, G.; Marceddu, S.; Monti, P.; Rocchitta, G.; Serra, P.A. A New Perspective on Using Glycols in Glutamate Biosensor Design: From Stabilizing Agents to a New Containment Net. Chemosensors 2020, 8, 23. [Google Scholar] [CrossRef] [Green Version]
  68. Monti, P.; Rocchitta, G.; Marceddu, S.; Dettori, M.A.; Fabbri, D.; Jaoua, S.; Migheli, Q.; Delogu, G.; Serra, P.A. Use of β-Cyclodextrin as Enhancer of Ascorbic Acid Rejection in Permselective Films for Amperometric Biosensor Applications. Talanta 2018, 186, 53–59. [Google Scholar] [CrossRef] [PubMed]
  69. Meng, Q.H.; Irwin, W.C.; Fesser, J.; Massey, K.L. Interference of Ascorbic Acid with Chemical Analytes. Ann. Clin. Biochem. 2005, 42, 475–477. [Google Scholar] [CrossRef] [PubMed] [Green Version]
  70. Takeda, K.; Kusuoka, R.; Inukai, M.; Igarashi, K.; Ohno, H.; Nakamura, N. An Amperometric Biosensor of L-Fucose in Urine for the First Screening Test of Cancer. Biosens. Bioelectron. 2021, 174, 112831. [Google Scholar] [CrossRef] [PubMed]
  71. Buleandră, M.; Popa, D.E.; David, I.G.; Ciucu, A.A. A Simple and Efficient Cyclic Square Wave Voltammetric Method for Simultaneous Determination of Epinephrine and Norepinephrine Using an Activated Pencil Graphite Electrode. Microchem. J. 2021, 160, 105621. [Google Scholar] [CrossRef]
  72. Annu; Sharma, S.; Jain, R.; Raja, A.N. Review—Pencil Graphite Electrode: An Emerging Sensing Material. J. Electrochem. Soc. 2020, 167, 037501. [Google Scholar] [CrossRef]
  73. Lisboa, T.P.; de Cássia Moreira, B.; Cunha de Souza, C.; Veríssimo de Oliveira, W.B.; Costa Matos, M.A.; Matos, R.C. A Pencil Graphite-Based Disposable Device for Electrochemical Monitoring of Sulfanilamide in Honey and Water Samples. Anal. Methods 2022, 14, 3867–3874. [Google Scholar] [CrossRef]
  74. Purushothama, H.T.; Nayaka, Y.A.; Vinay, M.M.; Manjunatha, P.; Yathisha, R.O.; Basavarajappa, K.V. Pencil Graphite Electrode as an Electrochemical Sensor for the Voltammetric Determination of Chlorpromazine. J. Sci. Adv. Mater. Devices 2018, 3, 161–166. [Google Scholar] [CrossRef]
  75. Bermingham, K.P.; Doran, M.M.; Bolger, F.B.; Lowry, J.P. Design Optimisation and Characterisation of an Amperometric Glutamate Oxidase-Based Composite Biosensor for Neurotransmitter l-Glutamic Acid. Anal. Chim. Acta 2022, 1224, 340205. [Google Scholar] [CrossRef]
  76. Baker, K.L.; Bolger, F.B.; Doran, M.M.; Lowry, J.P. Characterisation of a Platinum-Based Electrochemical Biosensor for Real-Time Neurochemical Analysis of Choline. Electroanalysis 2019, 31, 129–136. [Google Scholar] [CrossRef] [Green Version]
  77. Finnerty, N.J.; Bolger, F.B. In Vitro Development and in Vivo Application of a Platinum-Based Electrochemical Device for Continuous Measurements of Peripheral Tissue Oxygen. Bioelectrochemistry 2018, 119, 124–135. [Google Scholar] [CrossRef]
  78. Calia, G.; Monti, P.; Marceddu, S.; Dettori, M.A.; Fabbri, D.; Jaoua, S.; O’Neill, R.D.; Serra, P.A.; Delogu, G.; Migheli, Q. Electropolymerized Phenol Derivatives as Permselective Polymers for Biosensor Applications. Analyst 2015, 140, 3607–3615. [Google Scholar] [CrossRef]
  79. Maioli, M.; Basoli, V.; Carta, P.; Fabbri, D.; Dettori, M.A.; Cruciani, S.; Serra, P.A.; Delogu, G. Synthesis of Magnolol and Honokiol Derivatives and Their Effect against Hepatocarcinoma Cells. PLoS ONE 2018, 13, e0192178. [Google Scholar] [CrossRef] [Green Version]
  80. Pyeshkova, V.M.; Dudchenko, O.Y.; Soldatkin, O.O.; Alekseev, S.A.; Seker, T.; Kurc, B.A.; Dzyadevych, S.V. Development of Three-Enzyme Lactose Amperometric Biosensor Modified by Nanosized Poly (Meta-Phenylenediamine) Film. Appl. Nanosci. 2022, 12, 1267–1274. [Google Scholar] [CrossRef]
  81. Zhou, D.-M.; Dai, Y.-Q.; Shiu, K.-K. Poly(Phenylenediamine) Film for the Construction of Glucose Biosensors Based on Platinized Glassy Carbon Electrode. J. Appl. Electrochem. 2010, 40, 1997–2003. [Google Scholar] [CrossRef]
Figure 1. Scheme of the construction of the sensors obtained from the carbon-composition resistors (CCRs). A: schematic representation of the resistor; the rheophores are connected by a conductive carbonaceous composite enclosed within an insulating jacket; B: carbon disk (1.25 mm Ø) obtained by cutting the resistor in a half, the insulating plastic sheath is in yellow; C: carbon disk platinized via CV or via CPA.
Chemosensors 11 00153 g001
Figure 2. Scheme of the construction of the sensors obtained from pencil leads (PLs) platinized by means of CV technique. A: complete scheme of the sensor; B: carbon disk (0.3 mm Ø) obtained by inserting the PL in the micropipette tip; C: carbon disk platinized via CV best protocol.
Chemosensors 11 00153 g002
Figure 3. HP slopes, expressed as nA/µM ± SEM, resulting from CV protocols on CCRs after 2 consecutive cycles series, with HP and AA calibrations after each series, using 10 mM (panel (A)) or 20 mM (panel (B)) deoxygenated (a) and no deoxygenated (b) HA solution. n = 4; *: p < 0.001 vs. on respective bare C. #: p < 0.001 vs. a.
Chemosensors 11 00153 g003
Figure 4. HP slopes, expressed as nA/µM ± SEM, obtained from 2 + 2 + 2 CV cycles (without HP and AA calibration between the series) (Panel (A)) and CPA (Panel (B)), both on CCRs, using different HA solutions: 1: on bare C; 2: HA 10 mM deoxygenated, 3: HA 20 mM deoxygenated, 4: HA 10 mM no-deoxygenated, 5: HA 20 mM no-deoxygenated. * p < 0.001 vs. on bare C.
Chemosensors 11 00153 g004
Figure 5. HP (Panel (A)) and AA (Panel (B)) monitoring on different diameter pencil leads (0.3, 0.5 2.0 mm). Slopes are given as nA/µM ± SEM; n = 4; * p < 0.001 vs. bare C.
Chemosensors 11 00153 g005
Figure 6. Scanning electron micrographs of control CCR (Panel (A), 76× of magnification) and platinized CCR (Panel (B), 66× of magnification).
Chemosensors 11 00153 g006
Figure 7. Scanning electron micrographs (100× magnification) of control PL (Panel (A)) and platinized PL (Panel (B)).
Chemosensors 11 00153 g007
Figure 8. Scanning electron micrographs of control platinized CCR surface (Panel (A), 1800× magnification) and platinized PL surface (Panel (B), 500× magnification).
Chemosensors 11 00153 g008
Figure 9. Representative plot of glucose biosensor Cplat/PPD/[PEI(1%) − GOx]5/PU(0.1%). The non-linear fitting of data (Panel (A)) was performed in the range 0–140 mM of concentrations of glucose. Meanwhile, the linear fitting of data (Panel (B)) was performed in the 0–0.6 mM range. Data were obtained from Day 1 (red plot) and Day 2 (blue plot) calibrations. Cplat: platinized bare carbon; PPD: poly-orthophenylenediamine polymer; PEI: polyetileneimmine; GOx: glucose oxidase; PU: polyurethane. The subscript number indicates the number of layers of the biosensor component.
Chemosensors 11 00153 g009
Disclaimer/Publisher’s Note: The statements, opinions and data contained in all publications are solely those of the individual author(s) and contributor(s) and not of MDPI and/or the editor(s). MDPI and/or the editor(s) disclaim responsibility for any injury to people or property resulting from any ideas, methods, instructions or products referred to in the content.

