Robustness Study of Electro-Nuclear Scenario under Disruption
by
 , , and
Jiali Liang
1,* ,
,
Marc Ernoult
1,*,
Xavier Doligez
1,
Sylvain David
1,
Léa Tillard
2 and
Nicolas Thiollière
3 1
IJCLab, Université Paris-Saclay, CNRS/IN2P3, 91405 Orsay, France
2
Laboratoire de Neutronique, Institut de Radioprotection et de Sûreté Nucléaire, 92262 Fontenay-aux-Roses CEDEX, France
3
Subatech, Université de Nantes, IMTA, CNRS/IN2P3, 44307 Nantes, France
*
Authors to whom correspondence should be addressed.
J. Nucl. Eng. 2021, 2(1), 1-8; https://doi.org/10.3390/jne2010001
Submission received: 29 September 2020
/
Revised: 11 January 2021
/
Accepted: 12 January 2021
/
Published: 28 January 2021
(This article belongs to the Special Issue Selected Papers from PHYSOR 2020)
Abstract
:As the future of nuclear power is uncertain, only choosing one development objective for the coming decades can be risky; while trying to achieve several possible objectives at the same time may lead to a deadlock due to contradiction among them. In this work, we study a simple scenario to illustrate the newly developed method of robustness study, which considers possible change of objectives. Starting from the current French fleet, two objectives are considered regarding the possible political choices for the future of nuclear power: A. Complete substitution of Pressurized Water Reactors by Sodium-cooled Fast Reactors in 2180; B. Minimization of all potential nuclear wastes without SFR deployment in 2180. To study the robustness of strategies, the disruption of objective is considered: the objective to be pursued is possibly changed abruptly from A into B at unknown time. To minimize the consequence of such uncertainty, the first option is to identify a robust static strategy, which shows the best performance for both objectives A and B in the predisruption situation. The second option is to adapt a trajectory which pursues initially objective A, for objective B in case of the disruption. To identify and to analyze the adaptively robust strategies, outcomes of possible adaptations upon a given trajectory are compared with the robust static optimum. The temporality of adaptive robustness is analyzed by investigating different adaptation times.
1. Introduction
In electro-nuclear scenario studies, specific strategies for a given objective of nuclear power development are identified by simulating several or a large set of trajectories. A trajectory denotes a single path of the future, characterized by a given set of fuel cycle parameters. In these studies, reactors which are not yet deployed can be simulated as well, e.g., fast reactors. The GEN IV fast reactor is regarded as a promising technology for future nuclear power development, which shows a capacity to burn transuranic inventories (TRU) [1] and lightening the stress on uranium [2]. In France, the ASTRID reactor, a design based on the sodium-cooled fast reactor (SFR), may be considered to be deployed in the future, using plutonium as the main fissile component [3]. If SFR deployment is considered to be the objective for the future development of nuclear power, current inventories of plutonium in interim storages are potential resources. However, several delays to the schedule of the ASTRID program show an uncertainty of SFRs deployment [4]. If SFRs are not deployed, plutonium may become a potential waste, which should be introduced into new-designed fuels to be burned in pressurized-water reactors (PWRs) [5,6] or vitrified as wastes. More precisely, all TRU may be then considered potential wastes to be minimized.
For these two incompatible situations with respect to different objectives, strategies to be executed are intuitively diverse. Given that there is no definite way to know which situation will occur, these two possibilities should be considered in electro-nuclear scenario studies. In this work, a method is developed to study the robustness of possible strategies under the disruption of objective. In Section 2, the important concepts in this work such as static and adaptive robustness, as well as the assessment method is presented. In Section 3, a predisruption scenario is studied, which presents possible strategies when the objective is deeply uncertain. The robust static strategy identified in this scenario is analyzed in Section 4. In consideration of information updating of objective decision, adaptive strategies in a postdisruption scenario are explored in Section 5. Finally, the temporality of adaptation is investigated in Section 6.
2. Robustness and Relevant Assessment
2.1. Objectives and Outputs of Interest
If SFRs are to be deployed, a fleet only composed of SFRs can be considered [2]. This will need sufficient available plutonium. Otherwise, the minimization of TRU in cycle can be the primary objective, possibly linked to a limited development of nuclear power, or even to a phase-out. With respect to different perspectives, two objectives and their outputs of interest are defined:
- A. Complete substitution of the existing fleet composed of PWRs by SFRs, as preselected objective: substitution ratio is required to be between 1 and 2.
- B. Minimization of TRU in cycle (TRU includes Np, Pu, Am and Cm in this study), possibly under a limited deployment of nuclear power.
The mentioned above is defined as
No SFR is simulated in this work, and the ”Max deployable power by SFRs” is supposed to only depend on the available in-cycle Pu inventory. The specific power of SFR MW/tHM respects the model employed in [7]; 17% of initial heavy metal is supposed to be plutonium [8]. The necessary Pu inventory to start a SFR deduced from these assumptions should be multiplied by 2 in consideration of the temporality and availability of Pu in the closed and self-sustainable cycle of SFRs, assuming five years of cooling for spent fuel (SF) after discharge and two years of fabrication for fresh fuel. All these simplifications imply the maximal deployable power of SFRs with a given inventory of Pu; but they may also lead to a bias on the estimation of needed Pu inventory, and therefore a bias on . The choice of can result in the failure of the complete substitution (objective A). To reduce the risk, margin should be taken into account, and thus an reasonably larger than 1 is required. For objective B, the in-cycle excludes those in vitrified wastes, which result from the reprocessing of UOX SF for the preparation of MOX fuel fabrication.
In brief, objective A is related to the future deployment of SFR, while the objective B is linked to giving up fast reactors, possibly in a situation of phase-out. It neither means that the TRU cannot be minimized for SFR deployment, nor that the TRU minimization is the only objective if SFR is not deployed. In this study, objectives A and B are just supposed as an example with respect to different future states, in order to reduce the complexity but keep the generality of analysis.
2.2. Disruption and Robustness
Robustness studies analyze the impact of a change of objective within the time scope of a scenario, called the disruption of objective: objective A is firstly chosen, and a specific strategy is implemented to pursue it; however, the SFR deployment may be possibly given up and the objective is then changed into B. Since such a change is deeply uncertain, the objective to be finally pursued is unknown. A robust strategy dedicated to such disruption is therefore needed. Concepts of robustness are introduced from [9] and adapted for the electro-nuclear scenario study in our work:
- Static robustness: a robust static strategy presents acceptable performance for whichever objective is selected in the future. The evolution of parameters of the trajectory is set up at the beginning of scenario. It is equivalent to an optimal static strategy that considers two objectives at once.
- Adaptive robustness: in case of the disruption, the trajectory from a strategy pursuing objective A is adapted for objective B. In this study, an adaptive strategy is considered robust (robust adaptive strategy) if it performs better than the robust static strategy for objective B.
3. Predisruption Scenario
In the predisruption scenario, objective A is preselected, while the disruption to the B is uncertain. Based on the French fleet, the simulation of fuel cycle begins from the year 2015. According to the summary in [6], the history of the fleet before 2015 is simulated as precisely as possible, in order to obtain the material inventories. In this work, the total thermal power of the fleet is simulated and considered to be one of the fuel cycle parameters. From 2015, 58 reactors with 188 GW of total nominal thermal power are grouped into two macroreactors: a PWR UOX and a PWR MOX. The outputs of interest, and in-cycle of the trajectories of explored strategies, are investigated in 2180, a time goal chosen far in the future to keep options as open as possible in our methodology development. To explore possible strategies, a transition of the fleet starts from the time and lasts more than 10 years (D as transition duration). Burn-ups of two fuels ( and ), the cooling time of UOX SF () in the pool, and the management of plutonium for MOX fuel fabrication () change at . The total power and the MOX fraction (power fraction contributed by the MOX fuel) change linearly during the transition; after the transition, they will keep constant as and . In summary, eight variables listed in Table 1 create the space of strategies in this exploratory predisruption scenario. The range [175, 200] GW of supposes the stable evolution of total power. The objective of SFR deployment will not lead to phase-out state; but the total power can be influenced by many factors, such as energy demand and political decision. To focus on the disruption of objective, the power is supposed to be relatively stable in this step.
4. Static Robustness
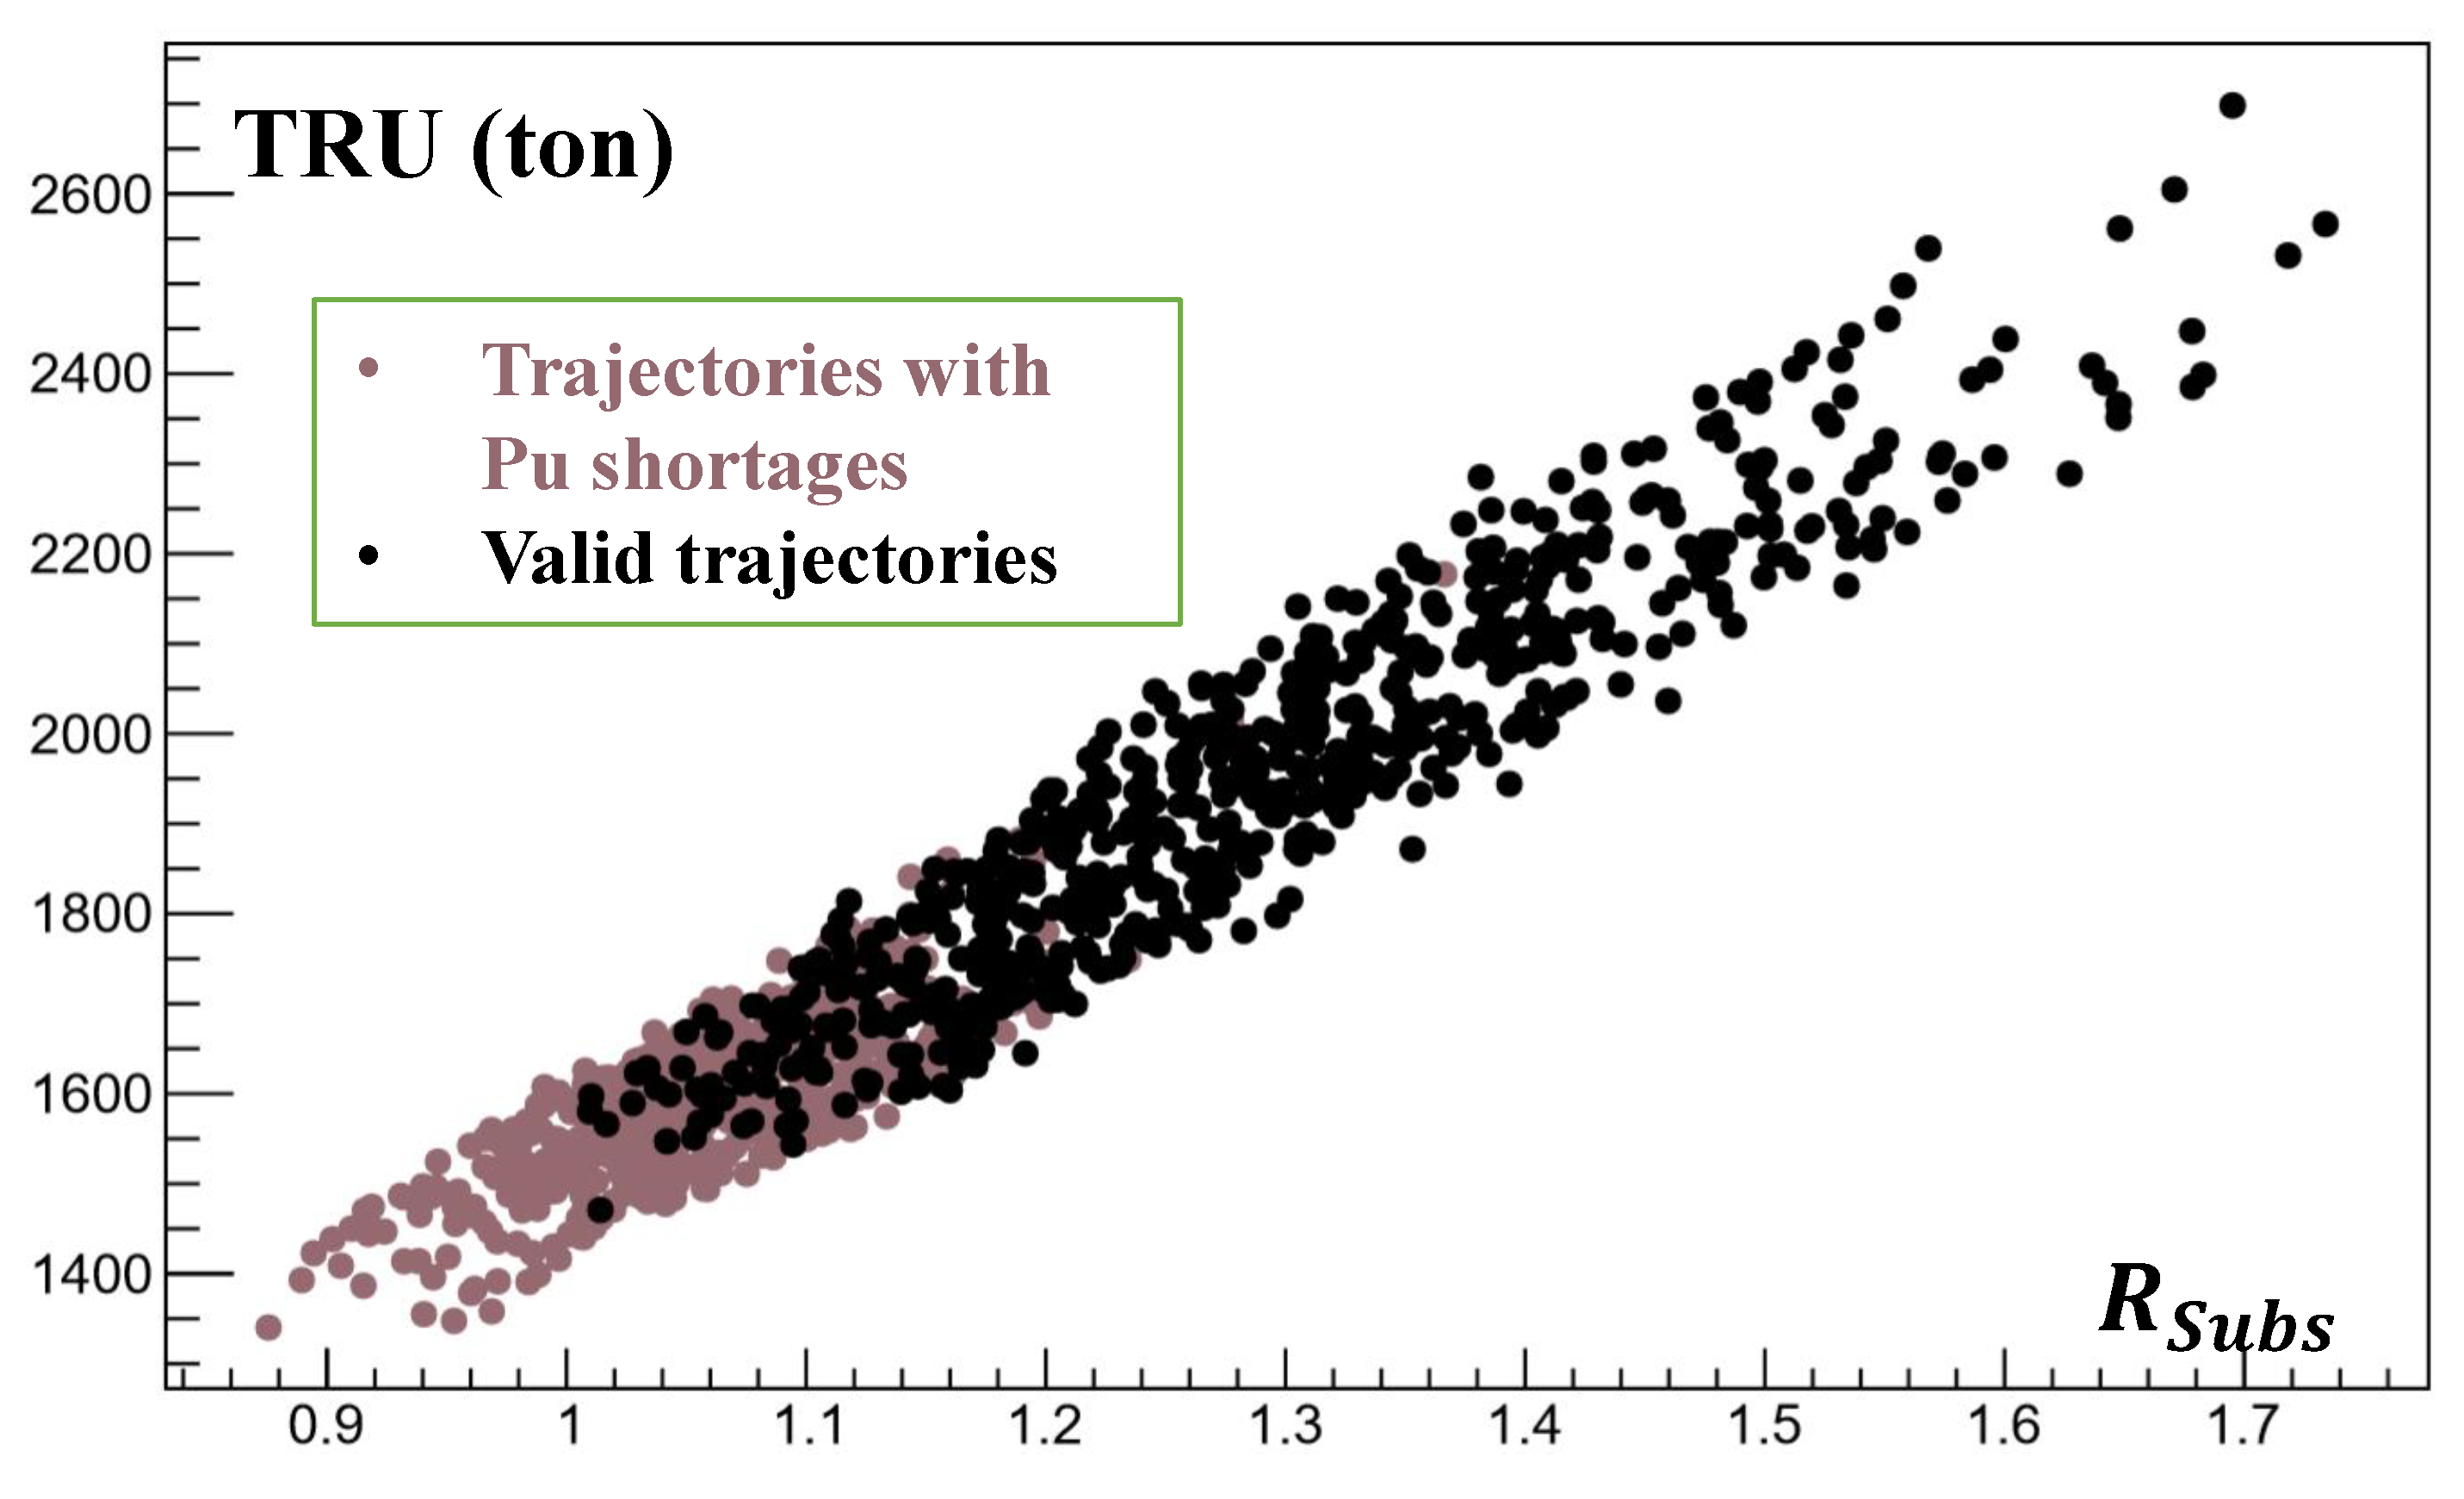
and in-cycle in 2180 of trajectories in the predisruption scenario are presented in Figure 1. Brown points denote the trajectories with Pu shortages for MOX fuel fabrication before 2180. The Pu shortage is well studied in [12]. In this work, the trajectories with Pu shortages are considered invalid. Figure 1 shows that all valid strategies can theoretically achieve objective A ( between 1 and 2), while they result in a wide range of TRU production.
By definition aforementioned, a robust static strategy should minimize with a between 1 and 2. It can be identified in Figure 1. Parameters and outputs of interest of this strategy are shown in Table 2, using the same units as in Table 1. The trajectory of this robust static strategy has sufficient available in-cycle inventory of Pu for complete SFR deployment in 2180, presenting a relatively low margin of 1% (); the final in-cycle inventory of TRU is about 1470 tons.
5. Adaptation and Adaptive Robustness
In consideration of information updating, a trajectory that pursues the preselected objective A can be adapted for the new objective B in case of disruption. The performance of adaptation may depend on the time of disruption and the trajectory to be adapted. First, the adaptation in 2070 is supposed, which means that the disruption is before 2070. A representative trajectory pursuing objective A should be chosen for the subsequent adaptation analysis.
5.1. Representative Trajectory to Be Adapted and the Corresponding Scenario of Adaptation
A trajectory to be adapted is selected among the ones achieving objective A () in the predisruption scenario. To be representative, its inputs and outputs are around the average values of those valid ones, listed in Table 2. In 2070, the transition of this representative trajectory is not yet finished, and the total power and the MOX fraction are respectively 186 GW and 6.0%. In 2180, this strategy presents a margin of 48% of plutonium availability for objective A.
The adaptive strategies upon the representative trajectory are explored by a new sampling similar to the predisruption scenario. A new transition is supposed from the adaptation time 2070. The new varies in the range of [20, 200] GW, different from the previous range of [175, 200] GW: as the SFR deployment is not considered after disruption, a relatively high as the current level is no longer needed. A wider range is investigated for the minimization of TRU.
5.2. Adaptive Robustness versus Static Robustness
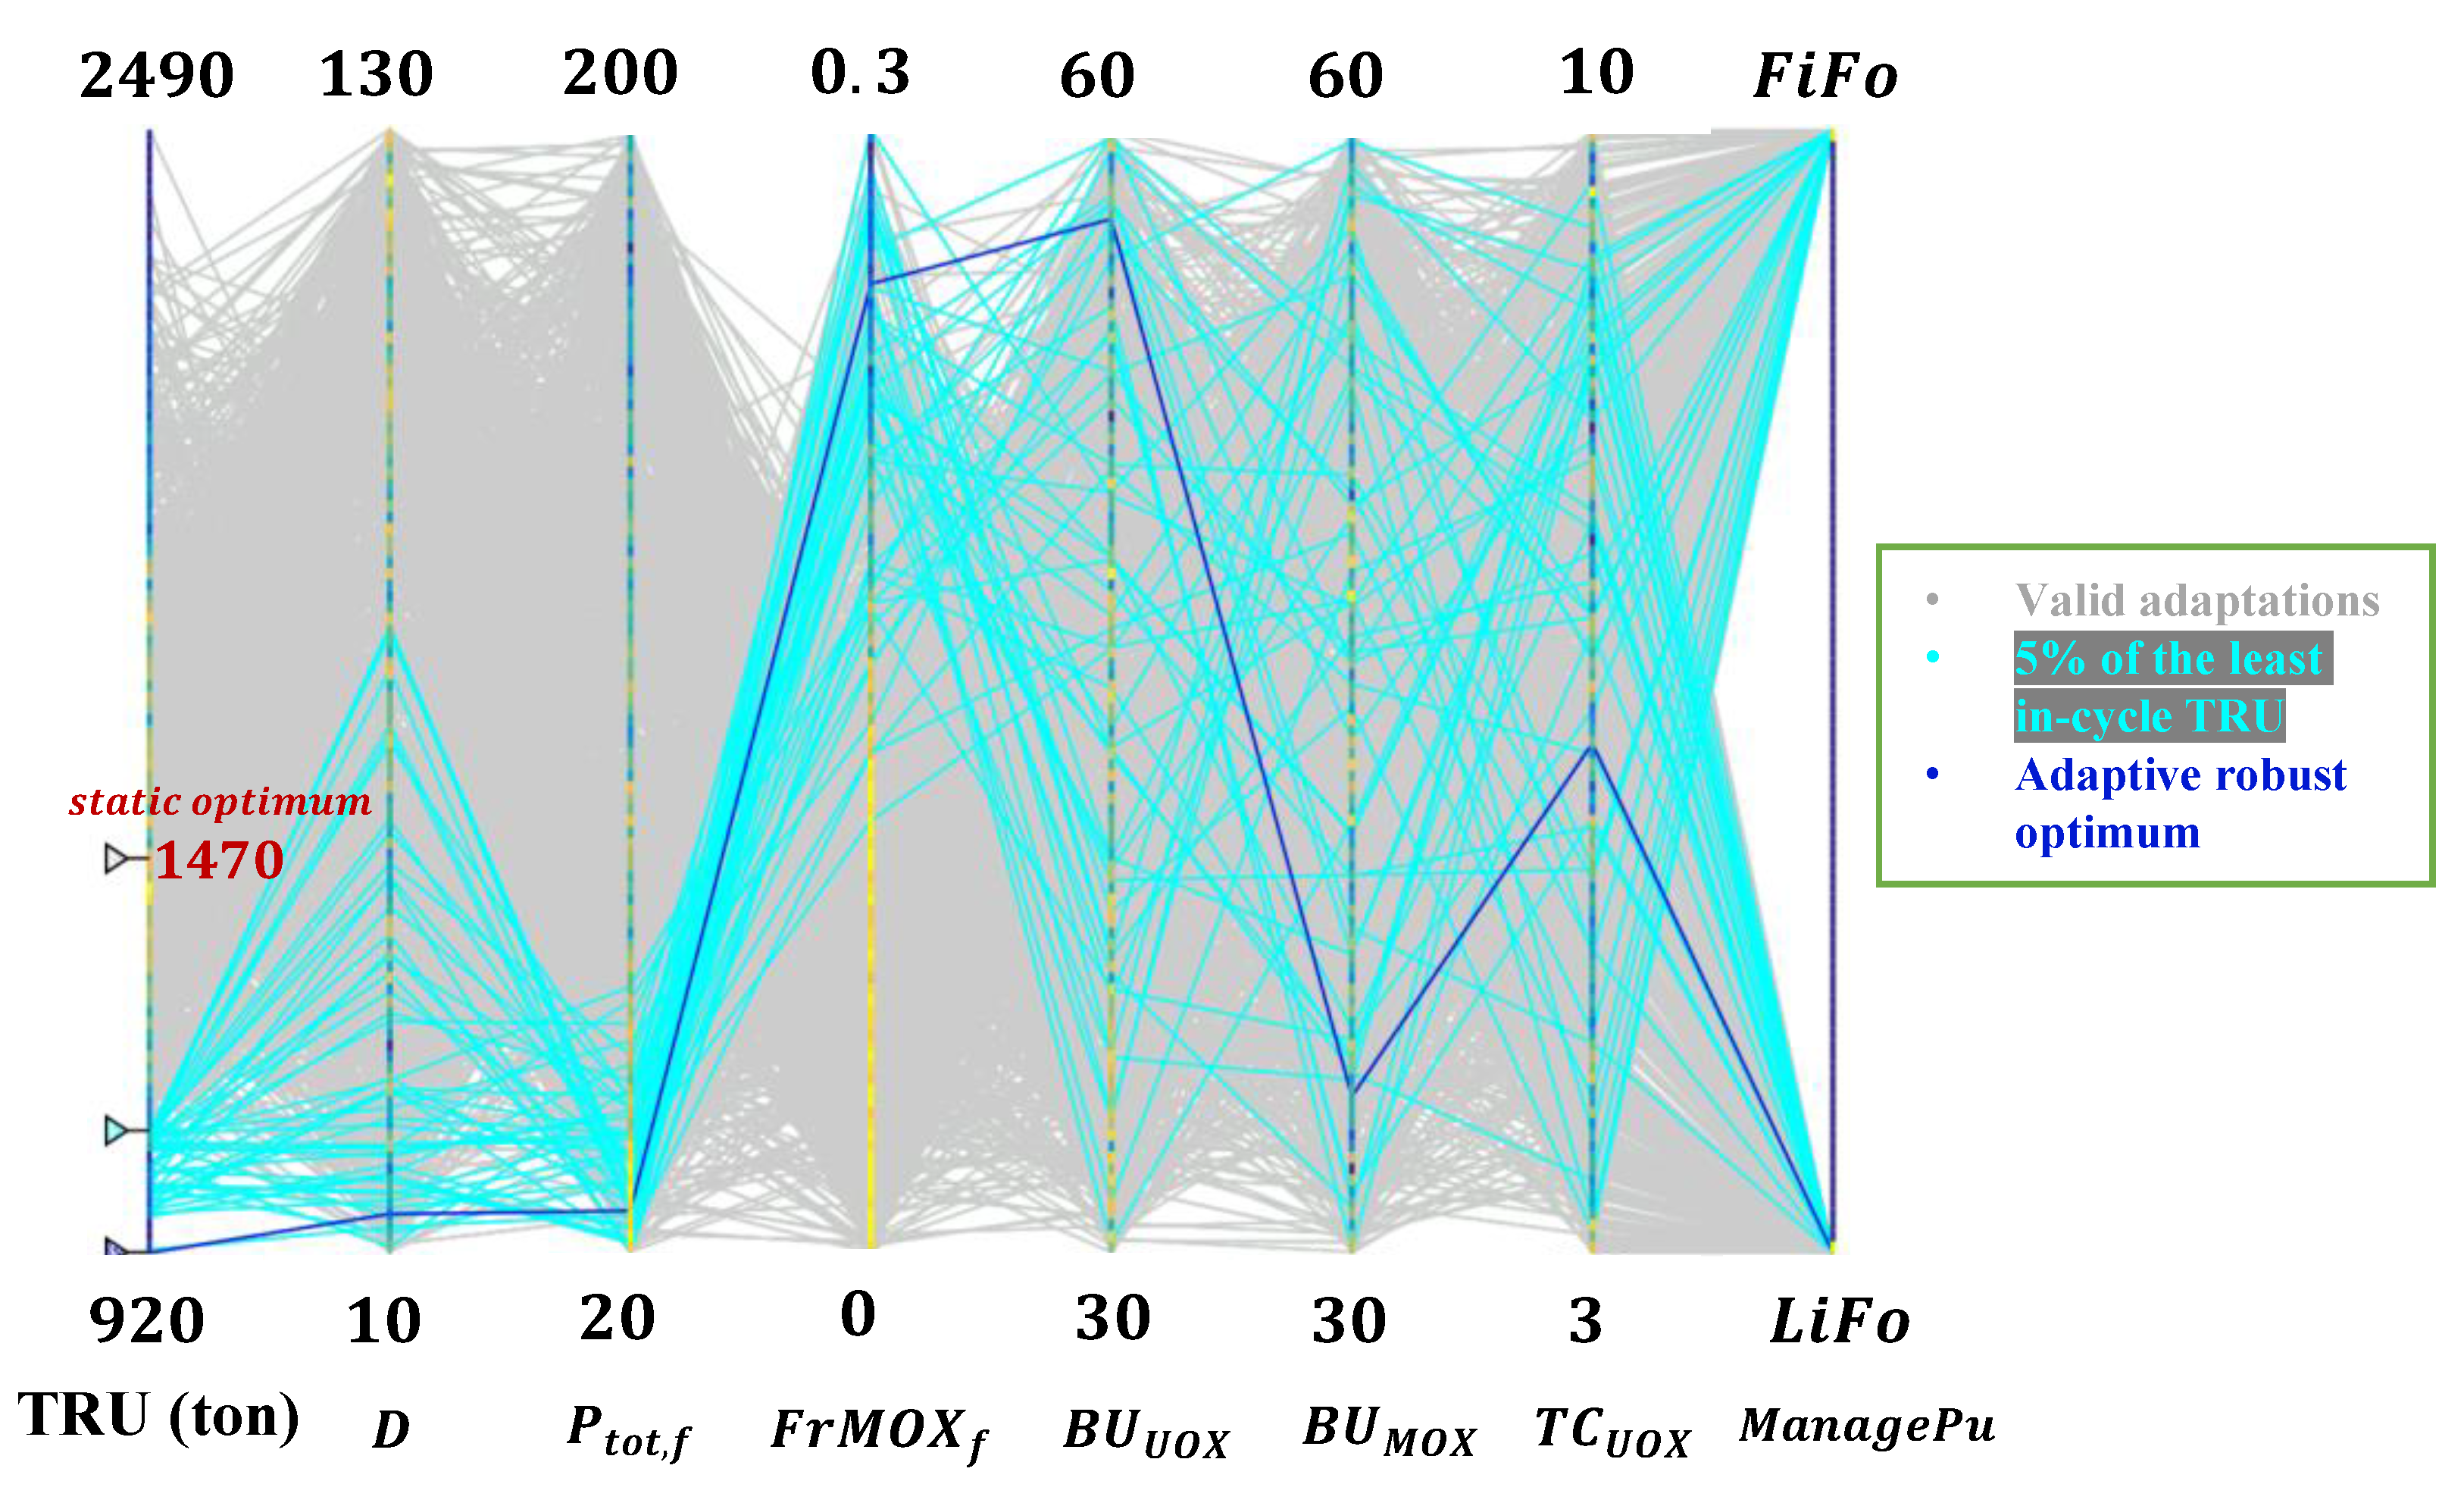
The in-cycle in 2180 and the inputs of adaptive strategies upon the representative trajectory are presented in Figure 2: the connected lines denote the variable values of a strategy and the output in 2180 of the corresponding trajectory. For example, the adaptive optimum, presented by the connected deep blue lines in Figure 2, leads to 920 tons of in 2180; this adaptive strategy suggests 13 years for the duration of adaptive transition (D), 28 GW as final total power , 25% as final MOX fraction , 58 and 34 GWd/t as and respectively, six years for spent UOX cooling and LiFo as Pu management.
The parallel plot of Figure 2 can not only show visually the results of strategies but also present the global behavior of strategies and the relation between inputs and output. Some adaptations, such as the ones in light blue, lead to a inventory in 2180 far lower than 1470 tons of the robust static optimum. By definition, they are adaptively robust. For these strategies, low , high and high are required. In other words, if objective A is firstly pursued by implementing the representative strategy and it is disrupted to B before 2070 (so that we can adapt from 2070), a set of adaptive strategies allows one to achieve lower in-cycle TRU inventory than the optimal static strategy. An appropriate plan of adaptive strategies upon the representative trajectory is therefore adaptively robust.
This result is a-priori not generalize because it depends on several assumptions, such as the variability of power evolution before and after adaptation and the time of adaptation. To determine whether the adaptation is generally a better solution than sticking to an optimal static strategy, different assumptions should be investigated.
6. Adaptation Time Effect
As mentioned in Section 5, adaptation time may impact greatly the adaptive robustness of strategies. An extreme case is an adaptation infinitesimally close to 2180, which will produce a final TRU inventory very close to 2170 tons as the representative trajectory. To investigate the temporality of adaptive robustness, the adaptation upon the representative trajectory is investigated on different adaptation times: 2050, 2090, 2110, 2130 and 2150.
6.1. Behaviors of Good Adaptation over Adaptation Time
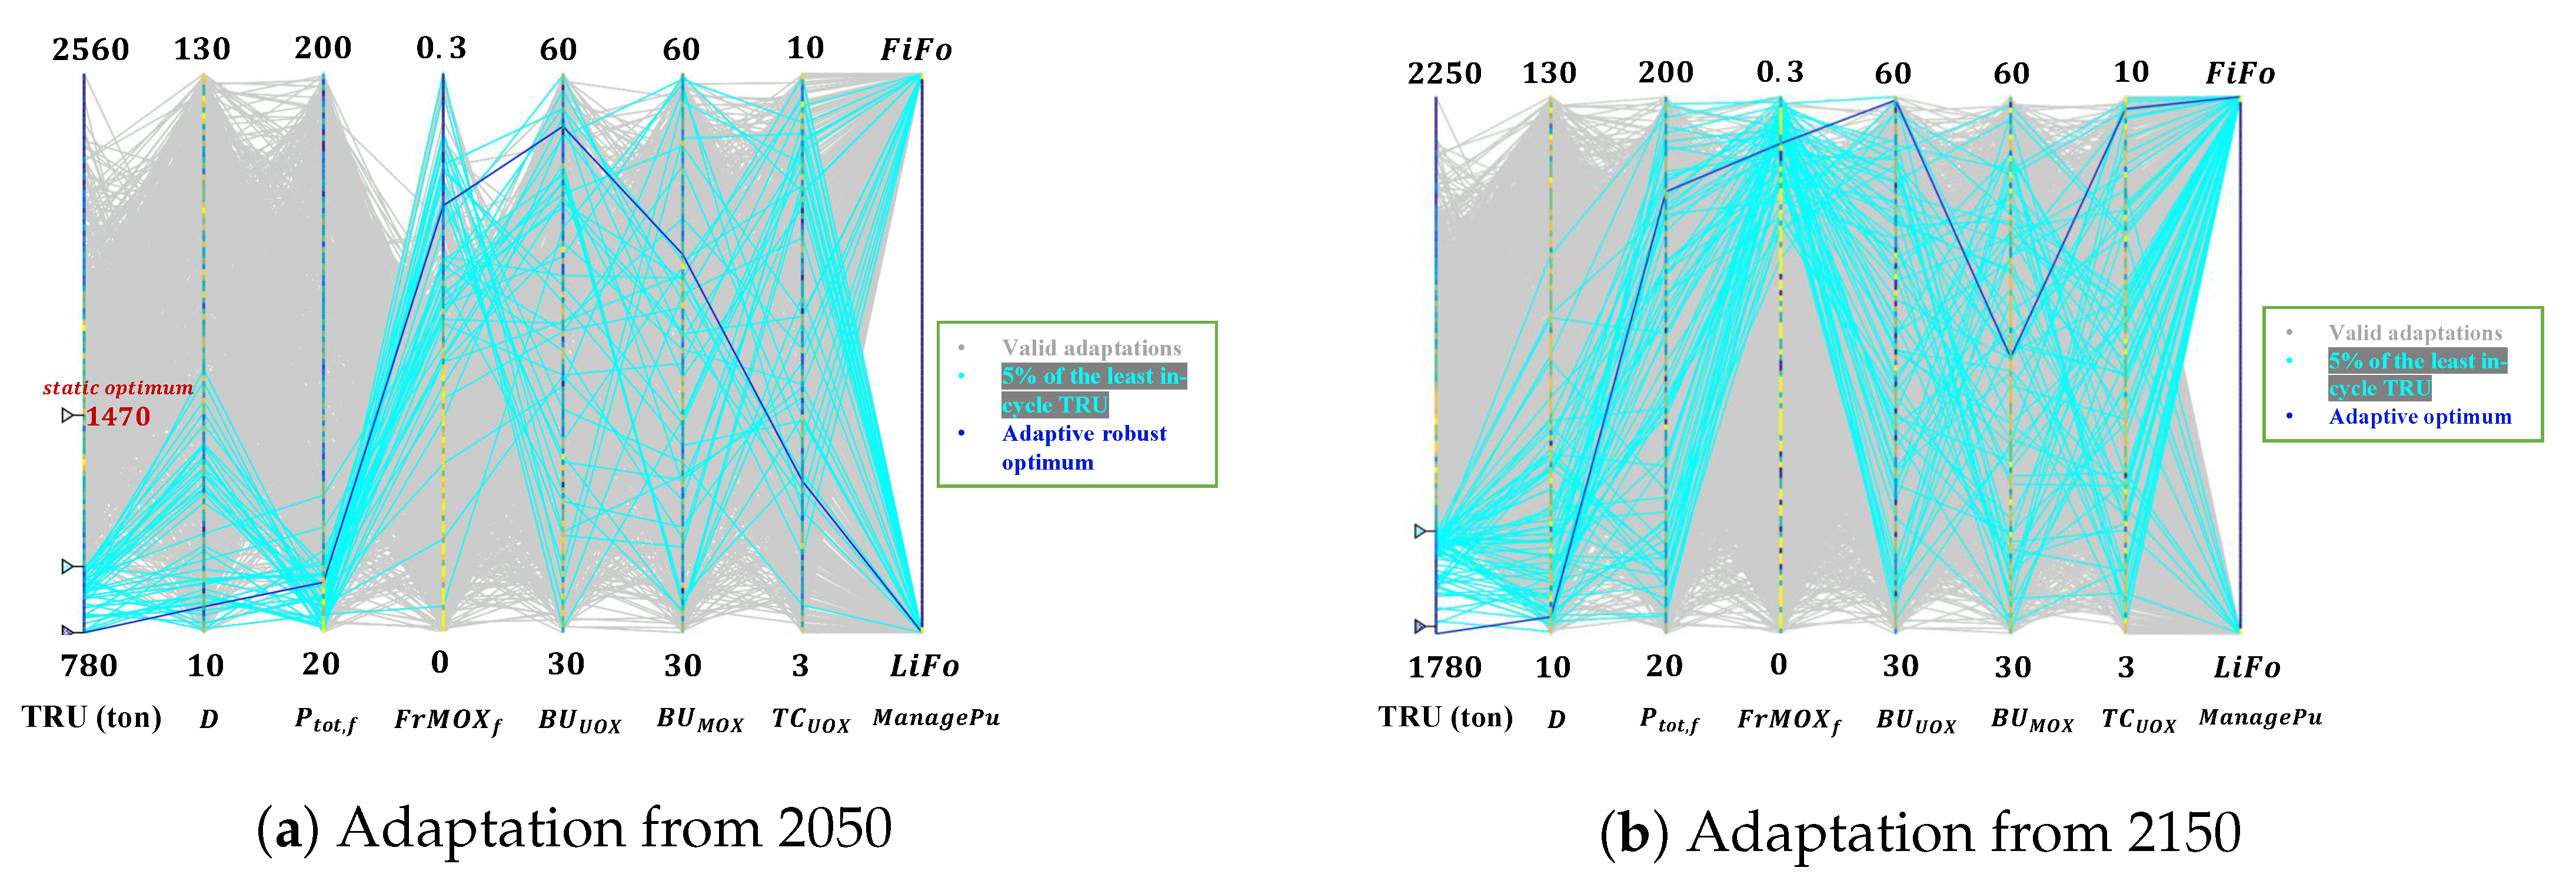
The results of two extreme adaptation times investigated in our study are shown in the parallel plots of Figure 3. All adaptations from 2150 have more in-cycle TRU than the robust static optimum. Thus, no adaptive strategy upon the representative trajectory is robust if it is adapted after 2150.
As shown by light blue curves in Figure 3, strategies with high and high allow the incineration of a large amount and the production of a small quantity of Pu, and thus lead to relatively small inventory TRU in 2180. Effect of on is different in these two cases: if it is adapted late like 2150, high with high can consume rapidly the Pu in the UOX SF. This kind of strategies are not valid for early adaptation like 2050. On one hand, the representative trajectory before disruption tends to accumulate plutonium in UOX SF due to a relatively low , and thus an early adaptation leads to limited availability of Pu to be incinerated with high level of power. On the other hand, the early adaptation is equivalent to a long time scope of adaptation simulation. In this case, the possibility of Pu shortage with high and high is higher than those with shorter time scope of late adaptation.
6.2. Adaptive (Robust) Optimum versus Adaptation Time
The in-cycle inventory of at adaptation time and the ones in 2180 of the adaptive optimum over the adaptation time are shown in Table 3. A threshold of adaptation time for adaptive robustness can be observed between 2110 and 2130. In fact, the final inventory of in-cycle TRU of adaptive optimum is very close to the TRU just before adaptation. It implies that whenever adaptation is, the lowest achievable in-cycle inventories of TRU in 2180 with adaptation are not far from the inventory around the adaptation time. Actually, even though the inventory of Pu accumulated in UOX SF can be hundreds of tons depending on the adaptation time, the incineration by PWR MOX during adaptation is relatively limited. The limited incineration is mainly due to the fact that only monorecycling of plutonium is considered in this study. 2
7. Conclusions and Outlook
In this work, a method of robustness analysis in electro-nuclear scenario study under the disruption of objective is presented. Two incompatible objectives are considered: one is the future deployment of SFR, and the other is the minimisation of TRU without SFR deployment. A robust static optimum is first identified, allowing complete SFR deployment with a margin of 1%, and reaching 1470 tons of in-cycle TRU in 2180.
In comparison with the robust static optimum, a representative trajectory which pursues initially objective A is disrupted and adapted in 2070 for objective B. Some trajectories of adaptive strategies show much lower TRU inventories in 2180 than the robust static optimum and the lowest achievable is about 920 tons. A further study shows that if the representative trajectory is adapted after 2130, no adaptive strategy can be robust. It indicates the temporality needed to be capable to perform better by adaptation than a robust static strategy, under the disruption of objective A to B.
In the future, adaptations on the trajectories characterised by different in the predisruption scenario should be investigated, because a correlation between and can be observed in Figure 1. Besides, the flexibility, which indicates the gain on TRU over different constraints of adaptation, should be studied as well.
Author Contributions
Conceptualization, J.L., M.E. and X.D.; Formal analysis, J.L., M.E. and X.D.; Funding acquisition, N.T.; Investigation, S.D., L.T. and N.T.; Methodology, J.L., M.E., X.D. and N.T.; Project administration, S.D.; Software, J.L.; Supervision, X.D. and S.D.; Writing—original draft, J.L.; Writing—review and editing, M.E., X.D. and L.T. All authors have read and agreed to the published version of the manuscript.
Funding
This research received no external funding.
Data Availability Statement
The data presented in this study are available on request from corresponding author.
Acknowledgments
The authors acknowledge the French Programme NEEDS for its financial support to the project.
Conflicts of Interest
The authors declare no conflict of interest. The funders had no role in the design of the study; in the collection, analyses, or interpretation of data; in the writing of the manuscript, or in the decision to publish the results.
References
- Romanello, V.; Salvatores, M.; Schwenk-Ferrero, A.; Gabrielli, F.; Maschek, W.; Vezzoni, B. Comparative study of fast critical burner reactors and subcritical accelerator driven systems and the impact on transuranics inventory in a regional fuel cycle. Nucl. Eng. Des. 2011, 241, 433–443. [Google Scholar] [CrossRef]
- Malambu, E.; Hyland, B.; Boucher, L.; Carlier, B.; Grouiller, J.P.; Salvatores, M.; Romanello, V.; Schwenk-Ferrero, A.; Monti, S.; Ono, K.; et al. Transition Towards a Sustainable Nuclear Fuel Cycle; Technical Report; OECD-NEA No. 7133; OECD: Paris, France, 2013. [Google Scholar]
- CEA-DEN. 4th Generation Sodium-Cooled Fast Reactors–The Astrid Technological Demonstrator; CEA Corporate publications: Paris, France, 2012. [Google Scholar]
- CNE. Avancées du programme ASTRID. In Le Rapport d’Evaluation No. 10; Commission nationale d’évaluation — Des Recherches et Etudes Relatives à la Gestion des Matières et des Déchets Radioactifs: Paris, France, 2016. [Google Scholar]
- Ernoult, M.; David, S.; Doligez, X.; Meplan, O.; Leniau, B.; Bidaud, A.; Thiolliere, N. Advanced plutonium management in PWR, complementarity of thorium and uranium. Prog. Nucl. Energy 2015, 78, 330–340. [Google Scholar] [CrossRef]
- Courtin, F. Etude de l’Incinération du Plutonium en REP MOX sur Support D’uranium Enrichi Avec le Code de Simulation Dynamique du Cycle CLASS. Ph.D. Thesis, Ecole nationale supérieure Mines-Télécom Atlantique Bretagne Pays de la Loire, Nantes, France, 2017. [Google Scholar]
- Ernoult, M.; Doligez, X.; Thiollière, N.; Zakari-Issoufou, A.A.; Bidaud, A.; Bouneau, S.; Somaini, A. Global and Flexible Models for Sodium-Cooled Fast Reactors in Fuel Cycle Simulations. Ann. Nucl. Energy 2019, 128, 69–76. [Google Scholar] [CrossRef]
- Stauff, N.E.; Kim, T.K.; Taiwo, T.A.; Buiron, L.; Rimpault, G.; Brun, E.; Gulliford, J. Benchmark for Neutronic Analysis of Sodium-cooled Fast Reactor Cores with Various Fuel Types and Core Sizes; Technical Report; Organisation for Economic Co-Operation and Development: Paris, France, 2016. [Google Scholar]
- Walker, W.E.; Lempert, R.J.; Kwakkel, J.H. Deep Uncertainty. In Encyclopedia of Operations Research and Management Science; Gass, S.I., Fu, M.C., Eds.; Springer: Boston, MA, USA, 2013. [Google Scholar]
- Mouginot, B.; Leniau, B.; Thiolliere, N.; Ernoult, M.; David, S.; Doligez, X.; Miss, J. Core Library for Advanced Scenario Simulation, CLASS: Principle and Application. In Proceedings of the International Conference “The Role of Reactor Physics toward a Sustainable Future”(PHYSOR 2014), Kyoto, Japan, 28 September–3 October 2014. [Google Scholar]
- Leniau, B.; Mouginot, B.; Thiolliere, N.; Doligez, X.; Bidaud, A.; Courtin, F.; David, S. A neural network approach for burn-up calculation and its application to the dynamic fuel cycle code CLASS. Ann. Nucl. Energy 2015, 81, 125–133. [Google Scholar] [CrossRef]
- Thiollière, N.; Clavel, J.B.; Courtin, F.; Doligez, X.; Ernoult, M.; Issoufou, Z.; Somaini, A. A methodology for performing sensitivity analysis in dynamic fuel cycle simulation studies applied to a PWR fleet simulated with the CLASS tool. EPJ Nucl. Sci. Technol. 2018, 4, 13. [Google Scholar] [CrossRef]
Figure 1.
vs. of exploratory trajectories in the predisruption scenario.

Figure 2.
Adaptation from 2070: parallel plot of input variables vs. TRU.

Figure 3.
Parallel plots of adaptive strategies in 2 extreme cases: from 2050 and from 2150.


Table 1.
Variation ranges of variables in predisruption scenario. Note: = transition starting time; D = transition duration; = final total power; = final MOX fraction; s = new burn-ups of fuels; = new cooling time of UOX SF; = LiFo/FiFo for MOX fabrication.
Table 1.
Variation ranges of variables in predisruption scenario. Note: = transition starting time; D = transition duration; = final total power; = final MOX fraction; s = new burn-ups of fuels; = new cooling time of UOX SF; = LiFo/FiFo for MOX fabrication.
| Variable | D | |||||||
|---|---|---|---|---|---|---|---|---|
| Ranges | [2025, 2125] | [10, 2180-] | [175, 200] | [0, 0.3] | [30, 60] | [30, 60] | [3, 10] | LiFo/FiFo |
| Unit | (NA) | year | GW | (NA) | GWd/t | GWd/t | year | (NA) |
Table 2.
Inputs and outputs of interest in 2180 of the robust static optimum and the representative trajectory to be adapted.
Table 2.
Inputs and outputs of interest in 2180 of the robust static optimum and the representative trajectory to be adapted.
| Trajectory | D | |||||||||
|---|---|---|---|---|---|---|---|---|---|---|
| Static rob. op. | 2036 | 60 | 181.8 | 11.5% | 55.8 | 59.0 | 3.7 | FiFo | 1.01 | 1470 tons |
| To be adapted | 2044 | 94 | 180.9 | 1.8% | 41.0 | 50.0 | 7.6 | FiFo | 1.48 | 2170 tons |
Table 3.
TRU in 2180 of adaptive (robust) optima and TRU at adaptation time related to the representative trajectory (robust static optimum: 1470 tons in 2180).
Table 3.
TRU in 2180 of adaptive (robust) optima and TRU at adaptation time related to the representative trajectory (robust static optimum: 1470 tons in 2180).
| Adaptation Time | 2050 | 2070 | 2090 | 2110 | 2130 | 2150 | (2180 = No Adapt.) |
|---|---|---|---|---|---|---|---|
| 690 | 900 | 1110 | 1330 | 1560 | 1810 | (2170) | |
| Adapt. op. | 780 | 920 | 1110 | 1290 | 1530 | 1780 | (2170) |
Publisher’s Note: MDPI stays neutral with regard to jurisdictional claims in published maps and institutional affiliations. |
© 2021 by the authors. Licensee MDPI, Basel, Switzerland. This article is an open access article distributed under the terms and conditions of the Creative Commons Attribution (CC BY) license (http://creativecommons.org/licenses/by/4.0/).
Share and Cite
MDPI and ACS Style
Liang, J.; Ernoult, M.; Doligez, X.; David, S.; Tillard, L.; Thiollière, N. Robustness Study of Electro-Nuclear Scenario under Disruption. J. Nucl. Eng. 2021, 2, 1-8. https://doi.org/10.3390/jne2010001
AMA Style
Liang J, Ernoult M, Doligez X, David S, Tillard L, Thiollière N. Robustness Study of Electro-Nuclear Scenario under Disruption. Journal of Nuclear Engineering. 2021; 2(1):1-8. https://doi.org/10.3390/jne2010001
Chicago/Turabian StyleLiang, Jiali, Marc Ernoult, Xavier Doligez, Sylvain David, Léa Tillard, and Nicolas Thiollière. 2021. "Robustness Study of Electro-Nuclear Scenario under Disruption" Journal of Nuclear Engineering 2, no. 1: 1-8. https://doi.org/10.3390/jne2010001