Dynamic Foam Analysis can be used to determine important properties of foams such as liquid drainage, foam height and volume and changes in bubble size, all of which are direct indicators of foam stability. We are capable of capturing time-resolved images of the foams allowing for analysis of their structure by using bubble size distribution histograms and images.
Get rapid testing of your products
How to analyse foam stability and structure
At the Centre for Industrial Rheology, we use foam analysis techniques which are able to measure foam, liquid and total height, foam and drainage half-life times and foam structure.
The propensity of a product to generate foam can be called its foamability. A product with poor foamability would produce less foam (smaller height) under the same conditions as one with good foamability. Once the foam has been generated, its stability can be quantified by measuring its drainage. Drainage is also linked to foam height as the liquid fraction will increase in height whilst the foam fraction will decrease. Very unstable foams will also collapse from the top down as bubbles burst.
In foam analysis we generate foam automatically by sparging or stirring the samples. For sparging, we have two filter plates of 30 mm diameter: a plate of G3 porosity (16 – 40 μm), and a filter paper holder. Air can be sparged through these plates at rates between 0.2 to 1 L min⁻¹. For stirring, we have two heads: a ‘whisk’ head and a dual-blade head. These can be operated at stirring speeds up to 8000 rpm. Foams can also be generated manually off the instrument by other methods (shaking/pumping/etc.) and then loaded onto the instrument.
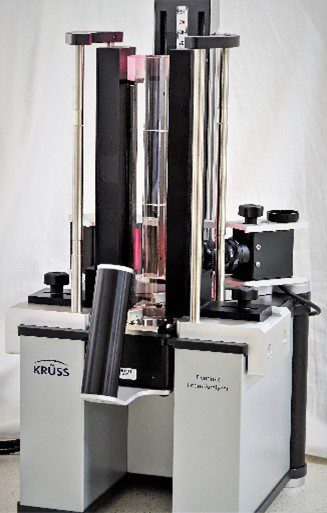
A brief overview of the operation
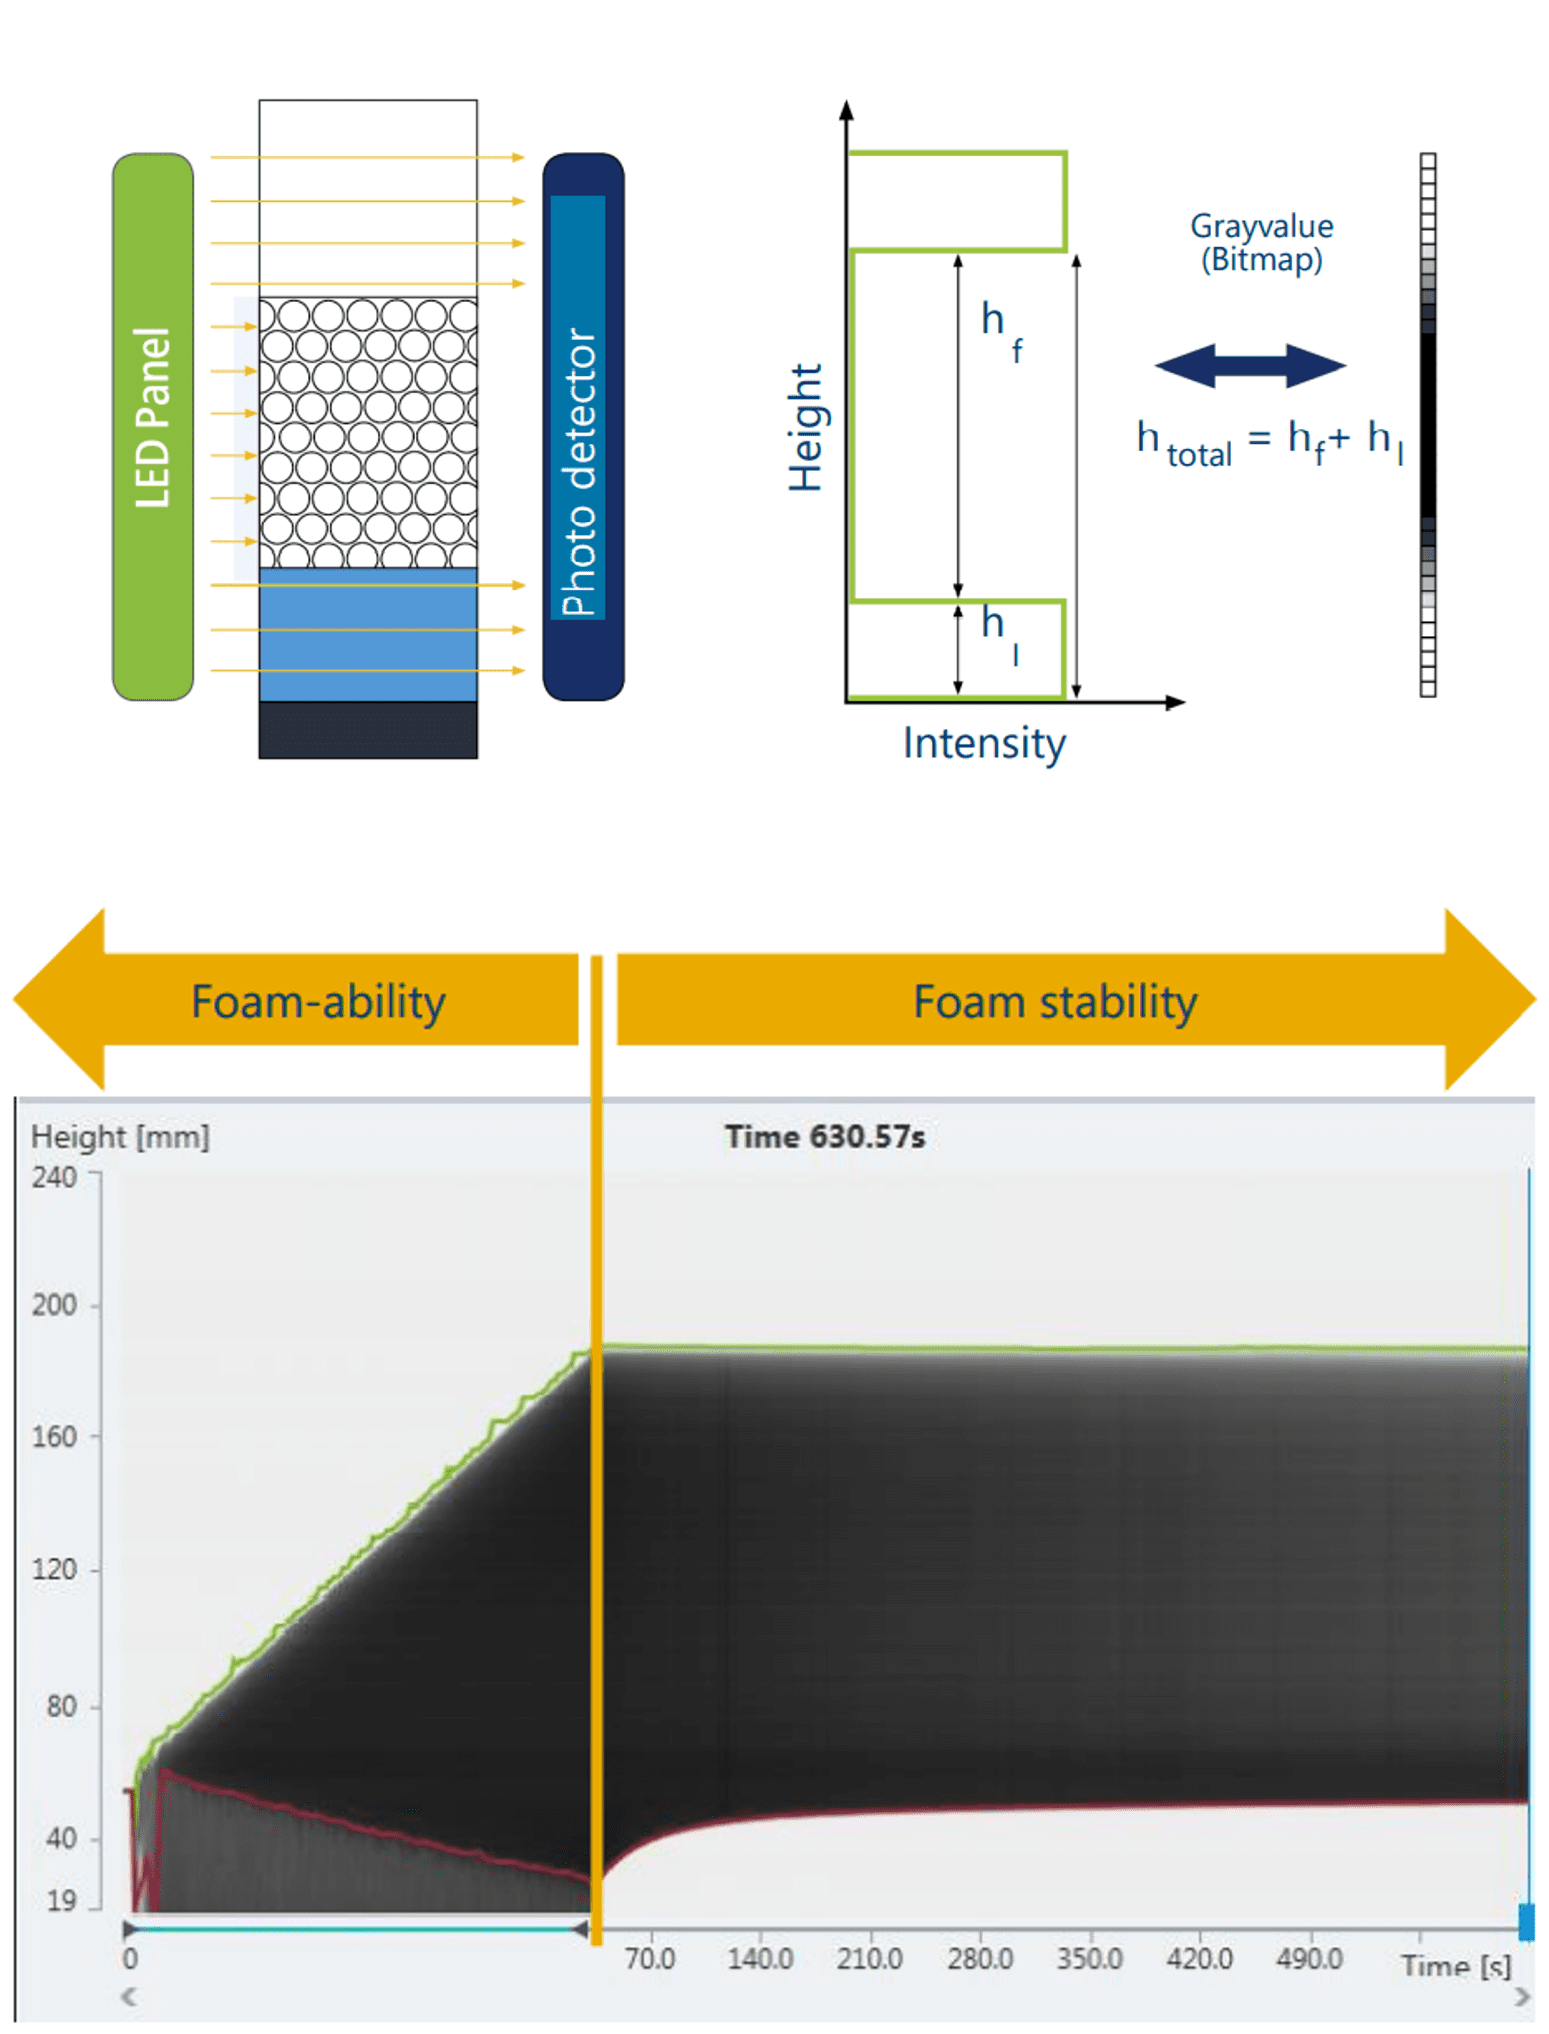
Foam analysis uses light transmission to determine the liquid and foam fractions in the glass column. The foam height module operates on the principle that air and transparent/translucent liquid can let light pass through, but foam will block the light. This allows the photodetector to detect the liquid/foam/air phases and boundaries.
There are two decay types measurable using the light sensor module: drainage and bursting/evaporation (also known as top-down decay). The mechanisms of degradation differ with time and from sample to sample.
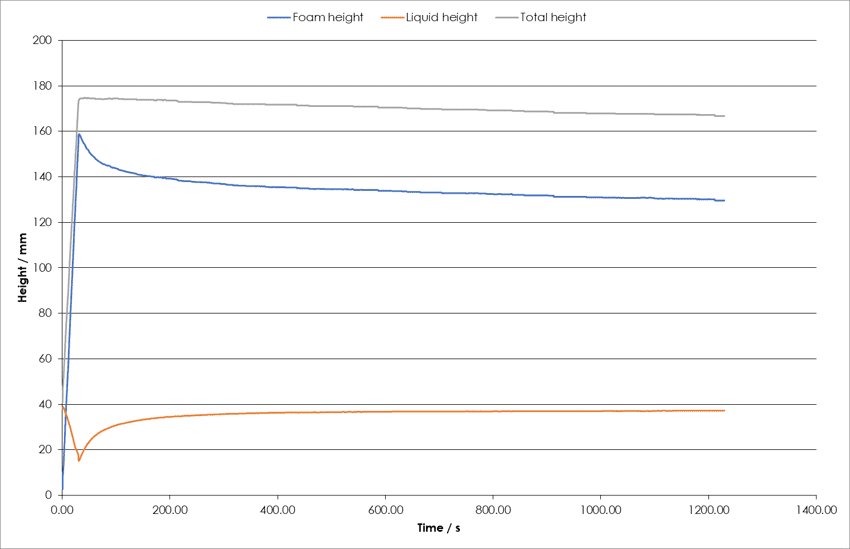
Foam decay due to drainage can be seen when the total height remains constant, but foam height decreases. This is due to the liquid fraction increasing as the liquid drains from the foam, thus drainage can be measured by looking at the increase in height/volume of the liquid fraction over time. Foam decay from top-down collapse is evidenced when there is a concurrent decrease in both total height and foam height.
Metrics associated with foam generation and decay that we can quantify are as follows:
Generation (foamability)
- Foam height (total height – liquid height)
Decay (foam stability)
- Drainage half-life (from liquid height)
- Foam half-life (from foam volume)
Other metrics
- Foam volume (height × area)
- Gas volume used for foaming
Determining structure
Another method of monitoring foam stability is by measuring the size of the bubbles over time. Bubbles of a less stable foam will increase in size at a greater rate than those of a more stable foam.
For this, we use the structure module of our foam analyser which consists of a prism column and a camera positioned orthogonally to an LED light source. The foam in the column has a thin liquid film between the bubbles and the prism. The bubbles press against the prism forming a gas-liquid interface parallel to the prism-liquid interface. As the camera will only detect light leaving the prism at a 90° angle to the LED, light from curved areas is not seen. No effects from second layer bubbles are observed meaning well-resolved, sharp images are generated.
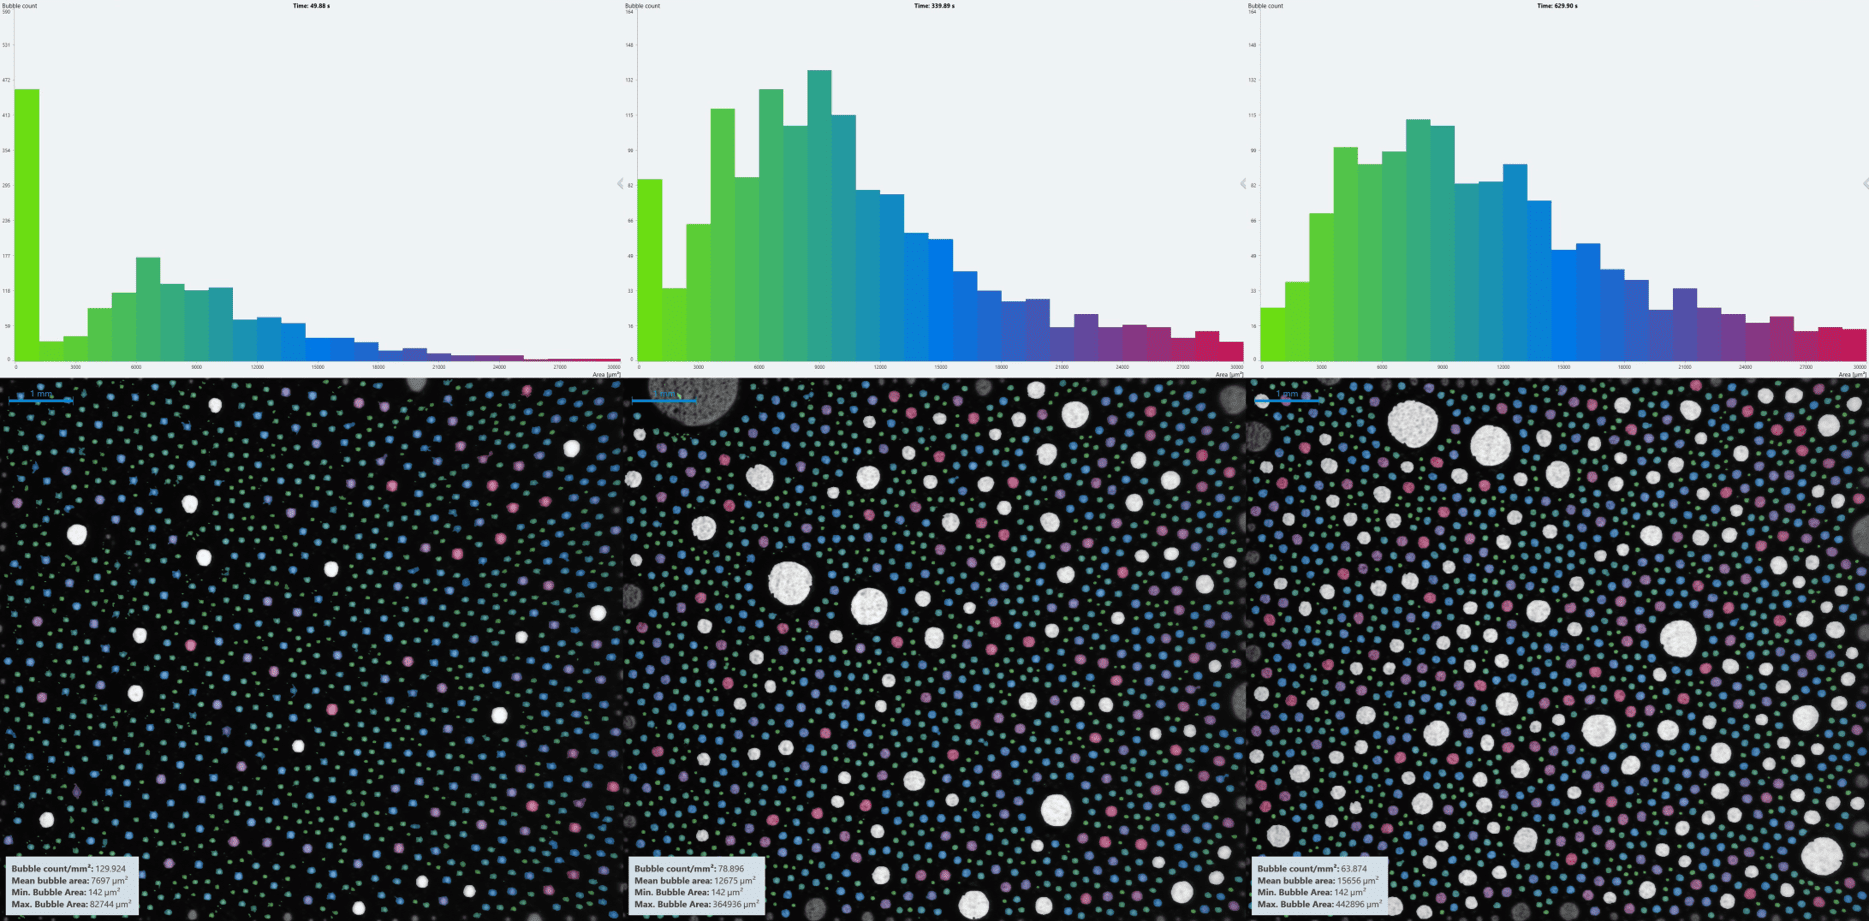
The images captured are time-resolved, so changes in foam structure over time can be observed. Individual images at defined time stamps can be pulled out or videos of structure evolution can be generated.
Our foam analysis software produces time-resolved histograms which demonstrate whether a foam is homo-/heterogeneous and if this changes with time. Other metrics which can be determined include mean bubble area and bubble count, which are further indicators of stability.
Get rapid testing using dynamic foam analysis of your products or those of your competitors