1. Introduction
Grasses form one of the most important taxonomic groups within the angiosperms in terms of
economic value, with the major food crops such as rice, maize and wheat belonging to the Poaceae.
They form 70% of all food crops in the world as well as being used for fodder for cattle and
bamboos being used for construction (Constable 1985) . Grass fibres are used in the production of
paper as well as the bioethanol derived from the lignins from grasses such as Miscanthus being used
as an alternative fuel source (Faix, Meier et al. 1989).
Along with the economic uses, grasses contribute a huge amount to the biodiversity of this planet.
There are over 9000 species of grasses, found from xeric to aquatic habitats, having colonised most
of the globe, dominating biomes in the form of grasslands as well as being important pioneer
species in primary or secondary successions, meaning they play a vital role in the establishment of
new ecosystems.
Due to the major significance of this important angiosperm group, studying the phylogenetics of it
gives us a deeper understanding on how the group is organised, when and where the major
diversification events took place, and try and elucidate any taxonomic conflicts there might be.
Also, with the changing global climate, dated reconstruction of phylogenies can provide us with
very important information on how major clades reacted to past climate change and how it affected
its diversification rates (Roquet, Sanmartin et al. 2009). With grasses being a major component of
biomes, phylogenetic research on them would be invaluable. However, the phylogeny of Poaceae
isn’t completely resolved as there are still questions pertaining to certain sub-groups within the
family. With the publication of the GPWG (Barker, Clark et al. 2001), some of these questions has
been answered such as the monophyley of the PACCAD clade as well as the earliest diverging
lineages of the Poaceae being the Anomochlooideae, Pharoideae and Peuliodeae. However, some
questions were raised from this report, namely the relationships among the major lineages in the
PACCAD clade and the resolution of the BEP clade (Clark, Zhang et al. 1995).
With this in mind, the project was aimed to gain sequences for 39 species of grasses, out of which
12 were from Phylostachys genera representing the woody bamboos. The rest contained some
Australian herbaceous grasses as well as other Bambusoideae species. The Phylostachys was
selected to shed light and hopefully help resolve the BEP clade whilst the Australian grasses were
chosen to provide resolution in the PACCAD clade, which was alluded to the GPWG report. These
sequences were to be aligned to previously derived sequences and used to create a phylogenetic
tree. The gene regions used for analysis were atpB-rbcL intergenic spacer and trnL intron, trnL-F
intergenic spacer (the names of these two regions are hereafter called trnL-F as they are continuous
tandemly arranged pieces of DNA). These two gene regions found on the cholorplast were chosen
are they are commonly used for phylogenetic study, especially from species to family level (Soltis
2. and Soltis 1998). This plastid DNA is non-recombining and maternally inherited in most
angiosperms. Hence, different sequences found on the plastid genome should share a similar
evolutionary and provide congruent phylogenetic trees.
Materials and Methods
Plant Materials
Species used in this study were collected by Dr. Trevor R. Hodkinson and Surrey Jacobs. 39
samples were made available for this project, which included fresh samples, samples stored in
silica, samples stored in liquid CTAB as well as already extracted total DNA (See Appendix I for
more details).
Isolation of total genomic DNA
Total genomic DNA (tDNA) was extracted from a range of 0.1-0.7g, depending on how much plant
material was available and state of preservation. tDNA was extracted using the protocol adapted
from Hodkinson et al (Hodkinson, Waldren et al. 2007). For the samples stored in liquid CTAB,
and extra step in the extraction method was followed, so as to remove traces of CTAB on the plant
material. This involved washing the each of the samples in distilled water a minimum of three
times, and then placing the plant material on tissue paper to absorb the water. This was allowed to
dry in a fume hood for 10 mins, and then the dry mass was measured and the extraction process as
outlined in the protocol was conducted.
Following the extraction, the tDNA was run on an agorose gel stained with ethidium bromide so as
to visualise the DNA under UV light. If there was no DNA visible, amount of tDNA used in the gel
was increased or a new gel was created with a lower/higher amount of ethidium bromide. If the gel
was still unsuccessful, the extraction process was carried out once again. 100 l of the tDNA was
then pelleted, washed and purified using a JetQuick PCR purification kit (GENOMED Inc.) and
eluted using TE buffer (10mM Tris-HCl; 1mM EDTA; pH 8.0) and stored at -20°C until use.
DNA amplification and sequencing
The atpB-rbcL IGS and trnL-F region of the purified DNA was tehn amplified using a polymerase
chain reaction (PCR). Each of the two genen regions were amplified by their respective primer,
namely “c” and “f” for trnL-F and “1R” and “2R” for atpB-rbcL IGS.
Each of the 50 l PCR reactions consisted of several chemicals which is outlined in Table 1 whilst
the parameters used in the PCR reactions is outlined in Table 2.
3. atpB-rbcL trnL-F
Amount (µl) PCR chemicals
31.75 Sterile distilled H2O Sterile distilled H2O
10 5x colourless GoTaq Flexi buffer
(Promega corp.)
5x colourless GoTaq Flexi buffer
(Promega corp.)
4 25mM MgCl2 25mM MgCl2
0.5 “1R” primer “c” primer
0.5 “2R” primer “f” primer
1 10mM dNTPs 10mM dNTPs
0.25 GoTaq DNA polymerase
(Promega corp.)
GoTaq DNA polymerase
(Promega corp.)
50
Table 1: Chemicals and respective amounts used in the PCR reactions
Step Temperature (o
C) Time
Premelt 95 1 min
Denaturation 95 45 sec
x32 cyclesAnnealing 50 45 secs
Extension 72 2 mins
Final extension 72 7 mins
Soak 4
Table 2: PCR parameters executed on a GeneAmp PCR system 9700 (Applied Biosystems). Soak time is
synonymous with hold time where the PCR products are held for an indefinite period of time.
The products of the PCR reaction was run on an agarose gel stained with ethidium bromide to
determine whether the PCR reaction was successful. If the reaction wasn’t successful, the PCR was
run again, but by changing some of the parameters or concentrations of some of the chemicals. The
cycles could be reduced or the annealing temperature increased to 52°C (as for the case of trnL-F).
The concentrations of the DNA and MgCl2 can be altered accordingly. To optimise the PCR
reaction, the amount of DNA was increased to 3µl and the 25mM MgCl2 was was increased to 5µl.
In this case, the amount of water was reduced so the total reaction mixture was 50 µl.
The successful PCR products were cleaned once again using a JetQuick PCR purification kit
(GENOMED Inc.) but used ultra-pure sterile water instead of TE buffer as the elution buffer. This
cleaned product underwent cycle sequencing on a GeneAmp PCR system 9700 (Applied
4. Biosystems), similar to the PCR reaction. Each of the cycle sequencing reaction were 10µl in
volume and contained 1.5µl of the PCR product, 2µl of either atpB-rbcL IGS primers (“1R” or
“2R”) or trnL-F primers ( “c” or ”f”), 1.5µl of BigDye Terminator v1.1, v3.1 5x sequencing buffer
(Applied Biosystems), 1µl of BigDye Terminator v3.1 Cycle Sequencing RR-100 (Applied
Biosystems) and 4 µl of sterile distilled H2O. The parameters used for the cycle sequencing reaction
is shown in Table 3:
Step Temperature (o
C) Time
Initial
Denaturation
96 1 min
Denaturation 96 10 sec
x28 cyclesAnnealing 50 5 sec
Extension 60 4 mins
Soak 4
Table 3Cycle sequencing parameters executed on a GeneAmp PCR system 9700 (Applied Biosystems). Soak
time is synonymous with hold time where the cycle sequencing products are held for an indefinite period of
time.
The products of the cycle sequencing went a further purification method by ethanol precipitation.
This is important to remove and residual cycle sequencing chemicals in the DNA that would
interfere with the DNA sequencer. The cleanup involved mixing each of the samples with 52 µl of a
solution of 50 µl 100% ethanol and 2 µl of 3M sodium acetate. This was left at room temperature
away from direct light for 15 mins after which it was left in ice for 30-45 mins away from direct
light again. The samples were then centrifuged for 30 mins at 4000rpm. After immediately spinning
the samples down, the samples were inverted with paper towel replacing the caps and placed upside
down in the centrifuge bucket. This was then centrifuged to a maximum of 180rcf. The tubes were
then turned the right way up and the paper towel was removed, and capped replaced. 20 µl of 70%
ethanol was then added to each sample and then centrifuged at 4000rpm for 20 mins. The samples
were then inverted once again with a paper towel replacing the caps, placed upside down in the
centrifuge bucket and centrifuged at 1000 rpm for 1 min. This is done to remove the excess wash
buffer. The tubes are removed from the centrifuge, placed the right way up and left in a fume hood
away from direct light for 25-30 mins. This is done to remove all the ethanol present in the sample
so as not to interfere with the sequencer.
The samples are resuspended in 10 µl hi-di formamide and vortexed. The samples are then heated at
95°C for 5mins after which it is immediately placed in ice for 3-4 mins. The samples are then
transferred to the sequencing plate and briefly spun to remove any bubbles. The plate was then
loaded into a 3130XL Genetic Analyser (Applied Biosystems) for separation of the fragments.
5. DNA sequence editing, assembly, and phylogenetic analysis
The DNA sequences obtained from the geneteic sequencer was evaluated in Sequence Analysis
v5.3.1 (Applied BioSystems) software, where the corresponding peaks were seen for each of the
bases. This was then analysed, edited and assembled using Auto Assembler v2.1 (Applied
BioSystems) software and concensus sequences were obtained for each of the samples. This was
then imported into PAUP (Sinauer Associates) computer programme where it was aligned by eye
alongside 62 other sequences made available by Dr, Trevor Hodkinson. Once the sequences were
aligned they were subjected to maximum-parsimony analysis using heuristic search options in
PAUP (Sinauer Associates) computer programme. The heuristic searches included 1000 replicates
of random stepwise addition with no more than 75 trees saved per replicate. An exclusion set of 168
characters were used when running the search. The branch swapping algorithm used was tree-
bisection-reconnection (TBR) and model for distance measured was the HKY85 model (Hasegawa,
Kishino et al. 1985) as the concentrations of the bases in the sequences are unequal. Bootstrapping
analysis was then carried out using 1000 replicates using TBR algorithm. Sequences from the
Panicoideae subfamily were used as an outgroup to root the tree.
Results
When the extracted DNA was run on the agarose gel, it could be seen that the tDNA quantity was
very low, except for the 4 freshly collected samples of 2 species of Fargesia, Pleoblastys
pygmeansis and, Phylostachys sp. Along with the freshly collected samples, the tDNA already
extracted that was provided by Dr. Trevor Hodkinson of the 11 Phylostachys species, showed high
amounts of DNA when run in the gel. All these samples amplified well during PCR with the atpB-
rbcL IGS primers, but none of the samples that were stored in the liquid CTAB amplified. The PCR
reactions with the trnL-F were unsuccessful, with no amplifications seen in any of the samples (See
Appendix I for more details).When the successful atpB-rbcL gene region PCR products were taken
to the cycle sequencing stage, all of the products were sequenced successfully.
The aligned matrix was 856 characters long of which 168 characters were excluded. Of the
remaining 758 characters 502 characters were constant. 118 were variable but parsimony-
uninformative and 138 were included parsimony-informative. The tree search using maximum
parsimony yielded 200 equally parsimonious trees with 398 steps (Figure 1) with the consistency
index (CI) being 0.76 and the Retention index (RI) being 0.82. Bootstrap (BS) percentages are
described as low (50-74%), moderate (75-84%) and high (85-100%) (Sungkaew S, Stapleton CM et
al. 2009).
The BEP clade was highly supported (100% BS) as being monophyletic. The monophyly of the
subfamilies however isn’t strongly supported, with a low BS value for the Erhartoideae (53%).
Pooideae is sister to Bambusoideae s.s with 99% BS.
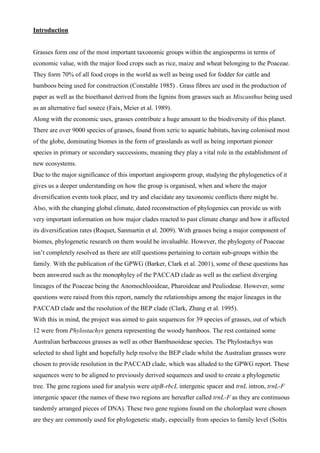
6. Figure 1: One parsimonious tree obtained from heuristic search with distance measured using HKY85 model. BS values
seen above the branches and the species names in bold and italics were sequenced for this project.
The Bambusoideae s.s seems to be monophyletic (88% BS) including neotropical, paleotropical and
temperate bamboos in the same clade. Monophyly of the Olyreae (99% BS) and Bambuseae (96%)
is highly supported. The sequenced species resolved moderately well in the Arundinaieae tribe
Fargesia 1
P. incernata 9
Pleioblastus 2
Fargesia 4
P monii 10
P arca 15
P nidul 17
P hum 18
Pseudosasa cantorii1
Phylostachys 3
Chimonobambusa quadrangularis 105
P. pub 107
Chimonocalamus pallens 1340
Chimonocalamus sp
Oligostachyum glabrescens 1302
Fargesia 5
Fargesia 8
P anvea 16
Borinda sp.1347
P bambus 13
P. nig SS106
P biseti 14
P virid 12
Menstruocalamus sichuanensis1319
Neohouzeaea kerrii3
Schizostachyum jaculans 307
Bambusa bambos 3 16
Bambusa beecheyana 1313
Bambusa malingensis 1332
Bambusa oldhamii1321
Dendrocalamus asper BAM1WKM
Dendrocalamus BAM45WKM
Dendrocalamus latiflorus SS113
Dendrocalamus minor1317
Dendrocalamus membranaceus SS02 04
Dendrocalamus strictus18
Dendrocalamas valida 625
Gigantochloa scortechinii SS309
Melocalamus compactiflorus 175
Bambusa tulda 1328
Dendrocalamus hil BAM24WKM
Gigantochloa ligulata SS09 04
Neosinuscalamus affinis SS624
Thy rsostachys siamensis SS02 03
Gen nov SS191
Vietnamosasa ciliata SS208
Vie pus SD1466
Oxybra Stapleton1307
TemO lil SS10 15
Dinochloa malayanaSD1412
Guacha Stapleton1308
Arthrostylidium glabrum 572
Rhipidocladum racemiflorum 76
Temburongia simplex 21774
Cepper SD1435
Neohouzeaua fimbriata SSRP12
Pseudostachyum polymorphunm SS176
Sch izostachyum grande SS10 06
Schizostachyum zollingeri SS09 01
Chu squea patens 571
Cryptochloa granulifera 54
Lithachne pauciflora 48
Piresia sp 601
Oly ra latifolia 614
Brachypodium 22
Lolium 29
Arrhenatherum 27
Alopecurus 30
Nardus 5
Lygeum 18
Leersia 636
Oryza rufipogon SS164
Oryza sativa 46
Ehrharta calycna G25
Panicum 120
Saccharum 104
Miscanthus 5
5 changes
Olyreae
Bambuseae
Pooideae
Ehrhartoideae
Arundinarieae
100
53
100
100
100
99
92
61
57
84
99
85
100
88
55
96
86
76
64
65
66
88
64
Bambusoideae s.s
BEP clade (100)
7. (76% BS). The Phylostachys and Fargesia are polyphyletic. Figure 2 illustrates the separation of
Figure 3: Bambuseae tribe, separated along the lines of geography, the plant species grouping under Temperate,
Paleotropical and Neotropical.
the Bambuseae tribe into geography, with a moderate support for Temperate bamboos (76% BS),
high support for paleotropical (88% BS) and a low support for neotropical (55% BS).
8. Discussion
The resolution of the BEP clade in Fig.1 is in congruence with the recent study by Sungkaew et. al
(Sungkaew S, Stapleton CM et al. 2009). They found Erhartoideae were a sister to the lineage
consisting of Pooideae and Bambusoideae. We arrived at the same conclusion with 100% BS value.
However, within the BEP clade, we discovered some incongruence with some of the recent studies.
According to GPWG (2001), we were expected to see Pooideae as a sister group to Bambusoideae,
which is confirmed in our studies as well (Bouchenak-Khelladi, N. et al. 2008). However, this
wasn’t the case as we see Pooideae being a sister group to Olyreae, which is a sister group to
Bambuseae.
This is however in congruence taxonomically, as the monophyletic Olyreae represent herbaceous
bamboos, whilst the monophyletic Bambuseae represent woody bamboos. This means the
phylogenetic analysis of the Bambusoideae is synonymous with the taxanomic separation of the
woody and herbaceous species. It could be hypothesised that the ancestor of the bamboos were
herbaceous and the Bambuseae evolved woodiness from it whilst the Olyreae kept the herbaceous
stem. However, this conclusion should be considered with caution as the previous studies have used
multi-gene analysis, whilst only one gene region was analysed in this study. As only three species
from the Olyreae were sequenced, increasing the sampling set would provide us with a clearer
picture.
Sungkaew et. al (Sungkaew S, Stapleton CM et al. 2009) used multi-gene region phylogenetic
analysis to elucidate the Bambusoideae sub-family, but the dataset with regards to the temperate
bamboos was low. In this study, we increased the sampling of temperate bamboos by incorportating
11 species of Phylostachys, 2 species of Fargesia and 1 species of Pleoblastus. Hence we see a
greater resolution of the Arundinareae tribe (Fig.1).
None of the plant material that was stored in liquid CTAB worked. This might’ve been due to major
degradation of the DNA. The fresh samples that were extracted worked well, as well as the total
DNA that was provided for this project worked as well, as it was extracted from fresh samples. This
highlights the importance of proper storage of specimens.
The samples that were successful in the PCR using the atpB-rbcL gene region, were unsuccessful
under trnL-F. This was due bad stock “c” and “f” primers.
9. Acknowledgements
I would like to thank Dr. Trevor Hodkinson for supervising my project as well as all the
postgraduates in the Botany Department for their invaluable assistance during the 10 weeks. I
would also like to thank Dr. Daniel Kelly, Fiona Molloney and Dr. Martyn Linnie for co-ordinating
the UREKA programme. Finally I would like to thank Science Foundation Ireland for funding the
project,
References
Barker, N. P., L. G. Clark, et al. (2001). "Phylogeny and subfamilial classification of the
grasses (Poaceae)." Annals of the Missouri Botanical Garden 88(3): 373-457.
Bouchenak-Khelladi, S. N., et al. (2008). "Large multi-gene phylogenetic trees of the
grasses (Poaceae): Progress towards complete tribal and generic level sampling." Molecular
Phylogenetics and Evolution 47(2): 488-505.
Clark, L. G., W. Zhang, et al. (1995). "A phylogeny of the grass family (Poaceae) based on
ndhF sequence data." American Journal of Botany 82(6 SUPPL.): 120-121.
Constable, G. (1985). Grasslands and Tundra.
Faix, O., D. Meier, et al. (1989). "Analysis of lignocelluloses and lignins from Arundo
donax L. and Miscanthus sinensis Anderss., and hydroliquefaction of Miscanthus." Biomass
18(2): 109-126.
Hasegawa, M., H. Kishino, et al. (1985). "Dating of the human-ape splitting by a molecular
clock of mitochondrial DNA." Journal of Molecular Evolution 22(2): 160-174.
Hodkinson, T., S. Waldren, et al. (2007). "DNA banking for plant breeding, biotechnology
and biodiversity evaluation." Journal of Plant Research 120(1): 17-29.
Roquet, C., I. Sanmartin, et al. (2009). "Reconstructing the history of Campanulaceae with a
Bayesian approach to molecular dating and dispersal-vicariance analyses." Molecular
Phylogenetics and Evolution 52(3): 575-587.
Soltis, D. E. and P. S. Soltis (1998). Choosing and approach and an appropriate gene for
phylogenetic analysis. Molecular systematics of plants II, DNA sequencing. Dordrect,
Kluwer Academic: 1-41.
Sungkaew S, Stapleton CM, et al. (2009). "Non-monophyly of the woody bamboos
(Bambuseae; Poaceae): a multi-gene region phylogenetic analysis of Bambusoideae s.s." J
Plant Res 122: 95-108.