Exhaustion Gap: Definition, How to Recognize, Trading and Advantages
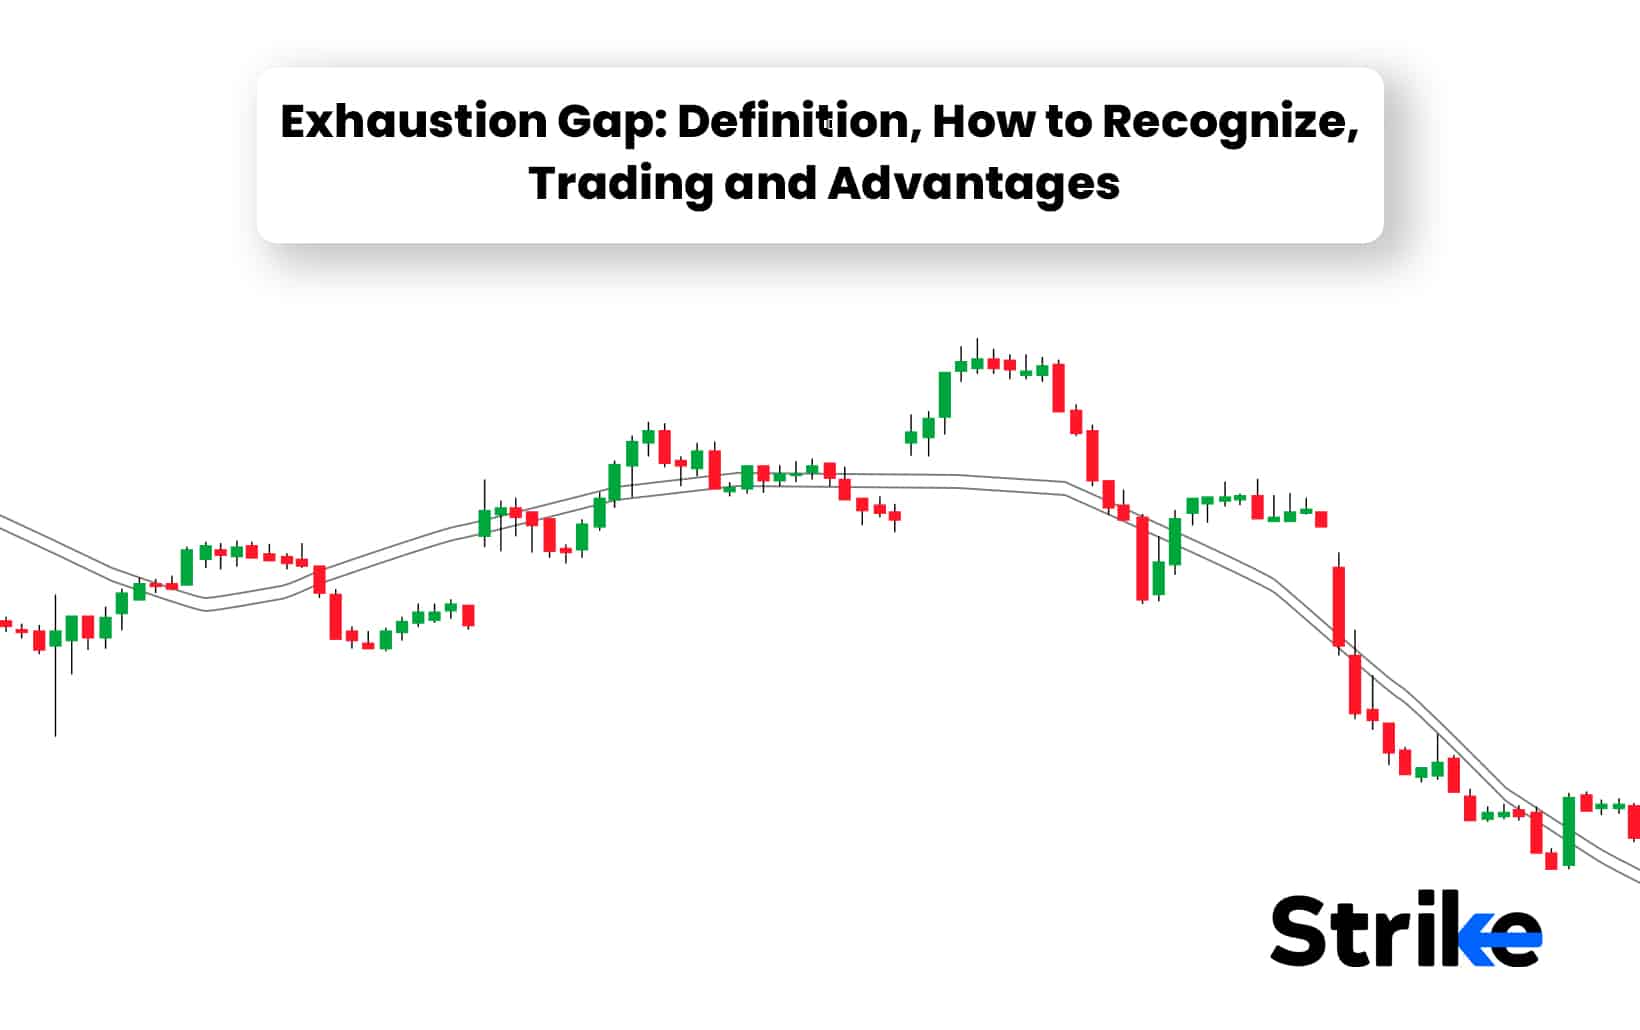
Table of content show
An Exhaustion Gap is a price gap that occurs after a trend begins to break down following a rapid rise in a stock’s price. An Exhaustion Gap signals a significant change in the demand for a stock and is followed by a sharp decline in the price of a stock. It is a sign of lack of momentum. Exhaustion Gap is used to indicate reversals of patterns.
An Exhaustion Gap is recognized at the end of a trend or at an important support and resistance level. Exhaustion gap is confirmed when prices reverse and close. Exhaustion gap is often associated with a rise in price along with an increase in volume. It is also be mistaken for runaway gaps if the exceptionally high volume is not noticed. One of the advantages of exhaustion gaps is that it is the easiest to trade and profit from. Exhaustion Gaps are also associated with rapid, extensive advances or declines.
Exhaustion Gaps usually get filled and the best way to trade an exhaustion gap is not to speculate but to use the information to time exits and entries around the pattern. Traders build a trading strategy based on the type of gaps formed. There are two types of exhaustion gaps, bullish and bearish. An Exhaustion Gap is used as a key indicator for traders to exit a trade. It signals the traders to enter the opposite trend after they spot this gap.
What Exactly is an Exhaustion Gap in Technical Analysis?
An Exhaustion Gap in technical analysis helps keep track of the price movement and volume, which are two important aspects of the analysis. An Exhaustion gap provides clues about price movement and occurs when there is a high volume in the stock.
An exhaustion gap in technical analysis represents a gap in the price of the stock which indicates the end of a trend. An exhaustion gap in technical analysis is an area that is seen across all the time frames – daily, weekly, monthly. Exhaustion Gaps is an indication of an impending change in trend. They show that a price has jumped and they are likely to represent some significant change in what is happening with the stock, presenting a trading opportunity.

How does an Exhaustion Gap work? To understand how an exhaustion gap works, it is important to learn about how it occurs. An exhaustion gap usually occurs at the end of a strong price move as volume fades. Price makes one last attempt to move higher in the case of an uptrend in an exhaustion gap. The trend is exhausted and the higher price does not sustain. These gaps typically fill as investors lock in their profits and sell off the stock.
Exhaustion gap is not followed by new highs during uptrends and in case of downtrends, exhaustion gap is not followed by new lows. Exhaustion gap is only confirmed when prices reverse and close. Exhaustion gap is often associated with a rise in price along with an increase in volume. It is also be mistaken for runaway gaps if one does not notice the exceptionally high volume. Traders usually compare both price and quantity to distinguish between the two. They are identified by high volume and a large price difference between the previous day’s close and the new opening price. It is called an exhaustion gap if both price and volume increases.
Exhaustion gaps are considered as an almost state of panic if the gap appears during a long down move. Selling all the positions to liquidate the holdings in the market is not uncommon at this point. Exhaustion gaps are quickly filled as prices reverse their trend. Buyers do not get enough of that stock if they happen during a bull move and if a bullish sentiment overcomes the trades. The prices gap up with huge volume and there is great profit taking. The demand for the stock totally moves down. This leads to a price drop and a significant change in the trend occurs. Exhaustion gaps are probably the easiest to trade and profit from. These gaps are also associated with rapid, extensive advances or declines.
The first gap in the direction of the trend looks like a runaway gap but the following candle is usually after a Doji pattern showing the indecision or rejection of a price level. Price is not sustainable after the exhaustion gap. It is useful to discover the market Top or Bottom. Exhaustion gap represents the final leg of a price pattern and is an indicator of a final attempt to reach the new high or lows in pricing.
What is the importance of exhaustion gap in Technical Analysis?
An exhaustion gap has great importance in technical analysis of the market. It helps predict the market trend. An exhaustion gap appear in the market at the end of an upward or downward trend. They indicate high volume with a large price difference between the previous day’s close and the new opening price. The prices gap up with a huge volume and there is a great profit taking during a bullish or bearish exhaustion gap. The demand for the stock totally dries up. Prices drop and this results in a significant change in the trend.
An Exhaustion gap helps in predicting the magnitude of the trend. The length or magnitude is determined using technical indicators like RSI or EMA. This will help with determining the success of the reversals. An exhaustion gap indicates a trend reversa, which helps trader strategize accordingly. The formation of a gap dictates what is to be done next in the market by the traders.
How to identify an Exhaustion Gap in a Stock Price Chart?
There are four steps to identify an exhaustion gap in a stock price chart.

- Find a Trend: The first step in identifying an exhaustion gap is to find a trend. A trend is the overall direction of a market or a stock’s price. Trends are identified by price action. The price that makes higher swings high and higher swings lows by rising data points are marked as an uptrend. The price that makes lower swings lows and lower swing highs by falling data points are marked as a downtrend. Uptrends and downtrends occur in all markets like stocks, bonds and futures. Trends also occur in data that is when monthly economic data rises or falls from month to month. Price action, trendlines, and technical indicators are tools that help identify the trend. The exhaustion trend pattern is not valid in the absence of a trend. Hence, finding a trending stock is the first step to identifying an exhaustion trend.
- Identify Low Volumes during a Gap: Trading volumes of the stocks should be closely analyzed when a gap in the direction of the primary trend occurs. Potential trouble on the horizon is indicated when the volume of the stock is light. The trending stock will create a bullish gap which is in the direction of the trend. The trading volumes are very low at this point and it is identified by the stocks which are getting higher.
- Identify volume increase during reversal: Trading volume of the stocks increase along with the price relative to the opening gap. The price action reverses at this point indicating a trend reversal. This is, however, not enough to confirm the pattern and to open a trade
- Confirm the Exhaustion Gap: The confirmation of an exhaustion gap is the next step to recognize before trading the exhaustion gap. There are two methods for confirming the pattern. The first one is by spotting a gap which is in the opposite direction of the exhaustion gap. The price starts gaping opposite to the trend when the trend reverses as the opposite force is too strong. This sometimes creates an island reversal candle pattern on the chart. An island reversal pattern is formed with the combination of price action and two gaps. They form in between these two gaps. Island gaps indicate that the island reversal marks a sudden and sharp shift in direction. Island reversals are potent patterns that draw our attention even though they are relatively uncommon. Spotting an opposite gap or even an island reversal candlestick pattern is the strongest confirmation of an exhaustion gap.
The second way to confirm the pattern is with a breakout through the opening gap range. The price action breaks the range opposite to the prior trend. This confirms the pattern.

Here the previous trend was bullish and a bearish exhaustion gap is seen. Then the confirmation comes when the price breaks the lower level of the gap. The blue horizontal line on the image above shows the high point of the bearish exhaustion gap. The confirmation of the pattern comes in the red circle when the price action breaks the gap high upwards.
These four steps that help identify an exhaustion gap involve risk and are made more efficient if the traders consider the market conditions before trading. Identifying an exhaustion gap is an important skill for traders and investors in the stock market. Careful analysis and experience is required for identifying and trading an exhaustion gap.
What are the key Characteristics of the Exhaustion Gap?
The key characteristics of the exhaustion gap lists down the traits that make the exhaustion gap unique. Knowing these features help traders understand how these gaps differ from other technical analysis tools. Mentioned below are four traits of the exhaustion gap:
- A sustained period: There is a sustained period of uptrend in the price of the stock. This period is usually several days, weeks or months of an uptrend in prices making higher highs depending on the stock.
- Volume of the Stock: Exhaustion gap occurs on higher than normal volume for stronger confirmation. The stock is trading above its average daily volume.
- Aggressive move: There is an aggressive move to the upside or downside.The trading volumes are very low and the stock keeps getting higher. There is immediately a change when the price action changes and the volumes also get higher.
- Price drop: The price drop breaks the most recent trend. The price action reverses while the volumes are increasing. The indication of bearish exhaustion gap is when the price action breaks its lower level.
It is important for traders and investors in the stock market to understand the characteristics of an exhaustion gap. The characteristics of an exhaustion gap help the traders and investors identify the potential trading opportunities and manage the risk.
What time frame does an Exhaustion Gap show?
An exhaustion gap occurs for several days, weeks, or even months of an upward trend in the share prices of a stock. There is a sizable gap between the lowest price of the previous day and the highest price of the most recent trading day. The gap is roughly half the range or better of an average trading day for that stock. An above average degree of trading volume takes place on the current day.
Do Exhaustion Gaps get filled?
Yes, exhaustion gaps are likely to get filled. An exhaustion gap being filled refers to the share price returning to the original level before the gap happened. The price action in the following days or weeks retraces to the last day before a gap. This means that the gap is filled. There is also price correction where an overly optimistic or pessimistic initial spike invites a correction. The support and resistance level isn’t left behind when a price moves up or down sharply and the price reversals seen with an exhaustion gap are likely to be filled as the gap signals the end of a price trend.
How long does it take for an exhaustion gap to be filled?
An Exhaustion Gap is filled in days or weeks depending on the share price action. The price returns to the original level before the gap happens usually in the following days or weeks retraces to the last day before a gap. This depends on a range of factors that comes into play with gap fill stock like support and resistance and patterns.
Is it possible for an Exhaustion gap to never be filled?
Yes, it is possible for an exhaustion gap to never be filled. Low volume typically signals an exhaustion gap or a coming fill. High trading volume in the direction of a gap is usually a sign that the gap continues rather than getting filled, especially if the gap is in the same direction as an underlying trend. Though this signifies that exhaustion gaps are likely to be filled, there are equal chances of the gap to continue.
What are the types of exhaustion gaps?
There are two different types of an exhaustion gap patterns. They depend on the current trend of the stock, which is either an upward trend or a downward trend. The two different types of exhaustion gaps are Bearish Exhaustion Gap and Bullish Exhaustion Gap. Bearish Exhaustion Gaps start with a bullish trend, bullish gap and a bearish reversal. There is an upward gap with extreme volume and the gap closes within five bars. On the other hand, the Bullish Exhaustion Gap starts with a bearish trend, bearish gap and a bullish reversal. There is a downward gap with extreme volume and the gap closes within five bars.
1. Bearish Exhaustion Gaps:
A bearish exhaustion gap is an upward gap with extreme volume that starts to develop at the end of a strong upward trend. A bearish gap signals that buyers are losing their momentum and that sellers are now in control of the stock price.

The three important phases in a bearish exhaustion gap is a bullish trend, bullish gap and a bearish reversal. A bullish trend is an upward trend in the market represented by rising stock prices of various securities in the market, especially equity instruments. A growth of at least 20% or more by several stock exchanges in terms of trade volume and purchases indicates a bullish trend. A bullish market trend is identified by market rally, volatility index, lower bond yields. The investors generate high expectations regarding the stock market performance and pool their money readily into this sector during this time. An increasing consumer confidence level subsequently increases the cash flow into this sector. This allows companies to increase annual turnover, which leads to higher profits to be disbursed among shareholders.
A bullish gap is a Japanese candlestick with an opening price higher than the closing price of the previous candlestick. It generally occurs in a bullish trend. A bullish gap is a continuation pattern which indicates a continuation of the bullish movement. This becomes a breakthrough gap indicating a trend reversal. A bearish reversal starts with a bullish price movement and reverses into a decreasing stock price. This is because the bullish trend of the stock is reversing, leading to a downtrend in the stock.
The price action creates a bullish gap with relatively low to moderate trading volumes. The volumes are low and the price continues to increase. This is a possible indicator that the upward movement is fueled by retail traders. Then you see a number of candles with long upper wicks, which is a sign that the bulls are unable to sustain any positive momentum. The buyers lose momentum and the sellers take control. This usually signals an opportunity for buyers to exit the trade or for shorts to enter. There is a bullish trend followed by increasing volume signaling an exhaustion gap in a bearish exhaustion gap
2. Bullish Exhaustion Gaps:
A bullish exhaustion gap begins at the end of a strong bearish trend. A bullish gap signals that sellers have been exhausted and that an uptrend is getting ready to reverse. The three important phases in a bullish exhaustion gap is a bearish trend, bearish gap and a bullish reversal. There is a downward gap with extreme volume and the gap closes within five bars.

A bearish trend is a downward trend in the market represented by declining stock prices of various securities in the market, especially equity instruments. A decline of at least 20% or more by several stock exchanges in terms of trade volume and purchases indicates a bearish trend. A bearish trend is recognized by falling market indices and recession. A bearish gap is a Japanese candlestick with an opening price lower than the closing price of the previous candlestick. It generally occurs in a bearish trend. A bearish gap is a continuation pattern. Bearish gap indicates a continuation of the bearish movement. This is a breakthrough gap indicating a trend reversal. A bullish reversal occurs when a bearish market with a downward trend begins to move in the opposite direction.
The bullish exhaustion gap develops at the end of strong bearish trends. The gap implies that the sellers are losing momentum and buyers are picking up steam. This creates long opportunities on the stock chart. The bullish exhaustion gap occurs at the end of a bearish trend with low volumes. Then the price reverses and at the same time volumes increase. This process confirms the presence of a bullish exhaustion gap pattern. The bullish exhaustion gap signals that an uptrend is getting ready to reverse. This presents an opportunity for buyers to enter into a long position or for shorts to cover their positions. The buying volume has to pick up during a bullish exhaustion gap as it will help reverse the trend.
How to trade Exhaustion Gaps?
To trade exhaustion gaps, it is important to identify them, first. Listed below are the five steps that help in trading an exhaustion gap:
- Find the trend: The first step in taking an exhaustion trend is to find a trend. The pattern cannot be valid in the absence of a trend. A trending stock is important in identifying low volumes during a Gap. Trading volumes of the stocks should be closely analyzed when a gap in the direction of the primary trend occurs. Potential trouble on the horizon is indicated by when the volume of the stock is light. Identifying Volume Increase during Reversal is important as trading volume of the stocks increase along with the price relative to the opening gap. The price action reverses at this point indicating a trend reversal. This is not however not enough to confirm the pattern and to open a trade.
- Confirm the Exhaustion Gap: The confirmation of an exhaustion gap is the next step to recognize and trade the exhaustion gap. There are 2 methods for confirming the pattern. The first one is by spotting a gap which is in the opposite direction of the exhaustion gap. The opposite force is so strong that the price gaps opposite to the trend when the trend reverses. This sometimes creates an island reversal candle pattern on the chart. Island gaps are two gaps which with the combination of price actions leads to the formation of island reversal patterns. They form in between the two gaps. Island gaps indicate that the island reversal marks a sudden and sharp shift in direction. Island reversals are potent patterns that draw our attention even though they are relatively uncommon. Spotting an opposite gap or even an island reversal candlestick pattern is the strongest confirmation of an exhaustion gap. The second way to confirm the pattern is with a breakout through the opening gap range. The price action breaks the range opposite to the prior trend. This confirms the pattern.
- Open a trade: A trade opens after the confirmation of the validity of the exhaustion gap. The trade has to be opened depending upon the type of exhaustion gap. A short trade position opens if the exhaustion gap is bearish. A bearish exhaustion gap starts to develop at the end of a strong upward trend and there is an upward gap with extreme volume. A long trade position is opened if the exhaustion gap is bullish. A Bullish exhaustion gap begins at the end of a strong bearish trend and there is a downward gap with extreme volume.
- Creation of a Stop Loss Order: The next step of trading an exhaustion gap is the creation of a stop loss order. It is important to use a stop loss order while trading the pattern with a high volatility stock. A stop loss is a type of order that investors or traders use to limit their potential losses in the stock market. It works by automatically selling a security when its price reaches a certain level known as the stop price. This helps traders avoid larger losses if the price of the security continues to drop. The stop is located depending upon the type of an exhaustion gap. The stop is located below the bottom created at the time of the reversal if it is a bullish exhaustion gap. The stop must be located above the top created during the reversal if it has a bearish exhaustion gap which is usually traded short.
- Exiting the trade: The classical gap trading approach suggests that exiting the trades when the price action completes a move equal to the size of the gap. This means that when trading the pattern the trader is likely entering a position right at the beginning of a new trend. A conservative trader exits the position at a price move equal to the size of the gap. Monitoring price action and support or resistance levels is taken by a risk trader to get out of the trade.
The five methods that utilize an exhaustion gap involve risk and is made more efficient if more technical tools and indicators are brought into play. The traders must choose to evaluate the effect the news has on the market and how much impact it will follow before acting on it.
What trading strategy is good for exhaustion gaps?
One of the best strategies for trading an exhaustion gap is using indicators. Traders use indicators, like RSI to ascertain price points and make informed trading decisions.

An overbought Relative Strength Index ( RSI) is used to enter shortly after an exhaustion gap. Relative Strength Index ( RSI) being in an overbought or oversold phase indicates that the market is due for reversal. The opposite direction of the Relative Strength Index ( RSI) signals a further confirmation of the trend reversal
A short position trading strategy is adopted when the trend is reversing lower and a long position trading strategy is adopted if the trend is reversing higher.
When is the best time to trade an Exhaustion Gap?
The best time to trade an exhaustion gap is during a bullish reversal. There is a clear bear trend and a downward gap with extreme volume. The market is defined using different trading methods like Gap Fade Strategy, Breakout Strategy etc. The success of the reversal depends on the length of the trend.
The best time to trade also depend on the market and each trader’s preference. Some traders prefer days or weeks when the market is active while others depend on technical indicators or other factors.
Can exhaustion Gaps be traded with indicators?
Yes, Exhaustion Gaps are traded with indicators. Traders use tools such as the EMA, Relative Strength index RSI, Bollinger Bands, Fibonacci retracements in combination with gaps. This is used to ascertain key price points and inform the trader’s decisions. The EMA is a technical chart indicator that identifies the overall trend of the market. A bullish exhaustion gap that occurs above EMA suggests that the trend is likelyto continue higher. The RSI is a momentum indicator used in technical analysis and indicates market reversals. Bollinger Bands and Fibonacci retracements are used to identify support and resistance level in the markets.
Can exhaustion Gaps be combined with Relative Strength Index?
Yes, exhaustion gaps are combined with RSI. RSI is considered as a broader trading strategy and is a useful tool for exhaustion gap trading. RSI in the overbought or oversold phase indicates that the market is due for reversal.
What is an example of Exhaustion Gaps in Trading?
Here is an example of bearish exhaustion trade. A bearish exhaustion trade starts with a bullish trend, bullish gap and a bearish reversal.

The image here starts with a bullish trend marked by a green bullish arrow on the chart. The stock creates a bullish gap in the direction of the trend. The trading volume is very low but the stocks still keep getting higher. The price action then reverses when the volumes are increasing. The bearish exhaustion gap is confirmed when the price action breaks its lower level. The stock has to be sold at this point because of the breakout through the gap low. The stop loss order was to be located at the top above the gap. The price creates lower highs on the way down which indicates a bearish trend. The next phase is when the price’s high gets broken upwards suddenly. This signals that the trade has to be closed.
What are the advantages of Exhaustion gaps?
The below listed advantages of exhaustion gaps indicate how they are used by traders to take profitable trades. The five advantages of exhaustion gaps are listed below.
- Indication of Trend Reversal: Exhaustion Gaps indicate trend reversals. This provides traders an opportunity to enter trade in an opposite direction which maximizes the profit.
- Active market: An exhaustion gap creates an active market as more sellers and buyers enter or exit the market. An exhaustion gap creates opportunity for traders who want to participate in the early stages of a new trend.
- Technical indicators: Technical indicators are used to identify and confirm potential reversal signals and price actions. Technical indicators are used as a broader trading strategy rather than a single indicator. This provides a proper view of the market to the traders.
- Determination of entry and exit points: An exhaustion gap helps in determining the entry and exit points. This helps the traders decide their trading strategy as short position or long position depending on the market.
- Easy to trade: An exhaustion trade is easy to trade with careful observation. It is identified easily by observing low volumes during a gap and increasing volumes during reversals.
The five advantages of an exhaustion gap provide clear insights for the traders. Understanding the advantages and incorporating it into a trading strategy helps the traders and investors get profitable traders and also help in managing the risk effectively in the stock market.
What are the disadvantages of Exhaustion gaps?
Besides the benefits, there are disadvantages of exhaustion gaps that also need to be known. The five disadvantages of exhaustion gap that let traders know their limitations are listed below.
- Mistaken for runaway gaps: An exhaustion gap is easily mistaken for a runaway gap. Traders have to carefully observe and keep an eye on the volume of the stock. It has to be compared with the average volume of that stock to differentiate exhaustion gaps and runaway gaps.
- Dangerous: Exhaustion Gaps are dangerous for traders new to the stock market as they are likely to find it difficult to spot as it requires careful analysis of market conditions, trading volume and technical indicators. Traders have to be cautious with these gaps as they typically happen in a state of panic.
- Market Volatility: Exhaustion Gap creates market volatility. This makes it challenging for the traders to invest and manage risk.
- Technical Analysis : Exhaustion Gap in technical analysis should be in combination with a technical indicator inorder to confirm the trend signals.
- Aggressive: Exhaustion Gap is aggressive to the upside and downside. The stock trading is above the average daily volume and the price drop will break the most recent trend
Exhaustion gaps are volatile and they lead to significant losses. Traders and Investors must not solely rely on an exhaustion gap as a trading signal. It is important to assess the disadvantages before incorporating an exhaustion gap into the trading strategy.
What is the difference between Exhaustion Gaps and other types of Gaps?
There are mainly 4 other types of gaps: Breakaway Gap, Runaway Gap, Common Gap, Island Gap. These are 4 different types of gaps that appear at different stages of the trend. The important factor here is to be able to distinguish among them in order to provide useful and profitable market insights.
- Breakaway Gap vs Exhaustion Gap:
| Breakaway Gap | Exhaustion Gap |
| A breakaway gap is one that occurs at the beginning of a trend. | An exhaustion Gap occurs at the end of a trend. |
| A breakaway gap indicates that the price of the stock gaps over a support or resistance level. It is like a breakout pattern but here the actual breakout happens in the form of a gap. | 2) An exhaustion gap indicates a change in the market sentiment. The market experiences a gap in price which acts as a break in the previous trend. |
| Breakaway gaps have high trading volume and occur after a period of market indecision. | 3) An Exhaustion gap has lower trading volume than breakaway gaps and occur after a period of sustained market movement. |
2. Runaway Gap vs Exhaustion Gap:
| Runaway Gap | Exhaustion Gap |
|---|---|
| A runaway gap occurs along the trend line i.e. in the middle of an existing trend. | An exhaustion Gap occurs at the end of a trend. |
| A runaway gap indicates a strong trend and it will continue for a while. | 2) An exhaustion Gap indicates that a reversal may occur. |
3. Common Gap vs Exhaustion Gap:
| Common Gap | Exhaustion Gap |
| Common gaps occur randomly in the price chart without any specific price pattern. | An exhaustion Gap occurs at the end of a trend. |
| Common gaps do not carry as much significance for market analysis and they get filled in a short period of time | 2) An exhaustion Gap is a potential sign of trend reversal and it is likely to get filled. |
4. Island Gap vs Exhaustion Gap:
| Island Gap | Exhaustion Gap |
| An island gap occurs when price gaps up or down and then remains within a range for a period of time before experiencing a second gap in the opposite direction. | An exhaustion Gap occurs at the end of a trend. |
| An island gap is seen as a stronger signal of a trend reversal than an exhaustion gap. | 2) An exhaustion Gap signals that a reversal may occur. |
It is important to understand the different types of gaps in order to identify them correctly. Understanding their characteristics and identifying them helps traders and investors make informed trading decisions.
Arjun is a seasoned stock market content expert with over 7 years of experience in stock market, technical & fundamental analysis. Since 2020, he has been a key contributor to Strike platform. Arjun is an active stock market investor with his in-depth stock market analysis knowledge. Arjun is also an certified stock market researcher from Indiacharts, mentored by Rohit Srivastava.
Shivam is a stock market content expert with CFTe certification. He is been trading from last 8 years in indian stock market. He has a vast knowledge in technical analysis, financial market education, product management, risk assessment, derivatives trading & market Research. He won Zerodha 60-Day Challenge thrice in a row. He is being mentored by Rohit Srivastava, Indiacharts.
Leave a Reply


Recently Published


More in this topic

Join the stock market revolution.
Get ahead of the learning curve, with knowledge delivered straight to your inbox. No spam, we keep it simple.
Comments