Bullish Kicker Candlestick: Definition, Formation, and Trading
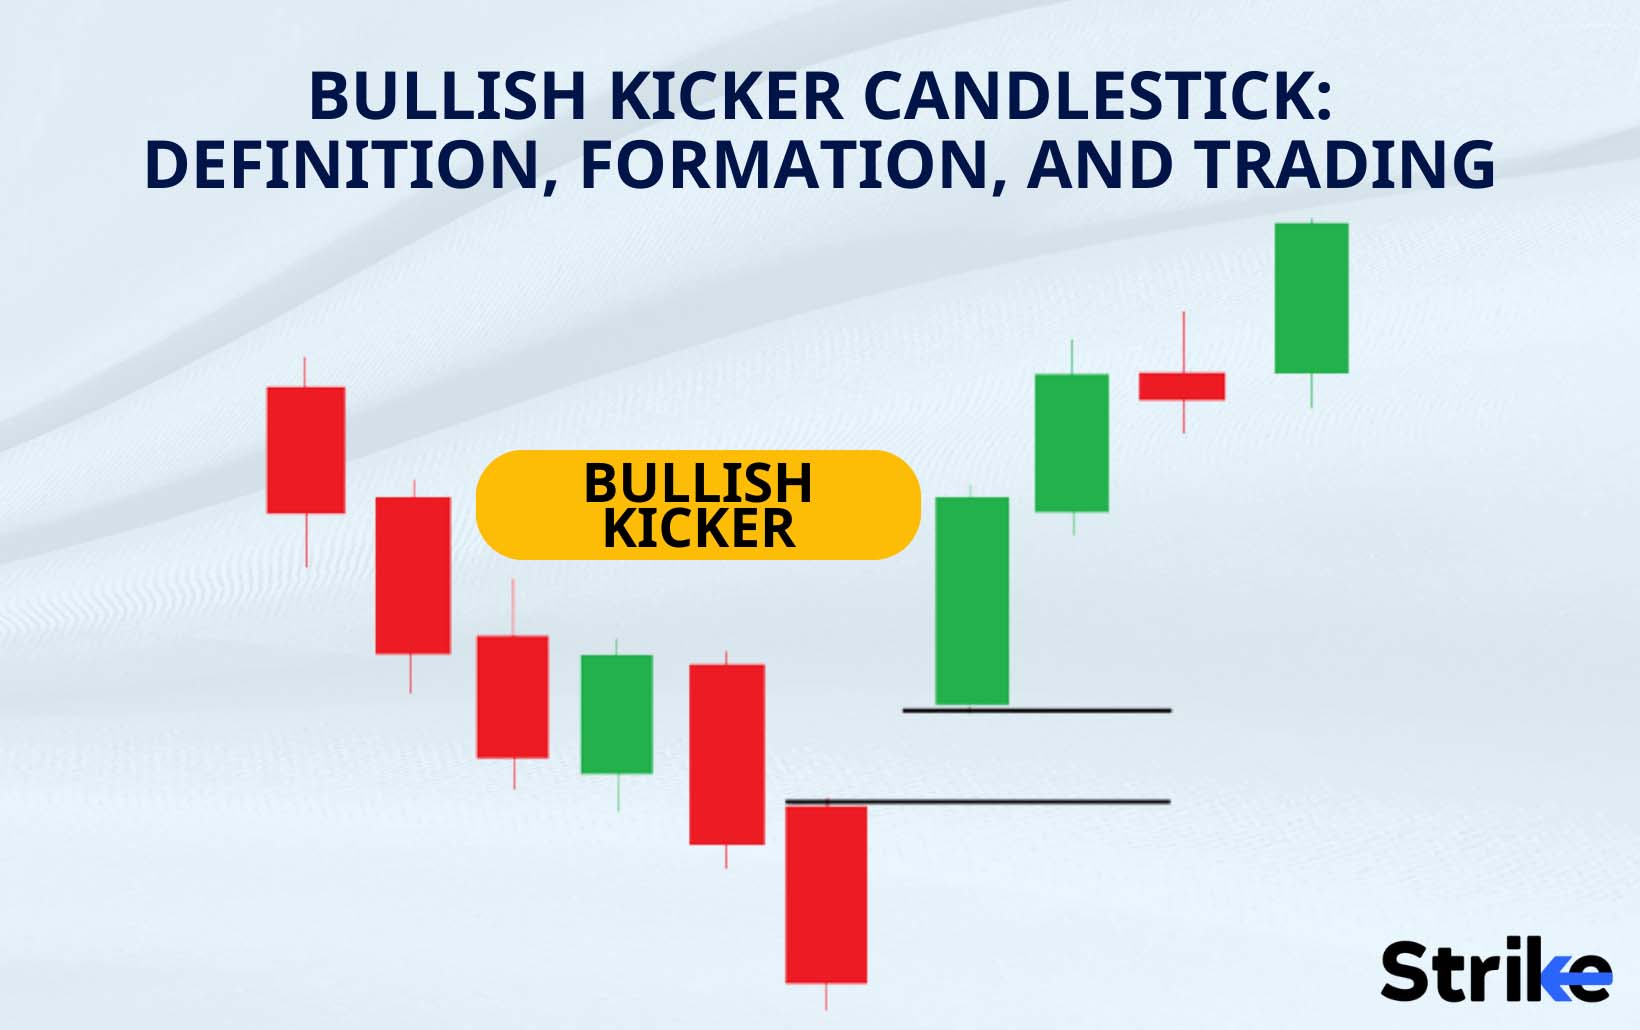
Table of content show
The bullish kicker is a trend-signalling candlestick pattern that appear after a bearish time period. A bullish kicker is usually followed by a period of growth. Investors use bullish kicker as an identifier for buy signals mainly to make the most of an expected market bull.
The bullish kicker is a part of ‘kicker’ candlestick patterns that are simple and single-edged. Kicker patterns are limited to showing only one trend. A bearish kicker indicates a bearish trend in contrast to a bullish kicker.
The bullish kicker candlestick pattern is widely used by traders along with other technical indicators to identify and trade in a bullish market.
What does a Bullish Kicker Candlestick mean?
The identification of the bullish candlestick pattern means an upcoming bullish trend. The Bullish Kicker Candlestick pattern is regarded as a strong bullish signal, indicating a sudden shift in market sentiment from bearish to bullish. The long candlestick indicates that there is strong selling pressure in the market, but the fact that it opens above the previous day’s closing price indicates that there is even stronger buying pressure, causing the price to rise sharply. See the image to understand how the pattern looks.

This pattern is frequently used by traders to identify potential buying opportunities because it indicates that a bullish period is imminent.
How is the Bullish Kicker formed?
A Bullish Kicker is formed when a long bearish candlestick is followed by an even longer bullish candlestick that opens above the previous day’s closing price. The long bullish candlestick indicates strong selling pressure in the market, but the fact that it opens above the previous day’s closing price suggests that the buying pressure is even stronger, which causes the price to rise sharply. This sudden shift in market sentiment from bearish to bullish is what makes the Bullish Kicker a strong bullish signal. Traders often use this pattern to identify potential buying opportunities.

An example of the bullish kicker is above. You can see here that a long red (bearish) candle is formed. But there is an even longer green (bullish) candle. This formation is formed when the opening price of the second day is higher than the high price of the first day. This pattern is considered to be one of the strongest bullish reversal signals in candlestick charting
Does Bullish Kicker Candlestick only form during Downtrend?
No, the Bullish Kicker Candlestick pattern usually appears during a downtrend, but it can also appear during a consolidation period or even an uptrend. The key point to remember is that the pattern represents a sudden shift in market sentiment from bearish to bullish, which can happen in any market condition. But one important thing to understand here is that a strong bullish trend is only signaled when the formation is visible during a downtrend. A bullish kicker formed during an uptrend can be insignificant and even a false signal. Traders usually avoid bullish kickers unless formed during a downtrend.
What does it mean if a Bullish Kicker Candlestick Pattern formed in Uptrend?
It is an indication that the uptrend will continue or even accelerate if a Bullish Kicker Candlestick Pattern forms during an uptrend. The pattern suggests that, despite the existing bullish trend, there was a sudden surge of buying pressure, causing the price to rise even further. This could be a sign of strong bullish market sentiment, and traders use this pattern as a potential signal to enter a long position.
Assume the trader notices a Bullish Kicker pattern on Reliance Industry Limited, (RIL’s) candlestick chart, which consists of a bearish candle followed by a bullish candle that gaps up. This is interpreted by the trader as a strong signal of bullish sentiment, and he decides to open a long position in RIL. The pattern will look similar to the one in the image.

The trader places a stop-loss order just below the low of the pattern’s first candle to manage risk, as a move below this level would invalidate the bullish signal. The trader also establishes a profit target based on their risk-reward ratio and exits the position when it is met.
How to identify Bullish Kicker?
A Bullish Kicker Candlestick pattern is identified by looking for two candles on a price chart. The first candle is a long red or black candle, which indicates a bearish trend. The second candle, which should appear immediately after the first candle, is a long white or green candle that completely engulfs the first candle. See the image below.

This sudden shift from bearish to bullish sentiment is what makes this pattern so significant. Traders often look for high trading volumes and a gap up between the first and second candles to confirm the pattern.
The Bullish Kicker pattern is overlooked during a strong bullish trend because the market is already moving upward, and traders will not perceive a single bullish candle as significant. Traders prefer to look for multiple bullish signals or other confirmation factors to support their trading decisions during such a time. A bullish Kicker pattern should be used in conjunction with other technical indicators and charting tools to improve the accuracy of the signal.
How to use Bullish Kicker Candlestick Pattern in Technical Analysis??
The first step in employing a bullish candlestick pattern in technical analysis is to recognise it, which occurs when a long red candlestick is followed by a long green candlestick that opens above the previous day’s high.
Other technical indicators, such as volume, momentum, and trend analysis, should be used to confirm the pattern. Traders can enter a long position at the opening of the third candlestick once the pattern has been confirmed. To minimize potential losses, set a stop loss order below the low of the previous red candlestick.
Traders should set a predetermined level when it comes to profit-takings, such as a resistance level or a risk-reward ratio target. Keep in mind that no single indicator or pattern can guarantee profitable trades. Traders should employ a variety of technical analysis tools and manage risk by utilizing proper position sizing and stop loss orders.
What is the success rate of the Bullish Kicker Candlestick Pattern?
The success rate of the Bullish Kicker Candlestick Pattern varies depending on factors, including market conditions, trading volume, and other technical and fundamental factors. Some traders believe that the Bullish Kicker Candlestick Pattern is a strong indicator of a potential upward trend continuation. It’s important to remember that no trading signal is perfect, and traders should always take into account other technical and fundamental factors before making any investment decisions.
How reliable is the Bullish Kicker Candlestick Pattern?
The accuracy of the Bullish Kicker Candlestick Pattern is affected by factors including the state of the market, the volume of trading, and various other technical and fundamental aspects. But most market participants view it as a robust indication of a possible continuation of an upward trend. But a bullish kicker pattern can’t use the same level of reliability when it comes to indications during a bearish period.
How to Increase Bullish Kicker Candlestick Pattern’s Accuracy?
Bullish kicker candlestick’s accuracy is increased by considering volume, volatility and the strength of the pattern at the time of appearance. Read more to find more about each method.
1. Include Constraints on the Volume
Bullish kicker pattern accompanied by a high trading volume is an indication of a significant shift in investor sentiment towards the stock, which can increase the likelihood of a potential upward trend continuation. Traders should always use multiple technical and fundamental indicators in conjunction with risk management strategies to maximize their chances of success.
2. Consider the Volatility
Traders can use technical indicators like Bollinger Bands or Average True Range (ATR) to measure the stock’s volatility in order to consider it in conjunction with the Bullish Kicker Candlestick Pattern. These indicators can also be used to determine the stock’s volatility. A Bullish Kicker Candlestick Pattern appearing alongside high volatility is interpreted as a sign of a significant opportunity for the trend to continue. Traders also use other technical indicators, such as the Relative Strength Index (RSI) or the Moving Average Convergence Divergence (MACD), to confirm the possible continuation of the trend that is signaled by the Bullish Kicker Candlestick Pattern.
3. Identify the Pattern’s Strength
Traders look for additional technical indicators to confirm the potential continuation of the trend in order to determine whether or not the Bullish Kicker Candlestick Pattern has a high degree of predictive power. Traders could be on the lookout for high trading volume, strong momentum, and bullish confirmation from other technical indicators such as the Relative Strength Index (RSI) or Moving Average Convergence Divergence (MACD) (MACD). Investors might want to investigate the stock’s fundamentals, such as earnings reports or news events in order to validate the possibility that the trend will continue.
How to trade with the Bullish Kicker Pattern?
Traders employ bullish market strategies once the bullish kicker pattern is spotted in the price graph of a stock. You can use technical analysis to identify a good entry point for the stock. Looking for support levels or consolidation patterns that indicate a good time to enter the trade is one example. A stop loss must be set next. You will exit the trade at this level if the stock price moves against you. Setting a stop loss allows you to limit your losses in the event that the stock does not perform as expected.
It is also critical to establish a profit target. This is the point at which you will profit. This is based on technical or fundamental analysis. Keep a close eye on the stock’s performance once you’ve entered the trade. Keep an eye out for any changes in market sentiment or company-specific news that may have an impact on the stock’s price.
What is the best time frame to trade Bullish Kicker Candlestick?
Individual trading styles and preferences will determine the best time frame to trade the Bullish Kicker Candlestick pattern. Short-term traders use lower time frames such as 5-minute or 15-minute charts, while long-term traders use higher time frames such as daily or weekly charts.
Can the Bullish Kicker Candlestick Pattern Be Applied to Trading Strategies?
Yes, traders use the Bullish Kicker Candlestick pattern for their trading strategies. This is a bullish reversal pattern that is used to identify potential market buying opportunities. Bullish kicker indicates that there has been a shift in market sentiment and that buyers have taken control of the market. Traders confirm the trend and identify potential entry and exit points by using the Bullish Kicker Candlestick pattern in conjunction with other technical indicators and fundamental analysis. Some traders may also use the pattern as a signal to place a stop-loss order, limiting potential losses if the trade does not go as planned.
How to use Bullish Kicker Candlestick with Moving Average?
Traders can use a moving average to confirm the trend when the Bullish Kicker Candlestick pattern appears. An asset’s price that is higher than the moving average is interpreted as confirmation of an uptrend and a potential buying opportunity. Price falling below the moving average is interpreted as confirmation of a downward trend and a potential selling opportunity. Traders can test different moving averages, such as the 50-day, 100-day, and 200-day moving averages, to see which one works best for their trading style and preferences.
How to use Bullish Kicker Candlestick together with Relative Strength Index (RSI)?
Traders can use the Relative Strength Index (RSI) to look for confirmation of the Bullish Kicker Candlestick pattern when it appears. Relative Strength Index (RSI) is lower than the oversold level of 30 is interpreted as confirmation of a possible buying opportunity. RSI is at or above the level of 70 indicates that the market is considered to be overbought. This may be interpreted as confirmation of a possible opportunity to sell.
How to use Bullish Kicker with Low ADX-Value?
The combination of the appearance of the Bullish Kicker Candlestick pattern and a low value for the ADX is interpreted as a sign that the trend is not strong and may be changing direction. Monitoring the ADX value is one way for traders to look for confirmation of a possible trend reversal in the market. The value of the ADX rising after the appearance of the Bullish Kicker Candlestick pattern is interpreted as a sign that the trend is becoming stronger and could be a good opportunity for buying.
Is Bullish Kicker Candlestick Pattern profitable?
Yes, the Bullish Kicker Candlestick Pattern is a type of reversal pattern that is profitable if used correctly in combination with other technical analysis tools and risk management strategies. But it is important to remember that no trading strategy is 100% profitable and there is always a risk of loss in trading. Traders can use the Bullish Kicker Candlestick Pattern in combination with other technical indicators, such as the Relative Strength Index (RSI) or the Average Directional Index (ADX), to confirm potential buying opportunities. Traders should always use risk management strategies and have a well-diversified portfolio to minimize potential losses.
Arjun is a seasoned stock market content expert with over 7 years of experience in stock market, technical & fundamental analysis. Since 2020, he has been a key contributor to Strike platform. Arjun is an active stock market investor with his in-depth stock market analysis knowledge. Arjun is also an certified stock market researcher from Indiacharts, mentored by Rohit Srivastava.
Shivam is a stock market content expert with CFTe certification. He is been trading from last 8 years in indian stock market. He has a vast knowledge in technical analysis, financial market education, product management, risk assessment, derivatives trading & market Research. He won Zerodha 60-Day Challenge thrice in a row. He is being mentored by Rohit Srivastava, Indiacharts.
Leave a Reply


Recently Published


More in this topic


Join the stock market revolution.
Get ahead of the learning curve, with knowledge delivered straight to your inbox. No spam, we keep it simple.
Comments