Speed and Velocity
The movement of objects can be described using distance-time graphs and velocity-time graphs. Remember that velocity is simply speed in a given direction.
Distance-time graphs
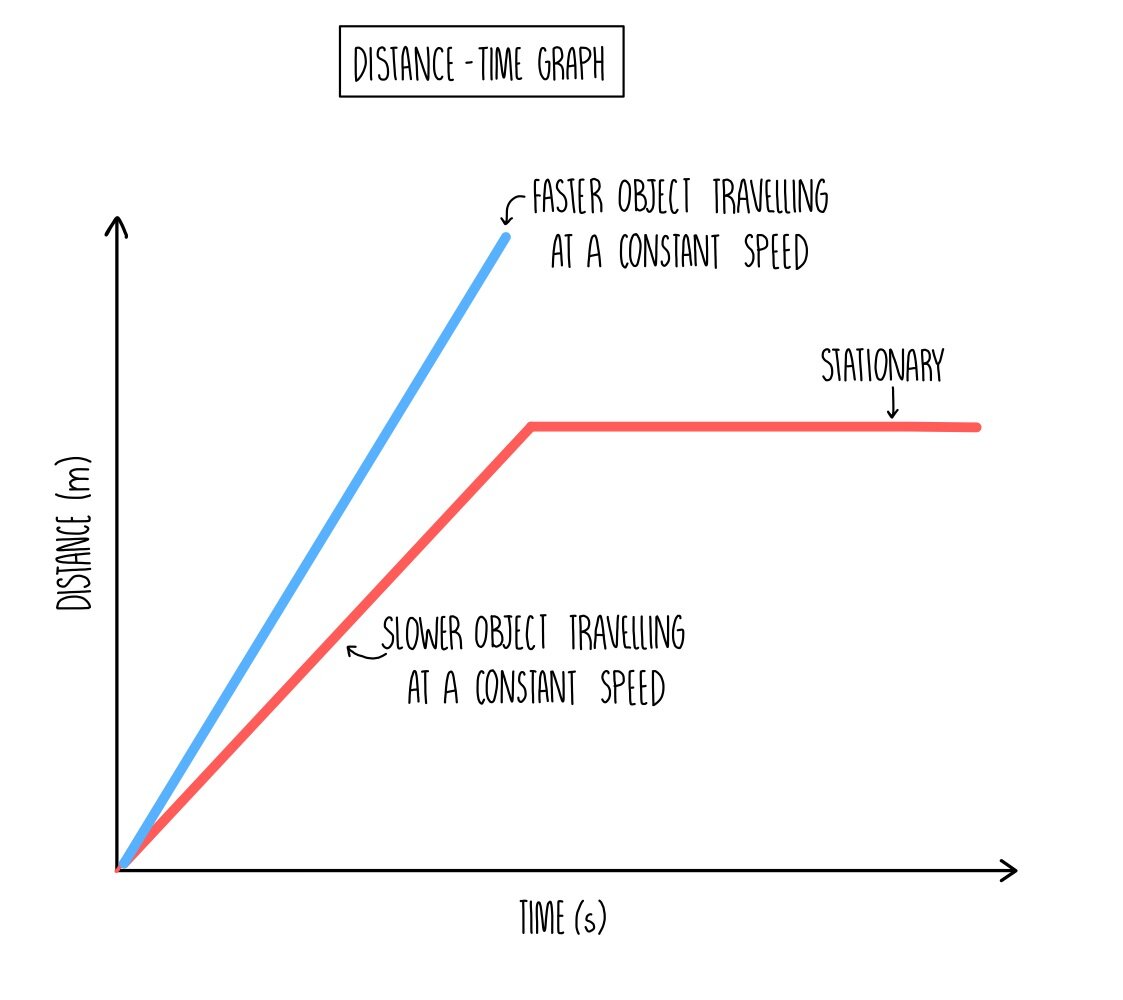
Distance-time graphs show how a distance gained by a moving object changes over time. The graph to the right shows the movement of two objects. The blue object travels fastest, shown by the steeper gradient compared to the red object.
For distance-time graphs:
The gradient of the line is proportional to speed - the steeper the line, the faster the object
Horizontal lines indicate that the object is stationary
Calculating speed
We can calculate speed if we know the distance travelled and the time taken using the following equation:
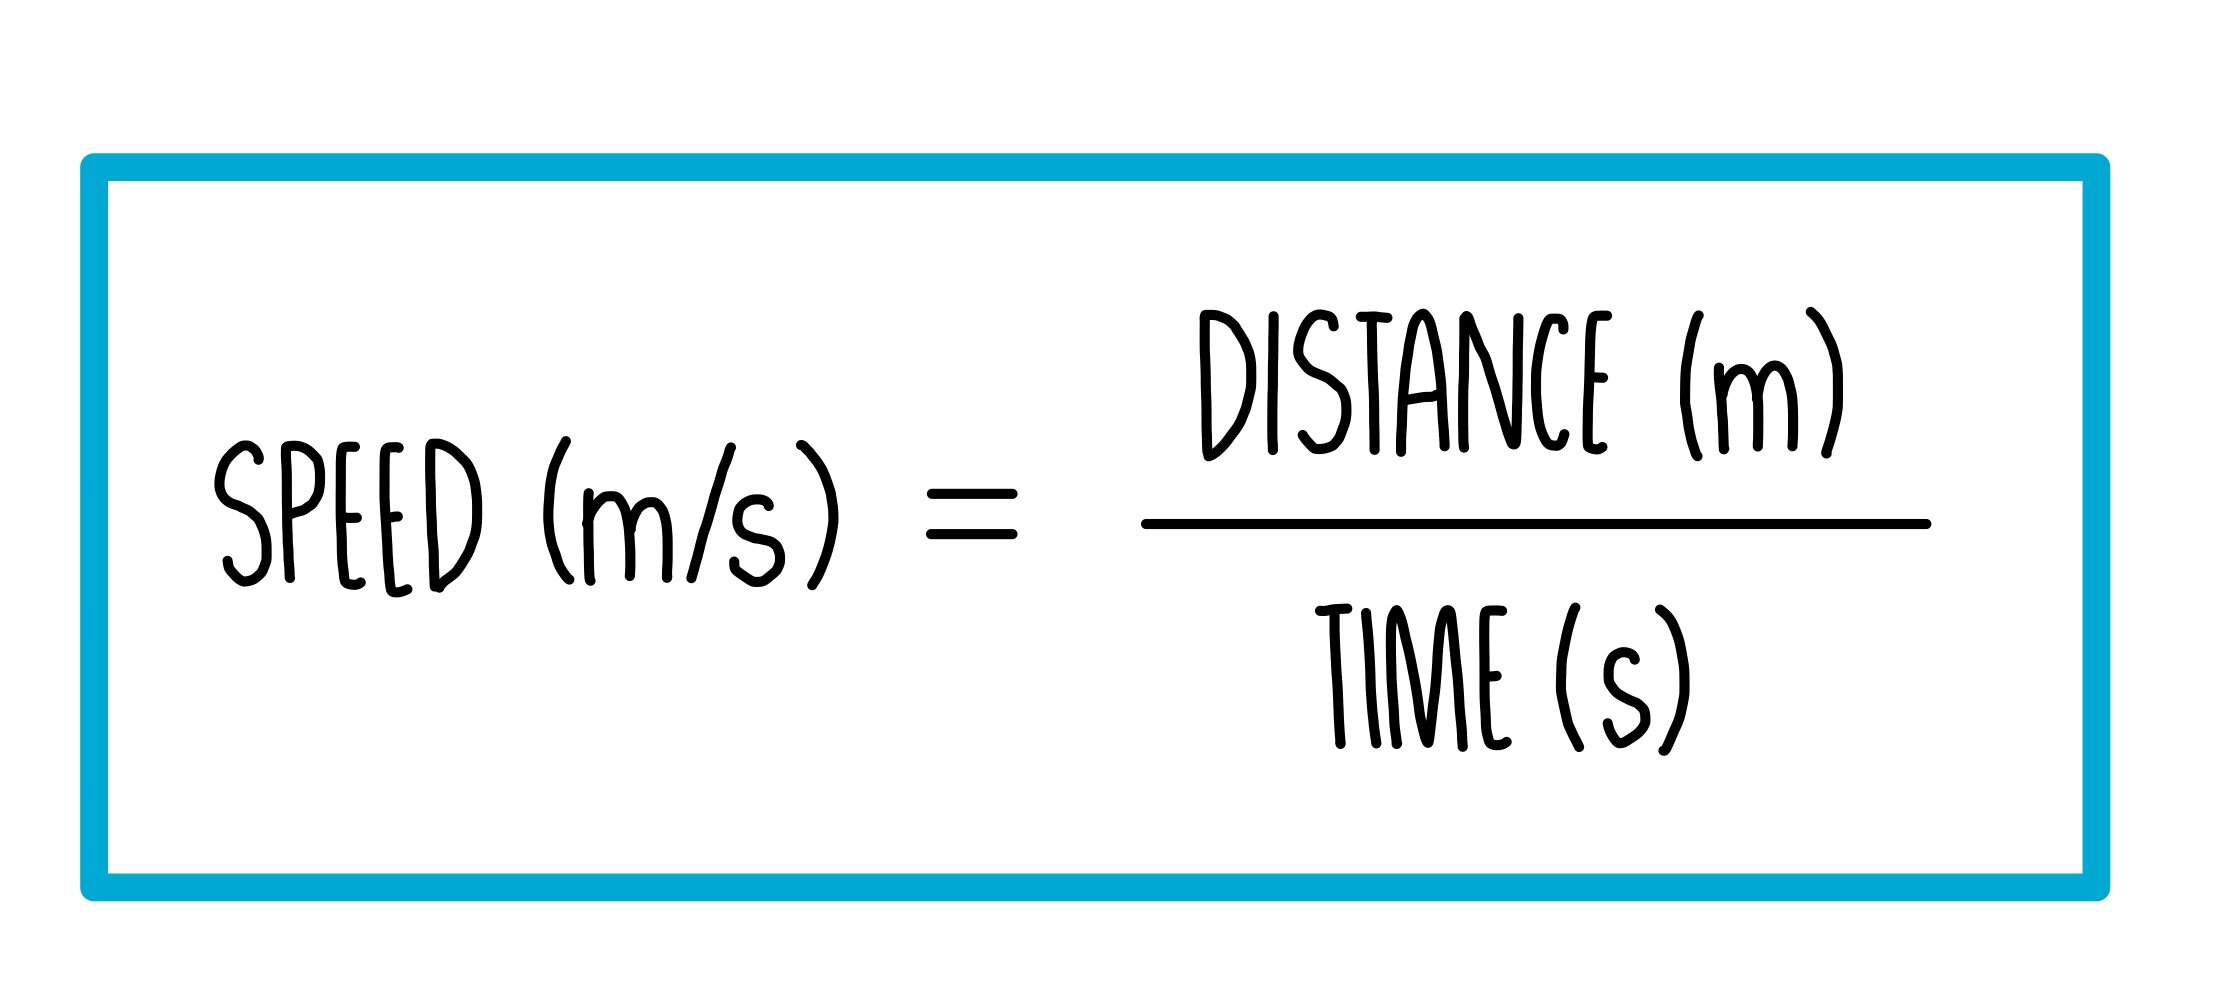
Various units can be used for speed but most commonly we use meters per second (m/s). For faster-moving objects, it is more appropriate to use larger units of kilometers per hour (km/h).
Worked example:
Mo Farah achieves his personal best at a 10 kilometer race with a time of 27 minutes and 44 seconds. What speed was he running in meters per second (m/s)?
Firstly, we need to convert 10 kilometers into meters by multiplying by 1000. This gives us 10,000 meters.
We also need to convert his time to seconds so we do (60 x 27) + 44 = 1664
We know that speed is equal to distance divided by the time taken, so we do 10,000 / 1664 which gives us a speedy 6 m/s.
Velocity
Velocity is a basically just a fancy word for talking about speed in a certain direction. Speed is a scalar quantity because it does not take direction into account, whereas velocity is a vector quantity.
Acceleration
When the speed of an object changes, it is accelerating (or decelerating). It is calculated by dividing the change in velocity by the time taken.
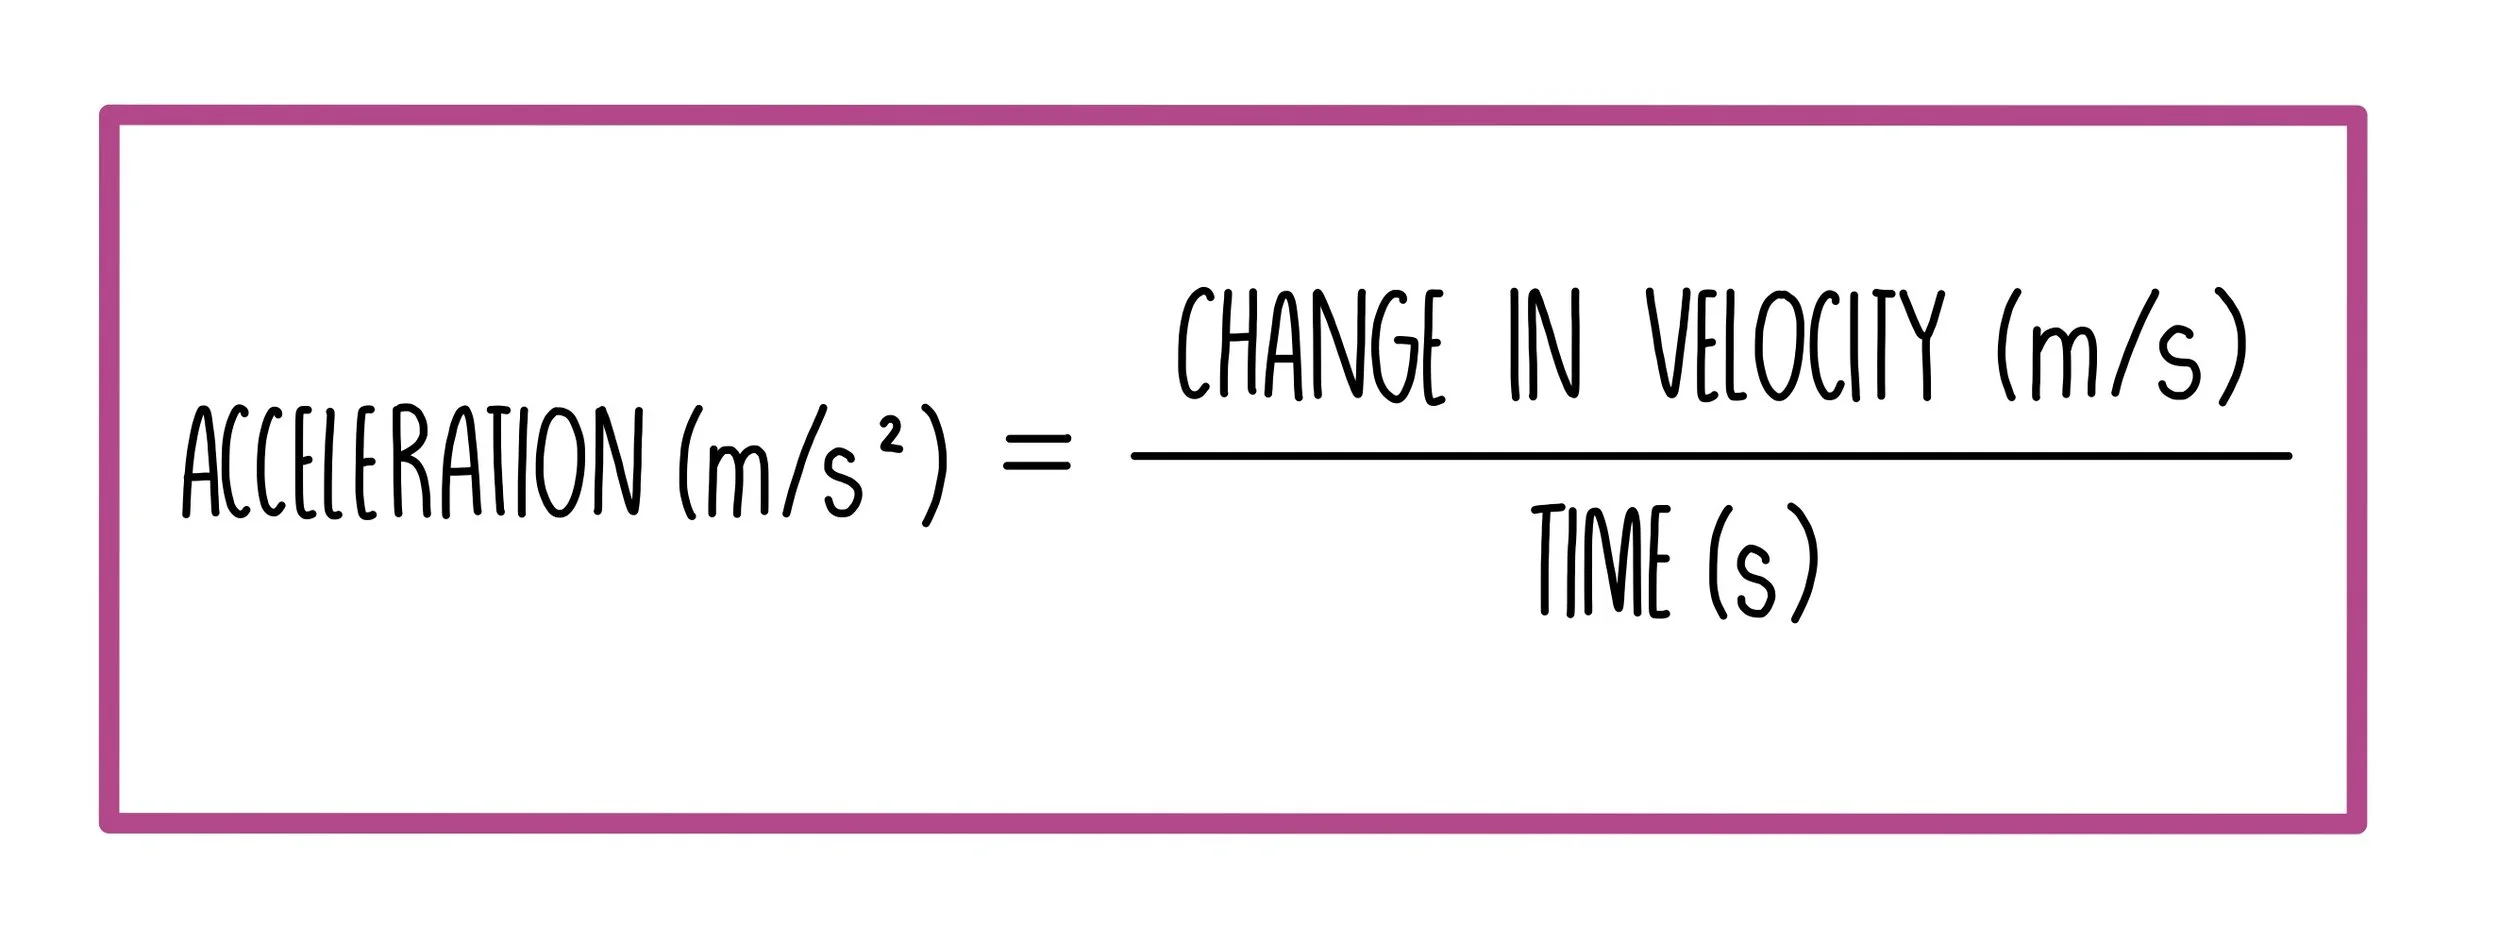
The units of acceleration are meters per second squared (m/s2).
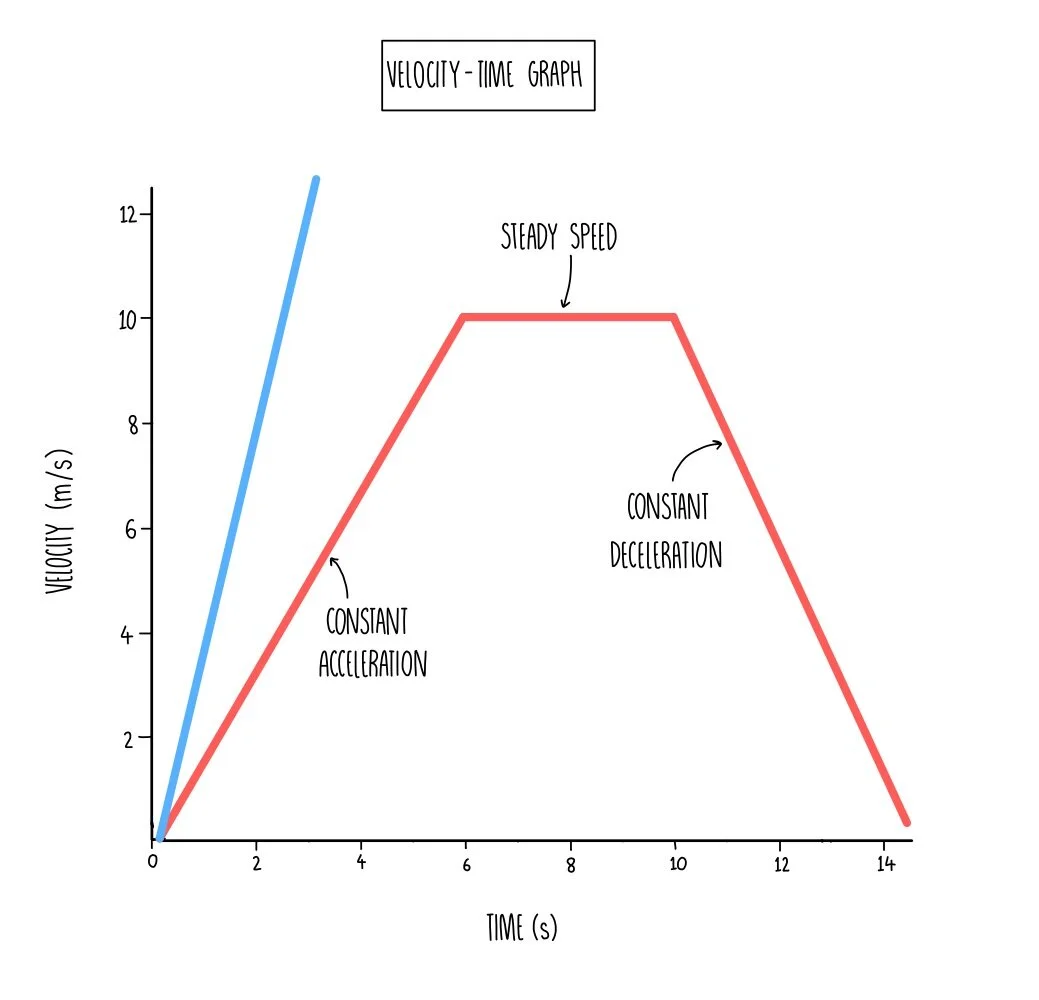
The acceleration of an object can be visualised using a velocity-time graph. If you look at the graph to the right, you can see that the first part of the graph is a sloped straight line, which means that both objects are accelerating. After six seconds the red object reaches a steady speed before decelerating at 11 seconds.
For velocity time graphs:
The gradient of the lines is proportional to the acceleration - the steeper the gradient, the faster the change in speed
Straight lines mean a constant speed
The area underneath the graph tells us the distance travelled
Worked example:
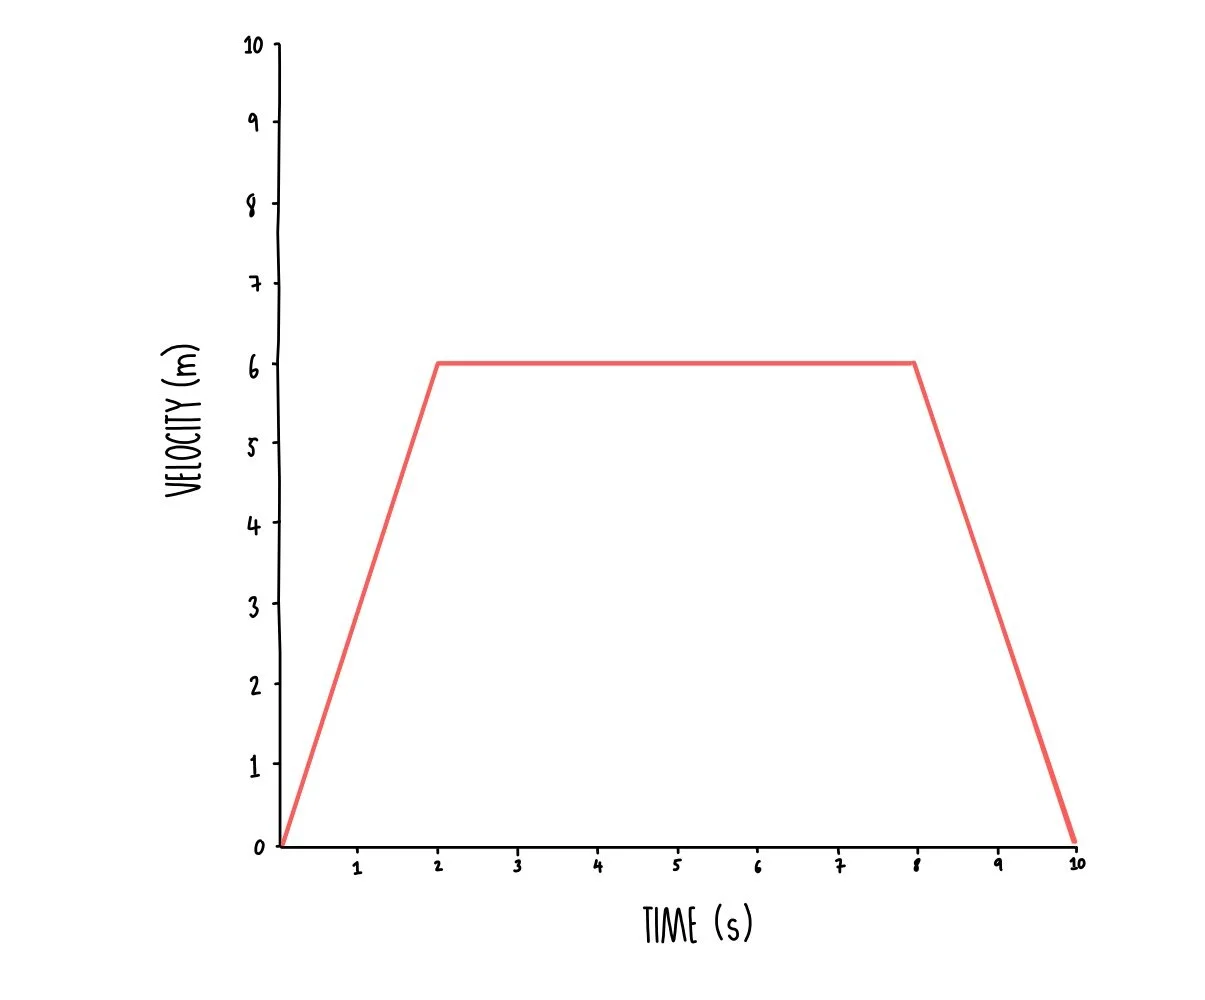
The velocity-time graph on the right shows a rabbit running across a field. Using the graph calculate:
The initial acceleration
Total distance travelled
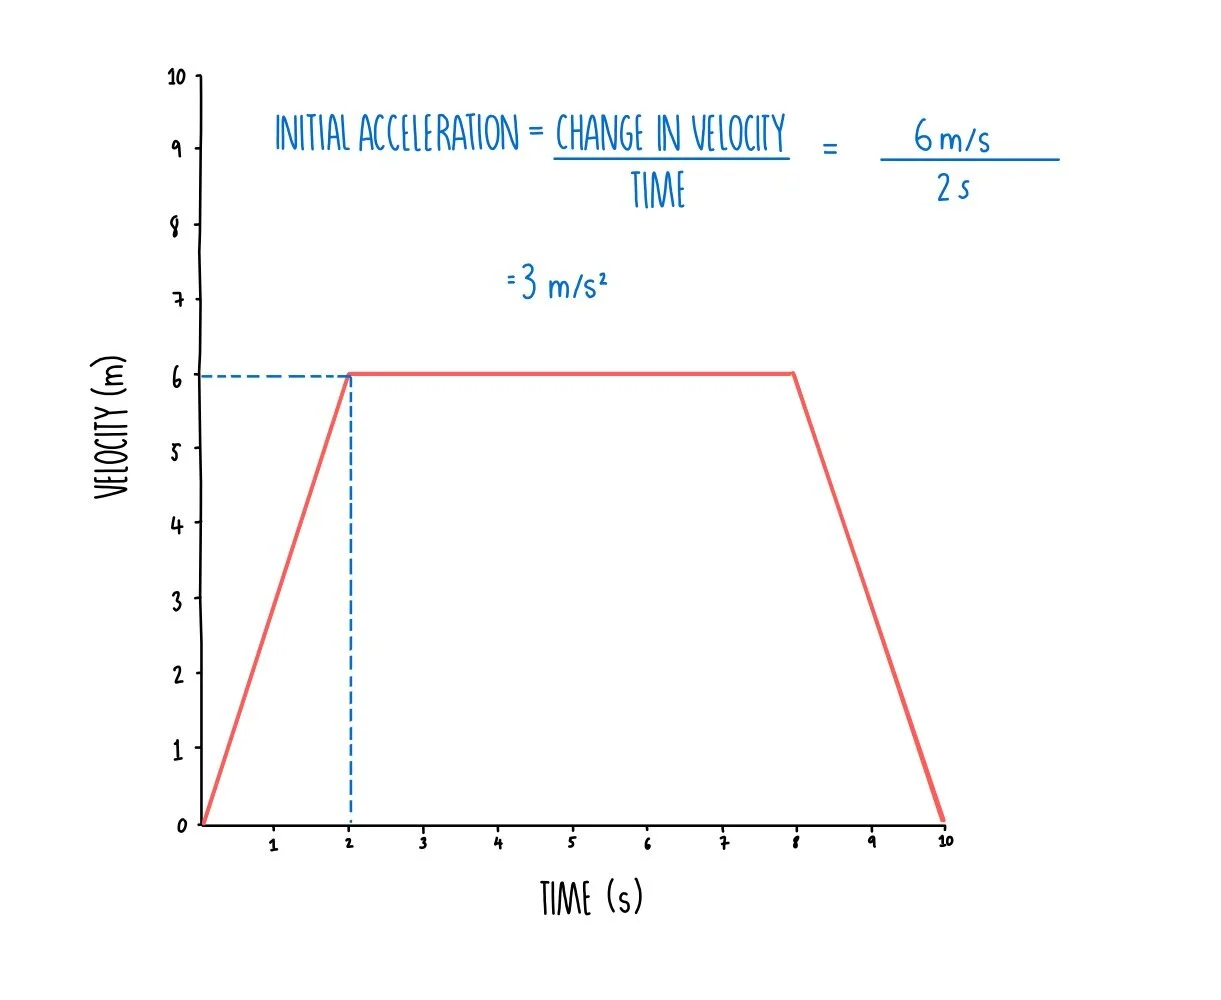
- We calculate initial acceleration by calculating the change in velocity over time for the first sloped straight line.
- We can see that the rabbit has travelled 6 meters in 2 seconds.
- Initial acceleration = 6 / 2 = 3 m/s2
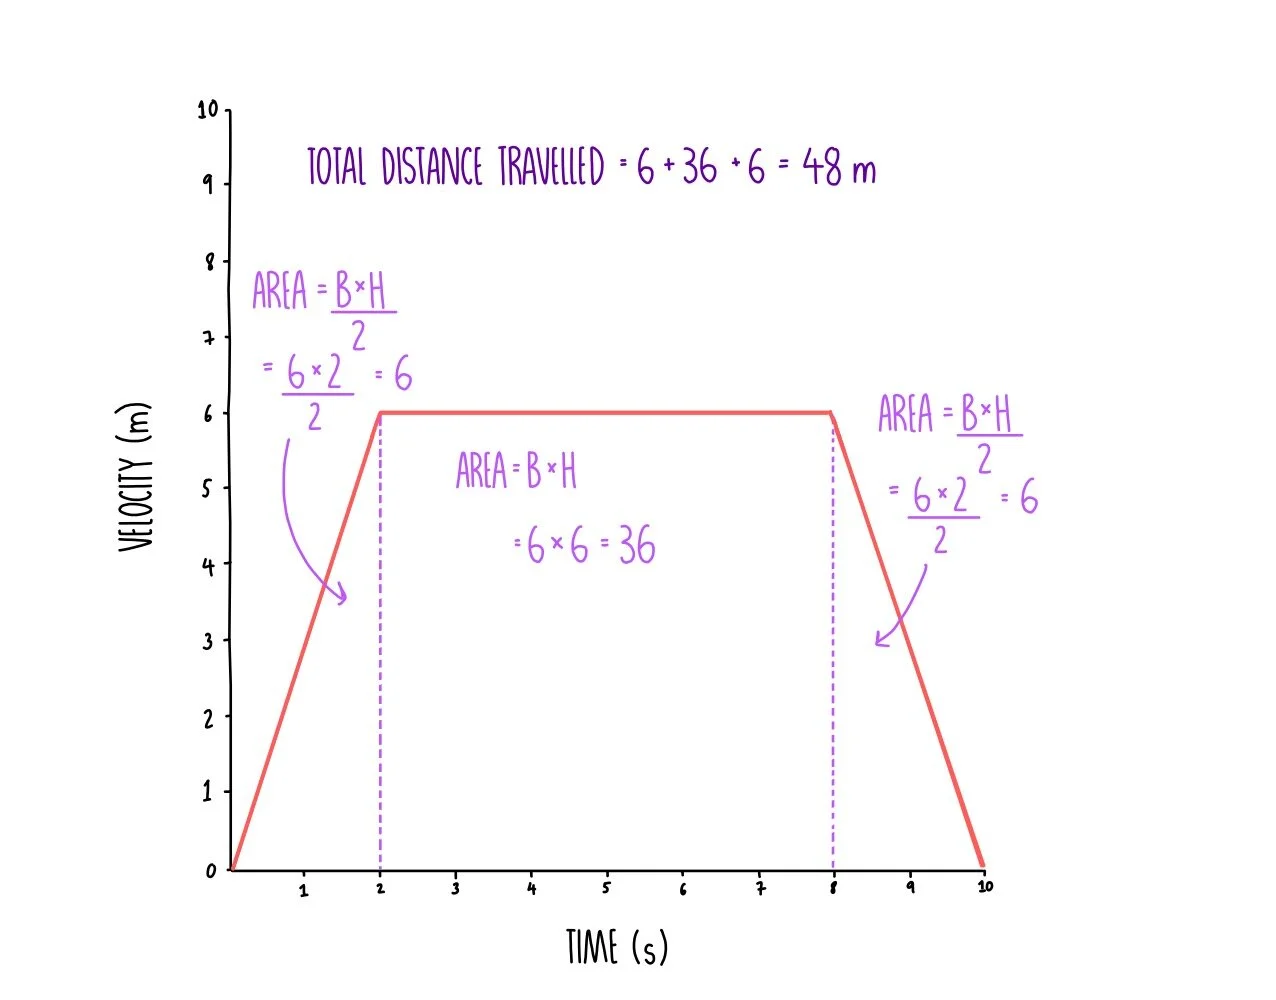
- We also know that the area underneath the graph is equal to the distance travelled.
- The easiest way to do this is to divide the graph into smaller triangles and rectangles and to work out the area of each before adding together.
- Remember that the area of a triangle is (base x height)/2.
- The area of the two traingles is the same and is calculated as 6 x 2 / 2 = 6.
- The area of the rectangle in the middle is just base x height. 6 x 6 = 36.
- Adding this all together gives us 6 + 36 + 6 = 48 meters.
- So total distance travelled = 48 m
Final speed
We can calculate the final speed of an object if we know how fast it was originally travelling (its initial speed) and its acceleration. The equation is:

Worked example
A boulder is thrown 300 meters, from rest, at the top of a cliff. Calculate its final velocity. Acceleration due to gravity is equal to 10 m/s2.
- Final speed2 = 02 + (2 x 10 x 300)
- Final speed2 = 6000
- Final speed = square root (6000) = 77.5 m/s