skip to content
 
A chart of the Indian Ocean showing the temperature of the water, the currents of the air and ocean, directions of the wind, as well as districts of hurricanes, regions of typhoons, and trade routes.

Weather has important implications for trade, commerce and public activities. In the nineteenth century, ship wreckage not only lost valuable cargo but often the lives of its crew and passengers too, making forecasting and mapping weather patterns vital. In the twentieth century, the British Meteorological Office focused on how to improve forecasting for aviation, particularly during the Second World War. Early aircraft were particularly susceptible to wind, rain, and other forms of precipitation. After the War, advances in aviation technology continued to influence the activities of the Met. Office.

Early Weather Mapping

A rain map of Europe
Image 1: A hyterographic or rain map of Europe from Johnston's Physical Atlas (1849) (Wh.5183.16).

In 1854, the Bristol Board of Trade established a meteorological department in order to reduce the number of shipwrecks and to improve navigation routes. Robert FitzRoy (1805-1865), who circumvented the globe with Charles Darwin on the second voyage of HMS Beagle, was appointed Meteorological Statist.

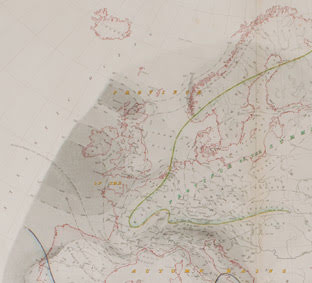
FitzRoy developed a system of forecasting storms based on barometric and cloud readings and implemented a network of storm-warning signals along the British coast. Weather maps greatly appealed to FitzRoy, who wanted to convey weather 'at a glace'. Francis Galton (1822-1911) produced several maps for FitzRoy that charted European weather over periods of months. In his Meteorographica (1863), Galton shared FitzRoy's approach to visualizing and representing meteorological phenomena. He wrote:

"When lists of observations are printed in line and column, they are in too crude a state for employment in weather investigations; after their contents have been sorted into Charts, it becomes possible to comprehend them; but it requires meteorographic Maps to make their meaning apparent at a glance."(1)

Johnston's Physical Atlas

The geographer and cartographer Alexander Keith Johnston (1804-1871) produced his Physical Atlas in 1848, which mapped terrestrial physics, such as magnetic directions, as well as air currents, directions of the winds, trade routes, and districts of hurricanes, typhoons, and monsoons (Images 1 & above).

Johnston's maps were based on the work of Heinrich Berghaus (1797-1884), a German geographer whose Physikalischer Atlas (1838-1848) was heavily influenced by Alexander von Humbolt's unified vision of Nature. Berghaus and Johnston had planned to produce an English volume of the atlas together, but it was Johnston who ended up realising the project.

This kind of 'at a glance' philosophy towards interpretations of weather continued to be championed by FitzRoy's successors at the Meteorological Office. In 1881, then Director Robert Scott (1833-1916) claimed that if out-stations "told us the appearance of the sky and landscape, in addition to sending up their instrumental readings" than the office would be better equipped to issue storm warnings.

Meteorological rocketsondes

Meteorological rocketsonde
Image 2: A Skua meteorological rocketsonde commissioned by the British Meteorological Office, 1968 (Wh.2695).

After WWII, weather forecasts produced by the Meteorological Office began to be increasingly used for civil applications. During the 1950s, the Met Office produced specialised forecasts for pigeon races, seasonal forecasts for farmers, and predicted the likelihood of train disruption from ice on the conductor rail. In particular, problems and safety concerns in military and civil aviation determined a significant portion of the meteorological research conducted.

As aircraft were flown at increasingly higher elevations and for longer distances, understanding atmospheric conditions at these high altitudes was essential for the growing aviation industry. With the development of supersonic aircraft, some theorists originally believed that these planes could fly above the weather; however, it quickly became evident that meteorologists needed to better understand atmospheric conditions even in the upper stratosphere. During the 1950s and 1960s, rockets were developed to propel radiosondes 65km into the stratosphere to gather the required meteorological data.

The Whipple's Skua rocketsonde (Image 2) was launched at the South Uist site located in the Scottish Hebrides. Designed by Bristol Aerojet and R. P. E. Westcott, the meteorological rocket was five inches in diameter and employed a two-stage system.

At launch, the first section of the motor burned for 0.2 seconds and then separated from the main body when 20 metres above the ground. A second motor then burned for over half a minute and launched the rocketsonde 65km into the atmosphere. Just before the rocket began to drop back to Earth, a mechanism released the radiosonde fixed with a parachute.

On its descent, the radiosonde collected meteorological data. The Mullard Space Science Laboratory and The University College of Wales installed instruments to measure ion and electron densities on the re-designed Skua 2 radiosondes, which were launched in 1968. Between 1967 and 1980 more than 500 rockets were successfully deployed at the South Uist site.

References

  1. F. Galton, Meteorographica, (1863), p. 3.

Allison Ksiazkiewicz

Allison Ksiazkiewicz, 'Mapping Weather and Modern Meteorology', Explore Whipple Collections, Whipple Museum of the History of Science, University of Cambridge.

Back to Explore Main Menu

Opening Times

Please note that our lift is currently out of action and we do not have a step-free entrance.

Our maintenance unit is dealing with this urgently, and we hope to resolve within the next two weeks.

We are open five days a week, 12.30 - 16:30.

Monday 12.30 - 16:30

Tuesday 12.30 - 16:30

Wednesday 12.30 - 16:30

Thursday 12.30 - 16:30

Friday 12.30 - 16:30

We hope to see you soon!