PEI History of Storminess - Atlantic Climate Adaptation Solutions
PEI History of Storminess - Atlantic Climate Adaptation Solutions
PEI History of Storminess - Atlantic Climate Adaptation Solutions

You also want an ePaper? Increase the reach of your titles
YUMPU automatically turns print PDFs into web optimized ePapers that Google loves.
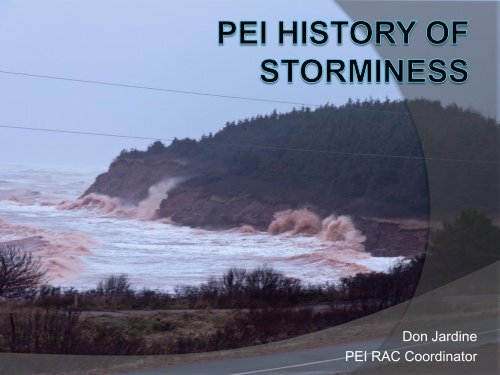
<strong>PEI</strong> and the Weather Islanders love to chat about the weather We start almost every conversation withsome comment about the weather There‟s a reason for this – Our weatherchanges frequently and can change fast We do have a lot <strong>of</strong> storms Historically the majority <strong>of</strong> Islanders madetheir living <strong>of</strong>f the land or on the water. Weather is important to Islanders
So What is it About OurWeather & <strong>Climate</strong>? A search was made to track downhistorical weather and storm events• Environment Canada‟s Website• Newspaper records• Scientific papers• Historical records and magazines (IslandMagazine)• Community Histories• Memories retained by Islanders
Yankee Gale – October 3-5,1851 Tropical Cyclone which lasted 3 days Winds were ENE Heavy rains 74 ships sank <strong>of</strong>f <strong>PEI</strong> 150 lives lost (mainly Americans) Most damage on the Gulf side <strong>of</strong> <strong>PEI</strong>
October 1, 1923 Storm Northerly gale – Hurricane remnant More than 50 bridges washed outacross <strong>PEI</strong> Rail line washed out at Morell and St.Peter‟s Fore dunes at Greenwich washed outand overwash impacted areas 600metres inland.
Ice Storm - 1956 "The Great Ice Storm January 6th, 7th, and 8th, 1956 Report to our Subscribers on Storm Damage andRestoration
Newspaper Records
Historical StormsDay Month Year Type <strong>of</strong> Storm Erosion FloodingPropertyDamageStorm SurgeWind13 Sep 1839 Hurricane X5 Dec 1849 Severe Winter Storm X X3 Oct 1851 Yankee Gale X3-5 Oct 1869 Saxby's Gale X X24 Aug 1873 Storm Surge X X X X25 Jul 1883 Storm X XNov 1898 Postland's Gale X14-15 Sep 1900 Galveston Hurricane X X X X12-13 Oct 1900 Tropical Storm (Extra) X X3 Nov 1922 Northwest Gale X X X2-3 Oct 1923 Hurricane X X X X27 Aug 1924 Hurricane (Category 2) X12 Sep 1932 Tropical Storm X X19 Sep 1932 Tropical Storm (Post) X X X30 Oct 1933 Tropical Storm X X X X26 Aug 1935 Tropical Storm (Post)3 Aug 1937 Tropical Storm (Post) X X16-17 Sep 1940 Hurricane / Tropical Storm X20-23 Sep 1942 Heavy Rainfall (3 day)15-16 Sep 1944 Hurricane / Tropical Storm X22 Oct 1944 Great <strong>Atlantic</strong> Hurricane X X21 Aug 1950 Hurricane Able X X
Historical Storms (2)Day Month Year Type <strong>of</strong> Storm Erosion FloodingPropertyDamage13 Sep 1839 Hurricane XStormSurge5 Dec 1849 Severe Winter Storm X X3 Oct 1851 Yankee Gale X3-5 Oct 1869 Saxby's Gale X X5 Feb 1952 Hurricane (Not Named)8 Sep 1953 Hurricane Carol X11 Sep 1954 Hurricane Edna X21 Sep 1955 Hurricane Ione6-7 Jan 1956 Great 1956 Ice Storm X29 Sep 1958 Hurricane Helene X20 Jun 1959 Escuminac Hurricane X X X X25 Mar 1961 Winter Storm21 Jan 1961 Storm Surge, Kennedy Inaugural Storm1 Apr 1962 Heavy Rainfall Over Snow X X30 Oct 1963 Hurricane Ginny X1-2 Dec 1964 Severe Windstorm X10 Oct 1967 Heavy Rainfall21 Oct 1968 Hurricane Gladys X X X X X28 Jul 1975 Hurricane Blanche X30 Mar 1976 X X7 Sep 1979 Hurricane David X6 Jan 1980Wind
Historical Storms (3)Day Month Year Type <strong>of</strong> Storm Erosion FloodingPropertyDamageStormSurge10 Jan 1982 Storm Surge X X X22-27 Feb 1982 Severe Winter Storm25 Dec 1983 Storm Surge22 Nov 1986 Nor'easter, High Tide, Storm Surge X X2 Aug 1990 Hurricane Bertha X X X1-4 Feb 1992 Severe Snowstorm X16 Sep 1996 Hurricane Hortense X X X9-10 Oct 1996 Hurricane Josephine X27 Nov 1997 Winter Storm5-9 Jan 1998 Ice Storm X28 Apr 1999 Winter Storm X28 Jul 1999 Heavy Rainfall X7 Sep 1999 Heavy Rainfall X X22 Sep 1999 Heavy Rainfall X21 Jan 2000 High Tide, Storm Surge X X X17 Mar 2000 Storm29 Oct 2000 Subtropical Storm X X X X17 Dec 2000 Windstorm X6-7 Jan 2001 Winter Storm X6 Feb 2001 Winter Storm, Storm Surge X19 Sep 2001 Heavy Rainfall X8-9 Nov 2001 Hurricane Noel X X X XWind
Historical Storms (4)Day Month Year Type <strong>of</strong> Storm Erosion Flooding11 Feb 2002 Winter StormPropertyDamage12-13 Sep 2002 Hurricane Gustav X X X2 Feb 2003 Ice Storm X12 Mar 2003 Storm Surge30-31 Mar 2003 Heavy Rainfall XStormSurge29 Sep 2003 Hurricane Juan X X X28 Oct 2003 Storm Surge X X X6-8 Dec 2003 Nor'easter X19 Feb 2004 White Juan X X12 Oct 2004 Subtropical Storm Nicole X X26-27 Dec 2004 Nor'easter X X X X9 Aug 2007 Windstorm X X X7 Sep 2008 Heavy Rainfall, Tropical Storm Hannah X X22 Dec 2008 Winter Storm X1-2 Jan 2009 Winter Storm X X29-30 Aug 2009 Heavy Rainfall X2-3 Jan 2010 Nor'easter, High Tide, Storm Surge X X X X X6 Jun 2010 Heavy Rainfall X X X26 Aug 2010 Rainfall Event21-22 Dec 2010 Wind Storm, Storm Surge X X XWind
Used with permission <strong>of</strong> photographer (anonymity requested) November 2001Storms are agents <strong>of</strong> changein the coastal zoneCousins Shore <strong>PEI</strong>
Hurricane Juan, Sept.2003
Tropical Storm Hannah – Sept,„08North River Road, Charlottetown from Bypass
Photo by George SomersCornwall – TCH – Sept,2008
© D.L. Forbes GSC 2002© D.L. Forbes GSC 2002Sooner or laterthere is a price topayUSGS8 November 2001GSCTuktoyaktuk NWT (Beaufort Sea) August 2000
10-05-1112-28-1202-12-1412-02-1701-29-2312-27-3101-25-3901-05-4103-07-4212-22-4311-15-4504-11-4602-14-4812-31-4912-15-5111-07-5201-29-5403-23-5502-27-5711-10-5801-11-6021 Jan 196112-25-6104-05-6302-17-6401-09-6612-30-6703-07-6912-06-7011-30-7110-08-7201-17-7401-26-7503-18-7609-15-7701-08-8003-21-8112-24-8312-03-8503-03-8704-20-8811-24-8912-03-9110-28-9301-15-9604-01-9701-21-00Charlottetown surge events (>0.6 m) 1911-1998 (+ Jan 2000)in chronological order4.50m CDwater Charlottetown levels adjusted Storm for Surge RSL Events rise - 1911 - 1998 (chronological order)Maximum Water Level (2000) (m)Surge Height (m)4.003.503.002.502.001.501.000.500.00• flooding threshold was never exceeded before 1961• exceeded 7 times since
Metres (Chart Datum)Jan 21, 00Jan 21, 61Jan 21, 73Mar 17, 76Feb 05, 74Dec 30, 93Dec 25, 83Dec 01, 43Jan 12, 54Oct 20, 74Charlottetown - top 10 water level events (1911-2000)adjusted to year 2000 mean sea levelCharlottetown - Top Ten Water Level Events (1911 to 2000)5.004.504.003.504.233.963.84 3.83Max Water Level (Year 2000)3.73 3.69 3.64 3.623.49 3.493.002.502.001.501.000.500.00From Forbes et al 2001
3.9Charlottetown Tide Gauge Top Events 2001 to 20103.83.7723.7443.73.63.53.43.494 3.4893.4343.37219-Feb-0402-Jan-1021-Dec-103.312-Sep-0201-Feb-0627-Dec-103.23.1Metres above Chart DatumFive events between 2001 and 2010 would have made the top 10 listFrom 1911 to 2000!
Mean Annual Level Above Chart Datum (cm)Charlottetown – 1980-2010Rate <strong>of</strong> Increase 36cm/century190Mean Annual Water Level - Charlottetown185y = 0.3597x - 544.23R² = 0.56611801751701651980 1982 1984 1986 1988 1990 1992 1994 1996 1998 2000 2002 2004 2006 2008 2010YearMean Annual Water Level - Charlottetown Linear (Mean Annual Water Level - Charlottetown )Source: R. J. Daigle Enviro
Great <strong>Atlantic</strong> Storm<strong>of</strong> 21-22 January 2000From Forbes et al 2001
© Don Forbes GSCIce can be a hazard when itmoves onshoreMaximeville <strong>PEI</strong>Feb 2004Don Forbes, GSC, 2004
Darnley – Storm Waves
January 2, 2010 – Storm Surge Occurred at high tide Full moon NW winds shifted to easterly “Wave height 2 metres higher thanpreviously observed in living memory” –Lloyd MacCallum – former Marine<strong>Atlantic</strong> Ferry Captain
Fernwood CottagesDamaged25 feet <strong>of</strong> bank lost in some areas
Screaming for help, Victoria woman pulledfrom home as water rushed in (January 6,2010)Lillian Elliott <strong>of</strong> Victoria-By-The-Sea looks over her damaged houseand contents following a flood Saturday night during the height <strong>of</strong> a vicious winter storm.The 87-year-old woman was rescued by neighbours as floodwaters approached the height <strong>of</strong> her bed.Guardian photo - Nigel Armstrong
Victoria – Elliott Home
Lower MontagueEmergency barriers warn motorists along the St. Andrew’s Point roadway where the tidal surgetook major chunks out <strong>of</strong> the shoreline in Lower Montague across from the town <strong>of</strong> Georgetown.Guardian photo
December 21, 2010
News Stories
Storm Surge Facts December 21, 2010 – Full moon and lunareclipse High tide Charlottetown at 11:22 and 22:05and North Rustico at 17:27. Third Monday northeaster in as many weeks Strong NE winds gusting over 100km/hr Waves over 5 m in height Tide gauge at Charlottetown shows a peaklevel <strong>of</strong> 3.494 metres above chart datum at21:40. Tide gauge at Shediac, NB was destroyed bythis storm surge.
High Winds Resulting in HighWavesCavendish – Dec. 21stOyster Bed Bridge – Dec.21 st
Flooding – North RusticoDec. 22, 2010 – 15:29 Dec. 21, 2010 – 15:37
More Flooding – North RusticoFireHall - PlaygroundDecember 22 nd - 15:32December 21 st – 16:25
North Rustico – RiversideDr.
Brackley – Main Beach Dec‟10
Cavendish Beach Dec.21‟10
Seacow Pond - Breakwater
Graham‟s Pond -Gasperaux
Flooding – Wheatley RiverDec. 21, 2010 – 16:42
Coastal Erosion at SavageHarbour – Pigot‟s Pt CottageSubdivisionSept. 13, 2010 – 4:38pmDec. 22, 2010 – 12:35pm
Coastal Erosion at West PointLighthouseJan. 25, 2010 December 30, 2010
-West Point – RV UnitJanuary 25, 2010 December 30, 2010
Jacques Cartier ParkErosion Rates 2004-2011 (7 years)Survey MapSheet# <strong>of</strong> Points2004-2011Average Rate forMeasurementPeriod in mAnnual Ratein m1 – South parkarea2- North parkarea3- North tobeach access toRt. 124- Northernmost part <strong>of</strong>study area2 13.6 1.95 16.2 3.74 9.9 1.43 11.3 1.6Average for allMap Sheets in m2.1
Jacques Cartier Park – CoastalErosion Summary The average shoreline erosion ratecalculated in the Genese / Joseph reportfrom 1960 to 1989 was 0.88 m per year. The average shoreline erosion ratecalculated by TIR surveys between2004 and 2011 was 2.15 m per year. This is a 2.4 fold increase. Up to 18 m <strong>of</strong> shoreline lost in someareas as a result <strong>of</strong> Dec. 21 st , 2010storm surge.
Jacques Cartier Park –PumphouseJan. 25, 2010 Dec. 30, 2010
Central Kildare- Septic System onBeachJan. 25, 2010 Dec. 30, 2010
Central Kildare – Well onBeachJan. 25, 2010 Dec. 30, 2010
<strong>PEI</strong> National Park – DalvayParking Lot ErosionJuly 18, 2010 Dec. 22, 2010
1993-11-011994-11-011995-11-011996-11-011997-11-011998-11-011999-11-012000-11-012001-11-012002-11-012003-11-012004-11-012005-11-012006-11-012007-11-012008-11-012009-11-012010-11-01Lakeside Beach90.080.070.060.050.040.030.020.010.00.0Shoreline ErosionMonitoringLakeside Beach Site K-16Distance to shoreline in FeetShoreline at K-16Lakeside, Dec. 3, 20101993 to 2011
Anglo Tignish Over 25 feet <strong>of</strong> shorelinelost in Dec. 21 st stormsurge Cottage well is now onthe beach 15 foot cliffDec. 30, 2010Details
Panmure IslandJan. 13, 2010 Dec. 23, 2010
<strong>PEI</strong> National Park CoastalErosion Dec. 21 st storm surge was the secondstorm surge causing major damage at thePark in 2010 – Jan. 2 nd was the other one. The most recent surge resulted in anaverage <strong>of</strong> 7 to 10 metres <strong>of</strong> lost shoreline The sand dunes were hit hard especially atCovehead Pond. Lack <strong>of</strong> sea ice or ice foot is a contributingfactor in recent years.
Infrastucture Damage- Wharves$6.5 Million – DFO Estimate Many wharves suffered structuraldamage as a result <strong>of</strong> the storm• Sea Cow Pond• Graham‟s Pond• Sturgeon• Beach Pt.• Covehead• North Rustico Breakwater• Malpeque
Infrastructure Damage -Bridges Springbrook - Rt. 20 Oyster Bed Bridge – Rt. 6 Lennox Island Bridge Grand River Bridge – Rt. 12 Corran Ban Bridge- Rt. 6 St. Felix Bridge – Rt. 12
Bridge Photos –Dec. 21, 2010Oyster Bed Bridge – Rt.6 Rusticoville Bridge – Rt. 6
Infrastructure Damage –Lighthouses / Boardwalks Beach Pt. Range light blown over West Pt. Lighthouse and boardwalkdamage <strong>PEI</strong> National Park boardwalks – over$300K damage Cedar Dunes Park Boardwalk damage
Provincial Road ClosuresThe following roads were closed due to the storm:• Rt. 6 at Oyster Bed Bridge• Rt. 6 at Rusticoville Bridge• Rt. 6 at Corran Ban• Rt. 15 at Brackley Point• Rt. 12 Grand River Bridge• Rt. 20 at Springbrook• Tory Rd at Foxley River• Canadian Rd. at Foxley River• Harding Creek Rd• Rustico Harbour Rd• Myrick Shore Harbour Rd• Gladstone Rd.Photo by Gerald MacDougall
MacLean‟s Bridge, Lot 11Photo by Robbie Henderson, MLA
Natural Features Damage Sand dunes on the Gulf <strong>of</strong> St. Lawrence• <strong>PEI</strong> National Park• Thunder Cove• West Point• Lakeside• Panmure Island
Dune PhotosBrackley BeachWest Pt.
Private Land OwnerDamage There were reports <strong>of</strong> flooding, tree, land andinfrastructure damage from several areasincluding:• The Hebrides – MacEwen‟s Island, Stanley Bridge• Sherwood – Laurie Drive – tree damage• North Rustico – New home flooding , lobster trapsdamaged, mussel buoys lost• West Royalty – shingles blown <strong>of</strong>f ro<strong>of</strong>s <strong>of</strong> newhomes• Anglo Tignish – Cottage well now on beach• Milligan‟s Wharf – Cottage damaged• Lot 11 property damage including a dairy farm• Alberton – tree damage
Untold DamagePowerfulwaves cancause a lot <strong>of</strong>damage<strong>PEI</strong> shorelineis veryvulnerable- Cavendish
We can limit vulnerability to future changes by increasing awareness in the community defining the risks mapping potential impacts and hazard zones adopting proactive adaptation strategiesFrom Forbes, 2009