Periodic Analysis of Exports of Drugs, Pharmaceuticals & Fine ...
Periodic Analysis of Exports of Drugs, Pharmaceuticals & Fine ...
Periodic Analysis of Exports of Drugs, Pharmaceuticals & Fine ...

Create successful ePaper yourself
Turn your PDF publications into a flip-book with our unique Google optimized e-Paper software.
Monthly <strong>Analysis</strong> <strong>of</strong> India’s Pharmaceutical <strong>Exports</strong>Africa and Oceana are also growing higher than the average growth. <strong>Exports</strong> to CIS, EU, South Asia,Asia(Excluding middle east), LAC & Asean though growing less than average have grown better incomparison to Cum Jan 11.Table‐2(April10‐Feb11 Period Region Wise Comparison)Regions2009‐10 InUSD million2010‐11 inUSD MillionPeriodonperiod%April‐Mar2010(preecedingyear growth rate)Africa 1257 1599 27.22 ‐0.15Asean 5475 588 7.47 6.01Asia(Excluding Middle east) 372 398 7.06 10.5CIS 476 541 13.66 ‐17.6EU 1555 1724 10.89 ‐14.27LAC 627 639 1.92 ‐3.67Middle east 688 713 3.66 1.96North America 1845 2336 26.6 15.77Oceana 115 141 22.11 30.32Other European 132 109 ‐17.53 ‐9.75Other America 19 105 468 3.21Others 12 7.28 ‐39.23 75.36South Asia 331 363 9.76 2.71Grand Total 7974 9262 16.15 0.86Source CMIE/DGCISCountry Wise analysis(Please refer Table‐3 & Table‐3A)USA continues to be the best destination country <strong>of</strong> our exports though the contribution to Totalexports from USA is slightly down during the period, which has come down to 23.69 from 24.16% <strong>of</strong>the exports during Apr10‐Jan 2011, with a Period‐on‐Period (POP) growth <strong>of</strong> 29%. UK is the secondbest destination with a POP <strong>of</strong> 9% and a share <strong>of</strong> 3.59% <strong>of</strong> total exports.Pharmexcil July 2011 4
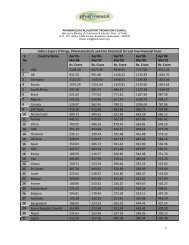
Monthly <strong>Analysis</strong> <strong>of</strong> India’s Pharmaceutical <strong>Exports</strong>Table‐3Top 26 Destination countries <strong>of</strong> India's exports <strong>of</strong> drugs, pharmaceuticals & fine chemicalsDuring Apr10‐Feb11 (in USD Million)CountryApr‐Feb2009‐10Apr‐Feb2010‐11Percentage<strong>of</strong> totalexportsCumpercentPeriodonPeriod% RankFy2009-10Gr%USA 1699.31 2172 23.45 23.45 27.82 1 23.09UK 307.78 342.08 3.69 27.14 11.14 2 28.27Russia 244.22 308 3.33 30.47 26.12 3 ‐17.58Germany 284.63 307.42 3.32 33.79 8.01 4 ‐4.92South Africa 222.59 283.71 3.06 36.85 27.46 5 0.03Brazil 188.38 203.51 2.20 39.05 8.03 6 ‐18.08Nigeria 172.11 201.15 2.17 41.22 16.87 7 ‐15.85Netherlands 127.39 172.43 1.86 43.08 35.36 8 ‐2.88Kenya 100.56 167.15 1.80 44.89 66.22 9 ‐1.86Canada 145.65 163.79 1.77 46.65 12.45 10 ‐32.21Turkey 122.82 143.6 1.55 48.20 16.92 11 2.01Viet Nam 134.38 129.1 1.39 49.60 ‐3.93 12 27.74Ghana 96.55 124.61 1.35 50.94 29.06 13 52.19France 96.83 122.59 1.32 52.27 26.60 14 4.92Spain 109.15 121.03 1.31 53.57 10.88 15 ‐12.24China 117.31 120.83 1.30 54.88 3.00 16 10.30Israel 100.49 118.08 1.27 56.15 17.50 17 ‐26.77Sri Lanka 96.7 115.34 1.25 57.40 19.28 18 9.61Italy 110.4 113.04 1.22 58.62 2.39 19 ‐13.94Ukraine 111.94 111.33 1.20 59.82 ‐0.54 20 ‐19.82Singapore 50.37 108.59 1.17 60.99 115.58 21 ‐0.43Australia 84.83 104.24 1.13 62.12 22.88 22 40.23Iran 104.43 102.65 1.11 63.23 ‐1.70 23 6.15Mexico 100.36 101.56 1.10 64.32 1.20 24 ‐4.03Bangladesh 83.9 97.88 1.06 65.38 16.66 25 2.38Thailand 111.61 97.34 1.05 66.43 ‐12.79 26 20.40Total <strong>of</strong> 26 5124.69 6153.05 66.43 20.07Grand Total 7974.16 9262.2 16.15Source CMIE/DGCISTable‐3 APharmexcil July 2011 5
Monthly <strong>Analysis</strong> <strong>of</strong> India’s Pharmaceutical <strong>Exports</strong>Top 26 Destination countries <strong>of</strong> India's exports <strong>of</strong> drugs, pharmaceuticals & fine chemicalsDuring Apr10‐Feb11 (in INR Cr)CountryApr‐Feb2009‐10Apr‐Feb2010‐11Percentage<strong>of</strong> totalexportsCumpercentPeriodonPeriod% RankFy2009-10Gr%USA 8087.01 9910.84 23.45 23.45 22.55 1 27.09UK 1464.70 1560.89 3.69 27.14 6.57 2 32.44Russia 1162.22 1405.42 3.33 30.47 20.93 3 ‐14.90Germany 1354.55 1402.76 3.32 33.79 3.56 4 ‐1.83South Africa 1059.30 1294.57 3.06 36.85 22.21 5 3.28Brazil 896.51 928.61 2.20 39.05 3.58 6 ‐15.42Nigeria 819.05 917.86 2.17 41.22 12.06 7 ‐13.12Netherlands 606.25 786.78 1.86 43.08 29.78 8 0.27Kenya 478.56 762.72 1.80 44.89 59.38 9 1.32Canada 693.17 747.37 1.77 46.65 7.82 10 ‐30.02Turkey 584.50 655.26 1.55 48.21 12.11 11 5.32Viet Nam 639.52 589.09 1.39 49.60 ‐7.88 12 31.88Ghana 459.48 568.61 1.35 50.94 23.75 13 57.13France 460.84 559.36 1.32 52.27 21.38 14 8.33Spain 519.45 552.26 1.31 53.57 6.32 15 ‐9.40China 558.27 551.37 1.30 54.88 ‐1.24 16 13.88Israel 478.25 538.78 1.27 56.15 12.66 17 ‐24.40Sri Lanka 460.21 526.29 1.25 57.40 14.36 18 13.17Italy 525.42 515.80 1.22 58.62 ‐1.83 19 ‐11.15Ukraine 532.74 507.98 1.20 59.82 ‐4.65 20 ‐17.21Singapore 239.69 495.52 1.17 60.99 106.73 21 2.81Australia 403.70 475.63 1.13 62.12 17.82 22 44.78Iran 496.99 468.37 1.11 63.23 ‐5.76 23 9.59Mexico 477.60 463.41 1.10 64.32 ‐2.97 24 ‐0.91Bangladesh 399.30 446.62 1.06 65.38 11.85 25 5.71Thailand 531.13 444.14 1.05 66.43 ‐16.38 26 24.30Total <strong>of</strong> 26 24388.41 28076.31 66.43 15.12Grand Total 37949.05 42263.38 11.37Source CMIE/DGCISPharmexcil July 2011 6
Monthly <strong>Analysis</strong> <strong>of</strong> India’s Pharmaceutical <strong>Exports</strong>During Apr10‐Feb11 our exports to Vietnam though have recorded a negative growth has improvedgrowth rate in comparison to April10‐Jan 11 period. <strong>Exports</strong> to Ukraine & Iran Cumulative Feb 2011have slipped into negative. <strong>Exports</strong> to UAE though continued in the same pattern as last month butslipped in ranking to 27 th .As a group the top 26 destinations, India’s exports has recorded a growth rate <strong>of</strong> over 20.07% &15.02% in USD and INR respectively, during the period <strong>of</strong> the two financial years in study, the exportsto rest <strong>of</strong> the world, while IN INR terms is 4.6%, has grown by 9% in USD terms.Table‐4: Country wise growth wise segmentation(20% and above)Amongst top 26 Destinations, countries to which exports are Growing 20% andabove (InUSD mn)PeriodCountryApr‐Feb2009‐10Apr‐Feb2010‐11Percentage<strong>of</strong> totalexportsCumpercentonPeriod% RankFy2009-10Gr%USA 1699.31 2172 23.45 23.45 27.82 1 23.09Russia 244.22 308 3.33 30.47 26.12 3 ‐17.58South Africa 222.59 283.71 3.06 36.85 27.46 5 0.03Netherlands 127.39 172.43 1.86 43.08 35.36 8 ‐2.88Kenya 100.56 167.15 1.80 44.89 66.22 9 ‐1.86Ghana 96.55 124.61 1.35 50.94 29.06 13 52.19France 96.83 122.59 1.32 52.27 26.60 14 4.92Singapore 50.37 108.59 1.17 60.99 115.58 21 ‐0.43Australia 84.83 104.24 1.13 62.12 22.88 22 40.23SOURCE DGCISAmongst table‐4 showing countries growing above 20%, Singapore, Month after Month continues totop the growth rates has recorded around 116% cumulatively. It is heartening to note that exports toUSA continue to grow above 25% which is high above the average growth during the period. <strong>Exports</strong>to Kenya have also grown exceptionally (66%). Ghana continues to feature in this group. <strong>Exports</strong> toNetherlands& France have fared like in April10‐Jan11, & to south Africa the rate <strong>of</strong> exports are betterthan last month analysis. Nine countries are featuring in this group as against ten during last analysis.Turkey & Bahamas does not feature in this group this time, while exports to Russia have gained a goodmomentum.Pharmexcil July 2011 7
Monthly <strong>Analysis</strong> <strong>of</strong> India’s Pharmaceutical <strong>Exports</strong>Table‐5( Country wise growth wise segmentation(Between 10 & 20%))Amongst top 26 destinations, countries to which <strong>Exports</strong> have been growing between 10&20%(in Usd mn)CountryApr‐Feb2009‐10Apr‐Feb2010‐11Percentage<strong>of</strong> totalexportsCumpercentPeriodonPeriod %RankFy2009-10Gr%UK 307.78 342.08 3.69 27.14 11.14 2 28.27Nigeria 172.11 201.15 2.17 41.22 16.87 7 ‐15.85Canada 145.65 163.79 1.77 46.65 12.45 10 ‐32.21Turkey 122.82 143.6 1.55 48.20 16.92 11 2.01Spain 109.15 121.03 1.31 53.57 10.88 15 ‐12.24Israel 100.49 118.08 1.27 56.15 17.50 17 ‐26.77Sri Lanka 96.7 115.34 1.25 57.40 19.28 18 9.61Bangladesh 83.9 97.88 1.06 65.38 16.66 25 2.38Source: DGCISOur exports to UK & Sri Lanka are growing faster during Apr‐Feb 2011, <strong>Exports</strong> to Turkey sloweddown a bit. <strong>Exports</strong> to Spain and Canada have grown almost at the same pace as during last analysis. .<strong>Exports</strong> to Bangladesh have picked up well growing at almost 17% cumulative.Pharmexcil July 2011 8
Monthly <strong>Analysis</strong> <strong>of</strong> India’s Pharmaceutical <strong>Exports</strong>Table‐6( Country wise growth wise segmentation(Between 1% & 10 %))Amongst top 26 destinations, countries to which <strong>Exports</strong> have been growing between1 &10%(in Usd mn)CountryApr‐Feb2009‐10Apr‐Feb2010‐11Percentage<strong>of</strong> totalexportsCumpercentPeriodonPeriod %RankFy 2009-10 Gr%Germany 284.63 307.42 3.32 33.79 8.01 4 ‐4.92Brazil 188.38 203.51 2.20 39.05 8.03 6 ‐18.08China 117.31 120.83 1.30 54.88 3.00 16 10.30Italy 110.4 113.04 1.22 58.62 2.39 19 ‐13.94Mexico 100.36 101.56 1.10 64.32 1.20 24 ‐4.03Source: DGCIS<strong>Exports</strong> growth rate to Brazil & Germany continue at the same pace as earlier review exports to china,and Italy have maintained the same tempo. Growth rate in exports to Mexico have come down a bit.Table‐7( Country wise growth wise segmentation(Negative %))Amongst top 25 destinations, countries to which <strong>Exports</strong> have been growingNegatively(in USD MnApr‐Feb2009‐10Apr‐Feb2010‐11Percentage<strong>of</strong> totalexportsCumpercentPeriodonPeriod %Fy 2009-10 Gr%CountryRankVietNam 134.38 129.1 1.39 49.60 ‐3.93 12 27.74Ukraine 111.94 111.33 1.20 59.82 ‐0.54 20 ‐19.82Iran 104.43 102.65 1.11 63.23 ‐1.70 23 6.15Thailand 111.61 97.34 1.05 66.43 ‐12.79 26 20.40Source: DGCISPharmexcil July 2011 9
Monthly <strong>Analysis</strong> <strong>of</strong> India’s Pharmaceutical <strong>Exports</strong>Table‐7 lists countries to who exports have grown negatively. In the period <strong>of</strong> present study fourcountries <strong>of</strong> the top 26 are featuring in this group as against two in the last study. While exports toVietnam has improved but exports to Ukraine, Iran & Thailand have slipped.Following are the statistics <strong>of</strong> the three completed preceding years<strong>Drugs</strong>, pharmaceuticals & fine chemicals 2007‐08 2008‐09 2009‐10 CAGRRupee terms ( Cr) 30,759.64 40,421.71 42,091.90 17.46%US$ terms (Million) 7,644.05 8,802.64 8,878.27 15.47%Pharmexcil July 2011 10