The formation of ridges and troughs in the atmosphere has important effects on weather at sea. Here is a look at ridge and trough structures and how they can influence surface low pressure zones and precipitation.
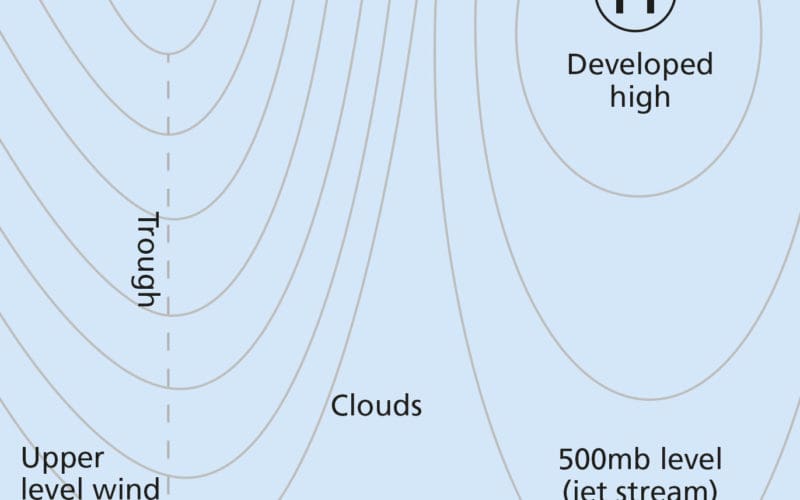
Distinctive cloud shapes form in the vicinity of the jet stream and are dependent on the extent of both horizontal and vertical mixing of warm, moist air and cold, dry air. The amplitude and width of ridges and troughs directly influence cloud shape and also indicate surface weather feature development. High-amplitude troughs tend to pull large amounts of cold, dry air south into regions of warm, moist air, bringing cloudiness and precipitation to the region where the two air masses meet, which is generally on the east side of a trough.
Troughs, for example, are often located by noting a shift in upper-level wind flow from a southwesterly to northwesterly direction (as seen by cloud pattern) and by recognizing that clear air usually exists to the west of a trough (cold and low humidity) and clouds to the right, or east (cold air that cools warm air to its dewpoint). Ridges are often found using infra-red images since cirrus clouds tend to form at the point where a ridge turns. Cirrus clouds are difficult to see on visible imagery because they are thin and do not reflect light, but they appear bright white (high and cold) on infrared imagery.
To most sailors the location of surface low pressure systems is of prime interest, since these systems usually bring the strongest winds and largest seas. Using satellite imagery in conjunction with surface and 500-mb charts is a good way to detect low formation early on, with both rate of growth and direction of movement noted. With practice one can approximate the central pressure of a low and internal wind speed by measuring the extent of cloud spiral and the shape of upper- and low-level clouds.
Low pressure systems fall into three general categories: thermal lows (sea breezes), air mass lows (midlatitude gales), and tropical lows (hurricanes). Each has a distinctive cloud pattern and stages of development.
Midlatitude lows, for example, normally form on the surface under or to the east of an upper-level trough. A cloud shape called a baroclinic leaf is the first cloud to appear as a surface low forms; this is followed in succession by a vorticity cloud and deformation cloud. After these three cloud regions form and then come together, a low pressure system takes on a comma shape — the signature of a well-developed low pressure system.
Surface high pressure regions, which are most often cloud free, can be located in satellite imagery since their outer edges are often rimmed with clouds. Clouds around a high will indicate the extent of troughing to the west and east and, by the shape of the cloud line, the width and amplitude of that trough. A well-developed surface and upper-level high, with a central pressure of 1,030 mb or better, is called a blocking high and will cause approaching low pressure systems to either stall or go north around the surface high.
Reverse blockers
Another type of high pressure feature is a reverse block, in which (in the northern hemisphere) an upper-atmosphere high pressure area is situated directly north of an upper low, resulting in jet stream winds blowing from east to west between the two systems.
This phenomenon pushes the track of weather systems to the south of their normal track, often bringing unseasonably cold weather to midlatitudes. Satellite imagery will show these features by the location and shape of cloud shields, bands, and lines.
It should be noted that within the Earth’s dynamic atmosphere there are patterns and cycles that repeat in weekly and monthly intervals, and for a navigator who watches the weather daily these cycles and repetitions can be spotted in their formative stages. With practice an astute navigator can note these patterns and use that information in predicting weather.
In addition to surface and aloft weather, satellite imagery can show the location of ocean currents using temperature readings obtained through infrared imagery. Shades of gray or false color can be assigned to selected temperatures, thus vividly portraying the flow of currents such as the Gulf Stream and the Kuroshio and Agulhas currents, all of which have temperatures measurably different from the surrounding water.
Preparation for an offshore voyage should include a review of all weather information sources. Consideration should be given to integrating real-time satellite images with weather charts. voice broadcasts and onboard observations